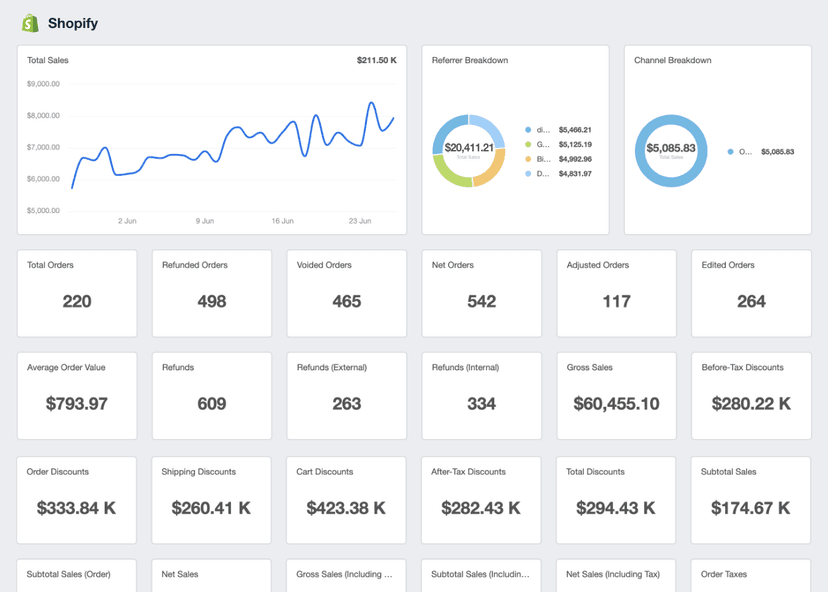
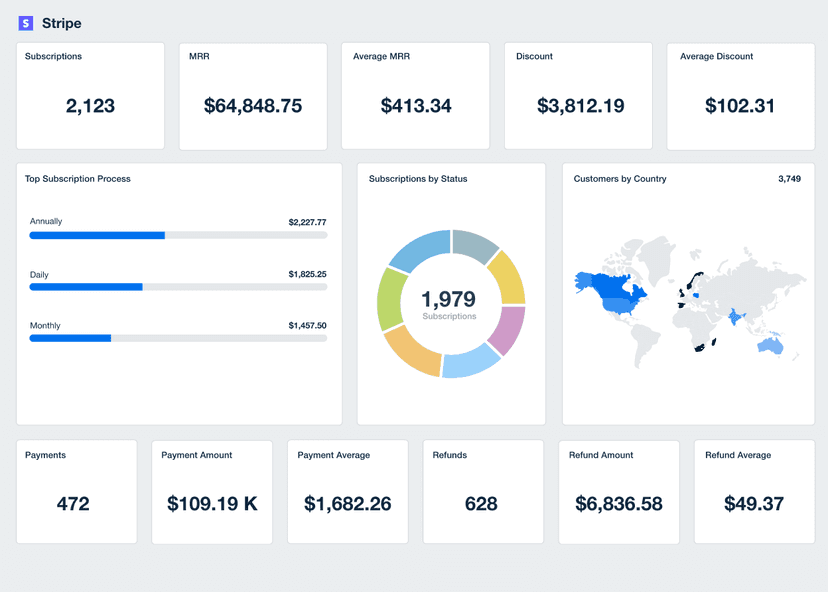
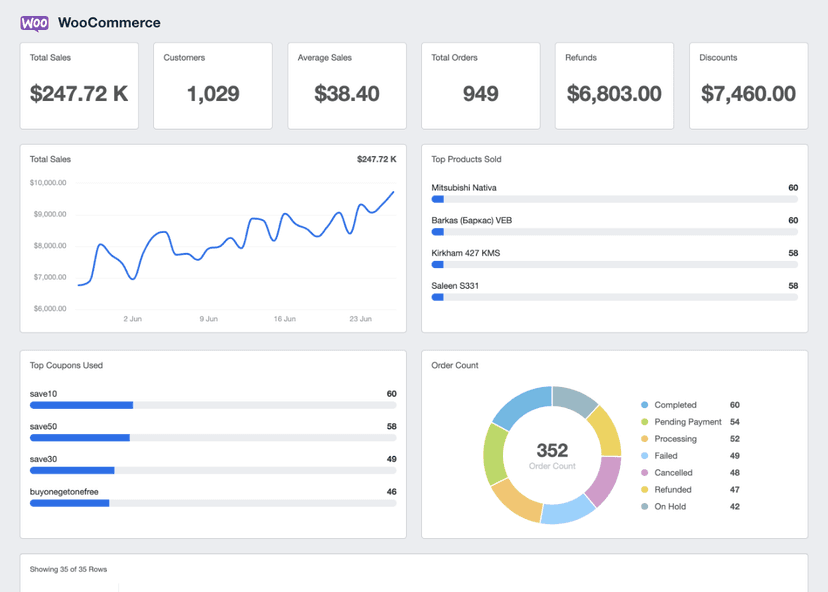
Add-to-Cart Rate
Identify Friction Points
Pinpoint any conversion hurdles and use this data to optimize the purchase path.
A/B Testing
Experiment with different variables (e.g., CTAs, pricing strategies) to assess what resonates best.
Campaign Effectiveness
Understand whether eCommerce campaigns are persuading consumers to make purchases.
Conversion Rate Correlation
Monitor how often conversions happen after an item is added to cart and use this to inform upselling strategies.
Why Add-to-Cart Rate Is Important
Add-to-Cart Rate reveals the allure of products, in addition to the effectiveness of the online store's layout and product placement. It’s a crucial barometer of initial consumer interest and a predictive indicator of sales potential.
Tracking this rate over time helps recognize trends, forecast sales, and set inventory expectations. In isolation, Add-to-Cart Rate offers a snapshot of purchase intent, capturing when a shopper decides to consider a product seriously.

Stop Wasting Time on Manual Reports... Get Ecommerce Insights Faster With AgencyAnalytics
How Add-to-Cart Rate Relates To Other KPIs
Add-to-Cart Rate directly influences Conversion Rate, as it is an initial step in the purchasing funnel.
When more visitors add items to their cart, the likelihood of completing a purchase increases. Conversely, if the cart rate is high, but the Conversion Rate is low, it may indicate issues later in the shopping process (e.g., a slow checkout).
Add-to-Cart Rate also shares a reciprocal relationship with website traffic quality. High-quality traffic tends to yield a higher Add-to-Cart Rate, suggesting that engaged users are more likely to consider a purchase.

How To Calculate Add-to-Cart Rate
To calculate Add-to-Cart Rate, divide the total number of cart-related actions within a specific timeframe by the total number of visitors to the site. Then, multiply the result by 100 to get a percentage. Here’s a formula for quick reference:
What Is a Good Add-to-Cart Rate?
A good average Add-to-Cart Rate typically ranges between 8% to 10%. This indicates that the website effectively engages visitors, and products are well-aligned with purchase-driven consumers.
To sustain a high Add-to-Cart rate, maintain a user-friendly design, fast loading times, and mobile responsiveness.
What Is a Bad Add-to-Cart Rate?
A bad average Add-to-Cart Rate is generally considered to be below 3%. Such a low figure suggests issues with the site’s user experience, product appeal, or pricing strategies.
To improve a bad Add-to-Cart rate, focus on enhancing the user experience, provide compelling product information, and streamline the checkout process.
How To Set Goals and Benchmarks for Add-to-Cart Rate
To set effective benchmarks, begin by reviewing past Add-to-Cart Rates. To create realistic targets, consider the previous impact of website design updates, product lineup shifts, and strategy adjustments on these rates.
It’s also useful to break down this data by product categories, customer demographics, or marketing channels to identify patterns or trends. Based on this analysis, decide on realistic goals, considering historical performance and industry benchmarks.
Why Add-to-Cart Rate Matters to Clients
Clients view Add-to-Cart Rate as a direct pulse on consumer interest and product market fit. A high rate means visitors are not just browsing–they’re taking the first steps toward a purchase.
This KPI helps clients understand which products are window-shopping and which ones are making it into the checkout line. A change in this rate may signal that it’s time to reassess product appeal or promotional strategies. This ensures that clients’ offerings stay aligned with customer desires.

Why Add-to-Cart Rate Matters to Agencies
For agencies, Add-to-Cart Rate is a diagnostic tool to dissect the shopping journey and optimize marketing efforts.
A robust rate validates an agency’s creative and strategic prowess, showcasing their ability to craft compelling product narratives. Conversely, a dip may prompt an analysis of user experience, campaign messaging, and funnel optimization. Agencies leverage this KPI to refine tactics, adjust targeting, and improve user engagement strategies.

Save Time and Money by Automating Your Client Reporting
Best Practices for Analyzing and Reporting on Add-to-Cart Rate
Analyzing Add-to-Cart rate is essential for sharpening campaign precision, boosting advertising efficiency, and driving revenue. Here are some reporting best practices to follow.
Consistent Tracking
Use a consistent method for tracking Add-to-Cart events, which ensures data reliability over time.
Segmentation
Break down Add-to-Cart rate by different variables such as traffic source, device type, product category, or customer segment to identify specific trends and behaviors.
Use Consistent Time Frames
Report on Add-to-Cart rate using consistent time periods (daily, weekly, monthly) to track trends and changes over time accurately.
Highlight Changes and Trends
Clearly point out any significant changes or trends in Add-to-Cart rate, such as seasonal variations or impacts from marketing campaigns.
Clear Visualization
Use charts and graphs to visually represent the Add-to-Cart rate trends, which makes data easier to understand and actionable.
Connect to Other Metrics
Report Add-to-Cart rate alongside related metrics such as Conversion Rate, Average Order Value, and Cart Abandonment Rate to give a complete picture of the shopping funnel.
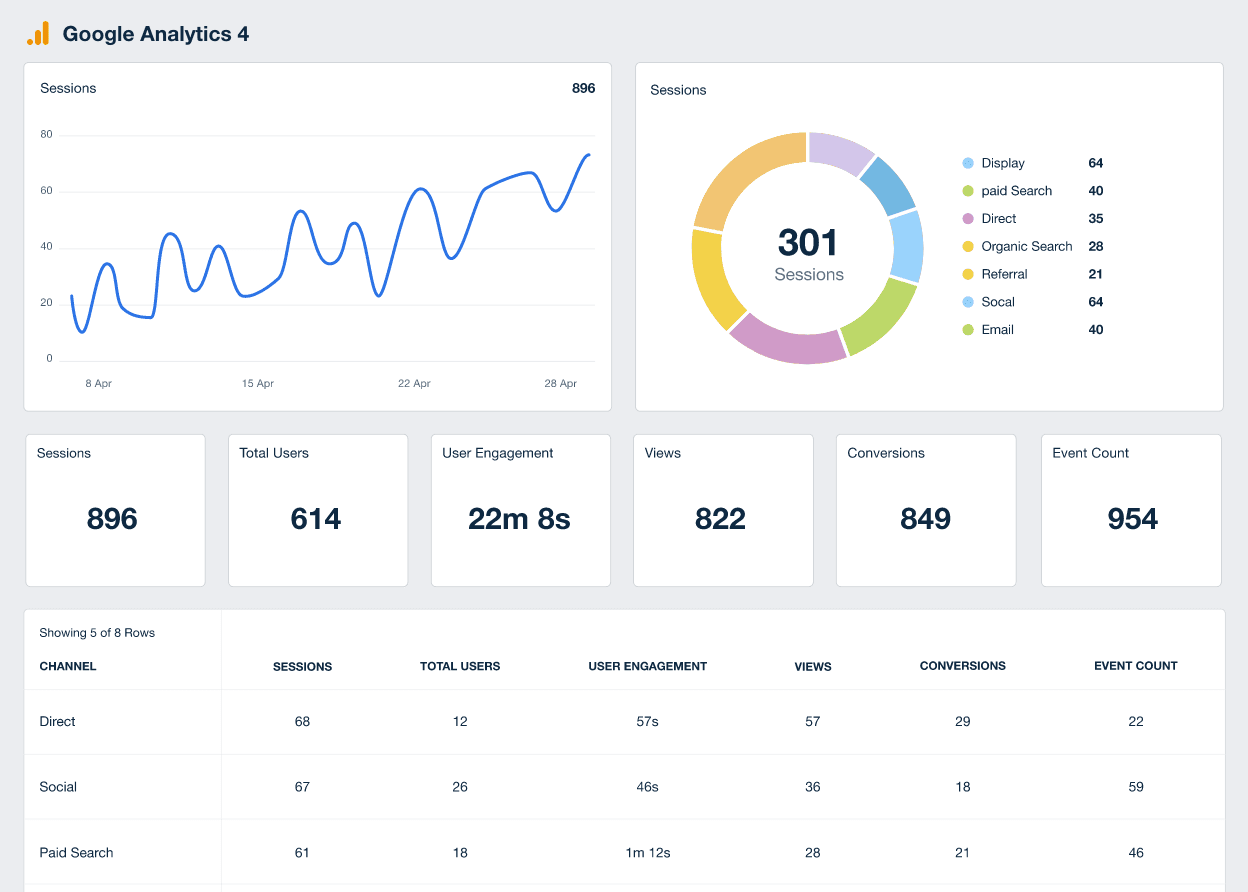
Google Analytics 4 Dashboard Example
Related Integrations
How To Improve Add-to-Cart Rate
Improving Add-to-Cart rate often involves subtle yet effective adjustments to the shopping experience. Consider these straightforward strategies.
Streamline Navigation
Ensure a smooth, intuitive journey from product browsing to cart with minimal steps involved.
Enhance Imagery
Use high-resolution images and videos to showcase products effectively, prompting more Add-to-Cart actions.
Accelerate Load Times
Optimize website performance to facilitate quicker cart additions and an enhanced user experience.
Related Blog Posts
See how 7,000+ marketing agencies help clients win
Free 14-day trial. No credit card required.


