Net Promoter Score (NPS)
Target Refinement
Identify key demographics of satisfied customers to refine target audiences.
Feedback Analysis
Use customer feedback to adjust strategies and improve the customer experience.
Performance Evaluation
In service-oriented sectors, use NPS to gauge employee performance and customer service.
Product Development
Analyze NPS responses to gain insights about product strengths and weaknesses.
Why Net Promoter Score Is Important
NPS Score is essential for understanding customer loyalty and satisfaction. It offers a direct insight into how customers perceive a brand, providing a snapshot of their willingness to endorse the company to others.
Moreover, NPS is a valuable tool for gauging the health of customer relationships. A high score often correlates with repeat business and organic growth through word-of-mouth referrals. By tracking NPS, organizations better understand their market position and the likelihood of customer advocacy.

Stop Wasting Time on Reports. Get Marketing Insights Faster & Drive Results.
How Net Promoter Score Relates To Other KPIs
Net Promoter Scores often intertwine with other key performance indicators (KPIs), such as Customer Acquisition Cost (CAC). A high NPS and a low CAC is a favorable situation for businesses. It suggests that customers are cost-effective to acquire while being likely to recommend the brand to others.
Similarly, NPS has a symbiotic relationship with Customer Lifetime Value (CLV). A high NPS often leads to increased CLV, as satisfied customers tend to stay longer and purchase more. Additionally, metrics like Engagement Rate and Click-through Rate may influence NPS. Positive engagement frequently correlates with a higher NPS, which indicates effective content that resonates with the audience.
NPS also influences customer loyalty metrics like Customer Retention Rate and Churn Rate. That’s because highly satisfied customers are more likely to continue a business relationship over time. Conversely, dissatisfied customers have a higher chance of churning and seeking alternative options.

Customer satisfaction is ultimately the goal of a great partnership. Do clients love you even more because of a new service or product offering? Hopefully, the answer is yes! All other metrics are secondary.
Key Factors That Impact Net Promoter Score
Several elements influence the Net Promoter Score, primarily centered around customer experience and satisfaction. One significant factor is the clarity and relevance of the NPS questions posed in Net Promoter Score surveys. A well-framed question captures genuine customer sentiments, which directly affects the overall NPS by distinguishing between promoters, passives, and detractors accurately.
Additionally, the effectiveness of the net promoter system hinges on consistent follow-up and feedback analysis. Implementing a robust Net Promoter Score system helps identify trends and areas for improvement, ensuring that the feedback collected leads to actionable insights and enhances customer loyalty.
NPS is more than measuring customer loyalty–it’s also about using the data with intention and improving this core business metric over time. By understanding the customer journey, agencies are better equipped to enhance engagement and fuel business growth.

Discover the Client Reporting Platform Trusted by Over {{customer-count}} Marketing Agencies
How To Calculate Net Promoter Score
To run a Net Promoter Score calculation, conduct a survey asking customers to rate their likelihood of recommending the company. A scale of 0 to 10 is typically provided, with 0 indicating “Very Unsatisfied” and 10 being “Very Satisfied”. Customers are categorized as Promoters, Passives, or Detractors.
NPS is then derived by subtracting the percentage of Detractors from the percentage of Promoters. This simple Net Promoter Score calculation provides a clear indication of customer advocacy and loyalty.
NPS Score Formula Example
What Is a Good Net Promoter Score?
A good NPS score typically falls between +30 and +70. This range indicates a healthy amount of loyal customers and a high level of customer satisfaction.
Achieving average Net Promoter Scores above 50 is excellent, suggesting that many existing customers are satisfied. Strong NPS scores mean solid customer relationships, which may result in revenue growth or new customers.
What Is a Bad Net Promoter Score?
A NPS score below 0 is an indication that improvements are required. This ratio means that there are more Detractors than Promoters, suggesting widespread customer dissatisfaction. If a score deeps below -51, this highlights serious problems with customer satisfaction and brand perception.
A negative NPS score is a clear signal for a company to reevaluate and improve its customer experience, product quality, or overall brand perception. Even a negative word (or two) stunts business growth, which is why it’s important to address unhappy customers.
How To Set Net Promoter Score Benchmarks and Goals
To create benchmarks and goals for NPS, start by researching the average NPS based on industry. Next, analyze historical NPS scores to identify trends and influential factors. Use this data from NPS surveys to set specific benchmarks and realistic goals.
For instance, for a current NPS of 30 and an industry average NPS of 50, a goal of 45 is realistic. An internal definition of a good vs. bad NPS score also depends on historical data. For example, if the NPS score has been stable at +30 for several years, but suddenly dips to +10, that should raise concerns, even though the score has not yet dipped into what would otherwise be considered a problematic score.
Also, consider segmenting NPS by different customer groups or services to get more granular insights. Regularly review and adjust these goals as needed, considering industry changes and shifts in customer behavior.

Understanding Passives, Promoters, and Dectractors
When respondents answer "How likely are you to recommend our product/service to a friend or colleague?" question on a scale of 0 to 10, their answers grouped into three categories:
Promoters (score 9-10): Loyal customers who will keep buying and refer others, fueling growth.
Passives (score 7-8): Satisfied but unenthusiastic customers who are vulnerable to competitive offerings.
Detractors (score 0-6): Unhappy customers who damage the brand and impede growth through negative word-of-mouth.
The overall NPS score is then calculated by subtracting the percentage of Detractors from the percentage of Promoters.

Why Net Promoter Score Matters to Clients
Clients value Net Promoter Score because it clearly indicates customer perception and how well their brand resonates. A strong NPS score signifies a healthy customer base, suggesting that clients retain and leverage customers as brand advocates.
This customer experience metric helps clients understand whether products or services are meeting customer needs. Plus, NPS identifies areas for improvement (e.g., fixing app bugs), which could affect brand perception and loyalty in the long run.

Why NPS Matters to Agencies
For agencies, Net Promoter Score is a tangible outcome of their marketing strategies and initiatives. A high NPS indicates that the agency’s efforts yield positive customer experiences, which also impacts client retention in the long run.
NPS is also useful for benchmarking client performance against competitors and industry standards. By considering qualitative feedback from NPS surveys, agencies are better able to provide actionable improvements that help clients reach their goals.

Showcase Your Agency’s Success. Unlock White-Label Reporting Today
Best Practices When Analyzing and Reporting on NPS
For effective Net Promoter Score reporting, agencies must convey insights clearly and strategically. Here are some tips to communicate NPS insights in a practical and client-friendly manner.
Explain the Methodology
Clearly articulate how NPS was calculated and what the response rates were, which ensures data transparency.
Incorporate Qualitative Feedback
Alongside quantitative NPS scores, include customer feedback to give more depth and highlight specific areas for improvement.
Segment NPS Data
Break down NPS results into customer segments (e.g., demographics, purchase history) to provide more nuanced insights.
Link NPS to Other KPIs
Show how NPS correlates with other metrics like Churn Rate and Customer Retention Rate to provide a holistic view of performance.
Discuss Implications for Strategy
Connect NPS data to marketing strategies, showing how specific approaches may have influenced customer perceptions and satisfaction.
Recommend Actionable Improvements
Based on NPS findings, suggest data-informed strategies for enhancing customer satisfaction and loyalty.
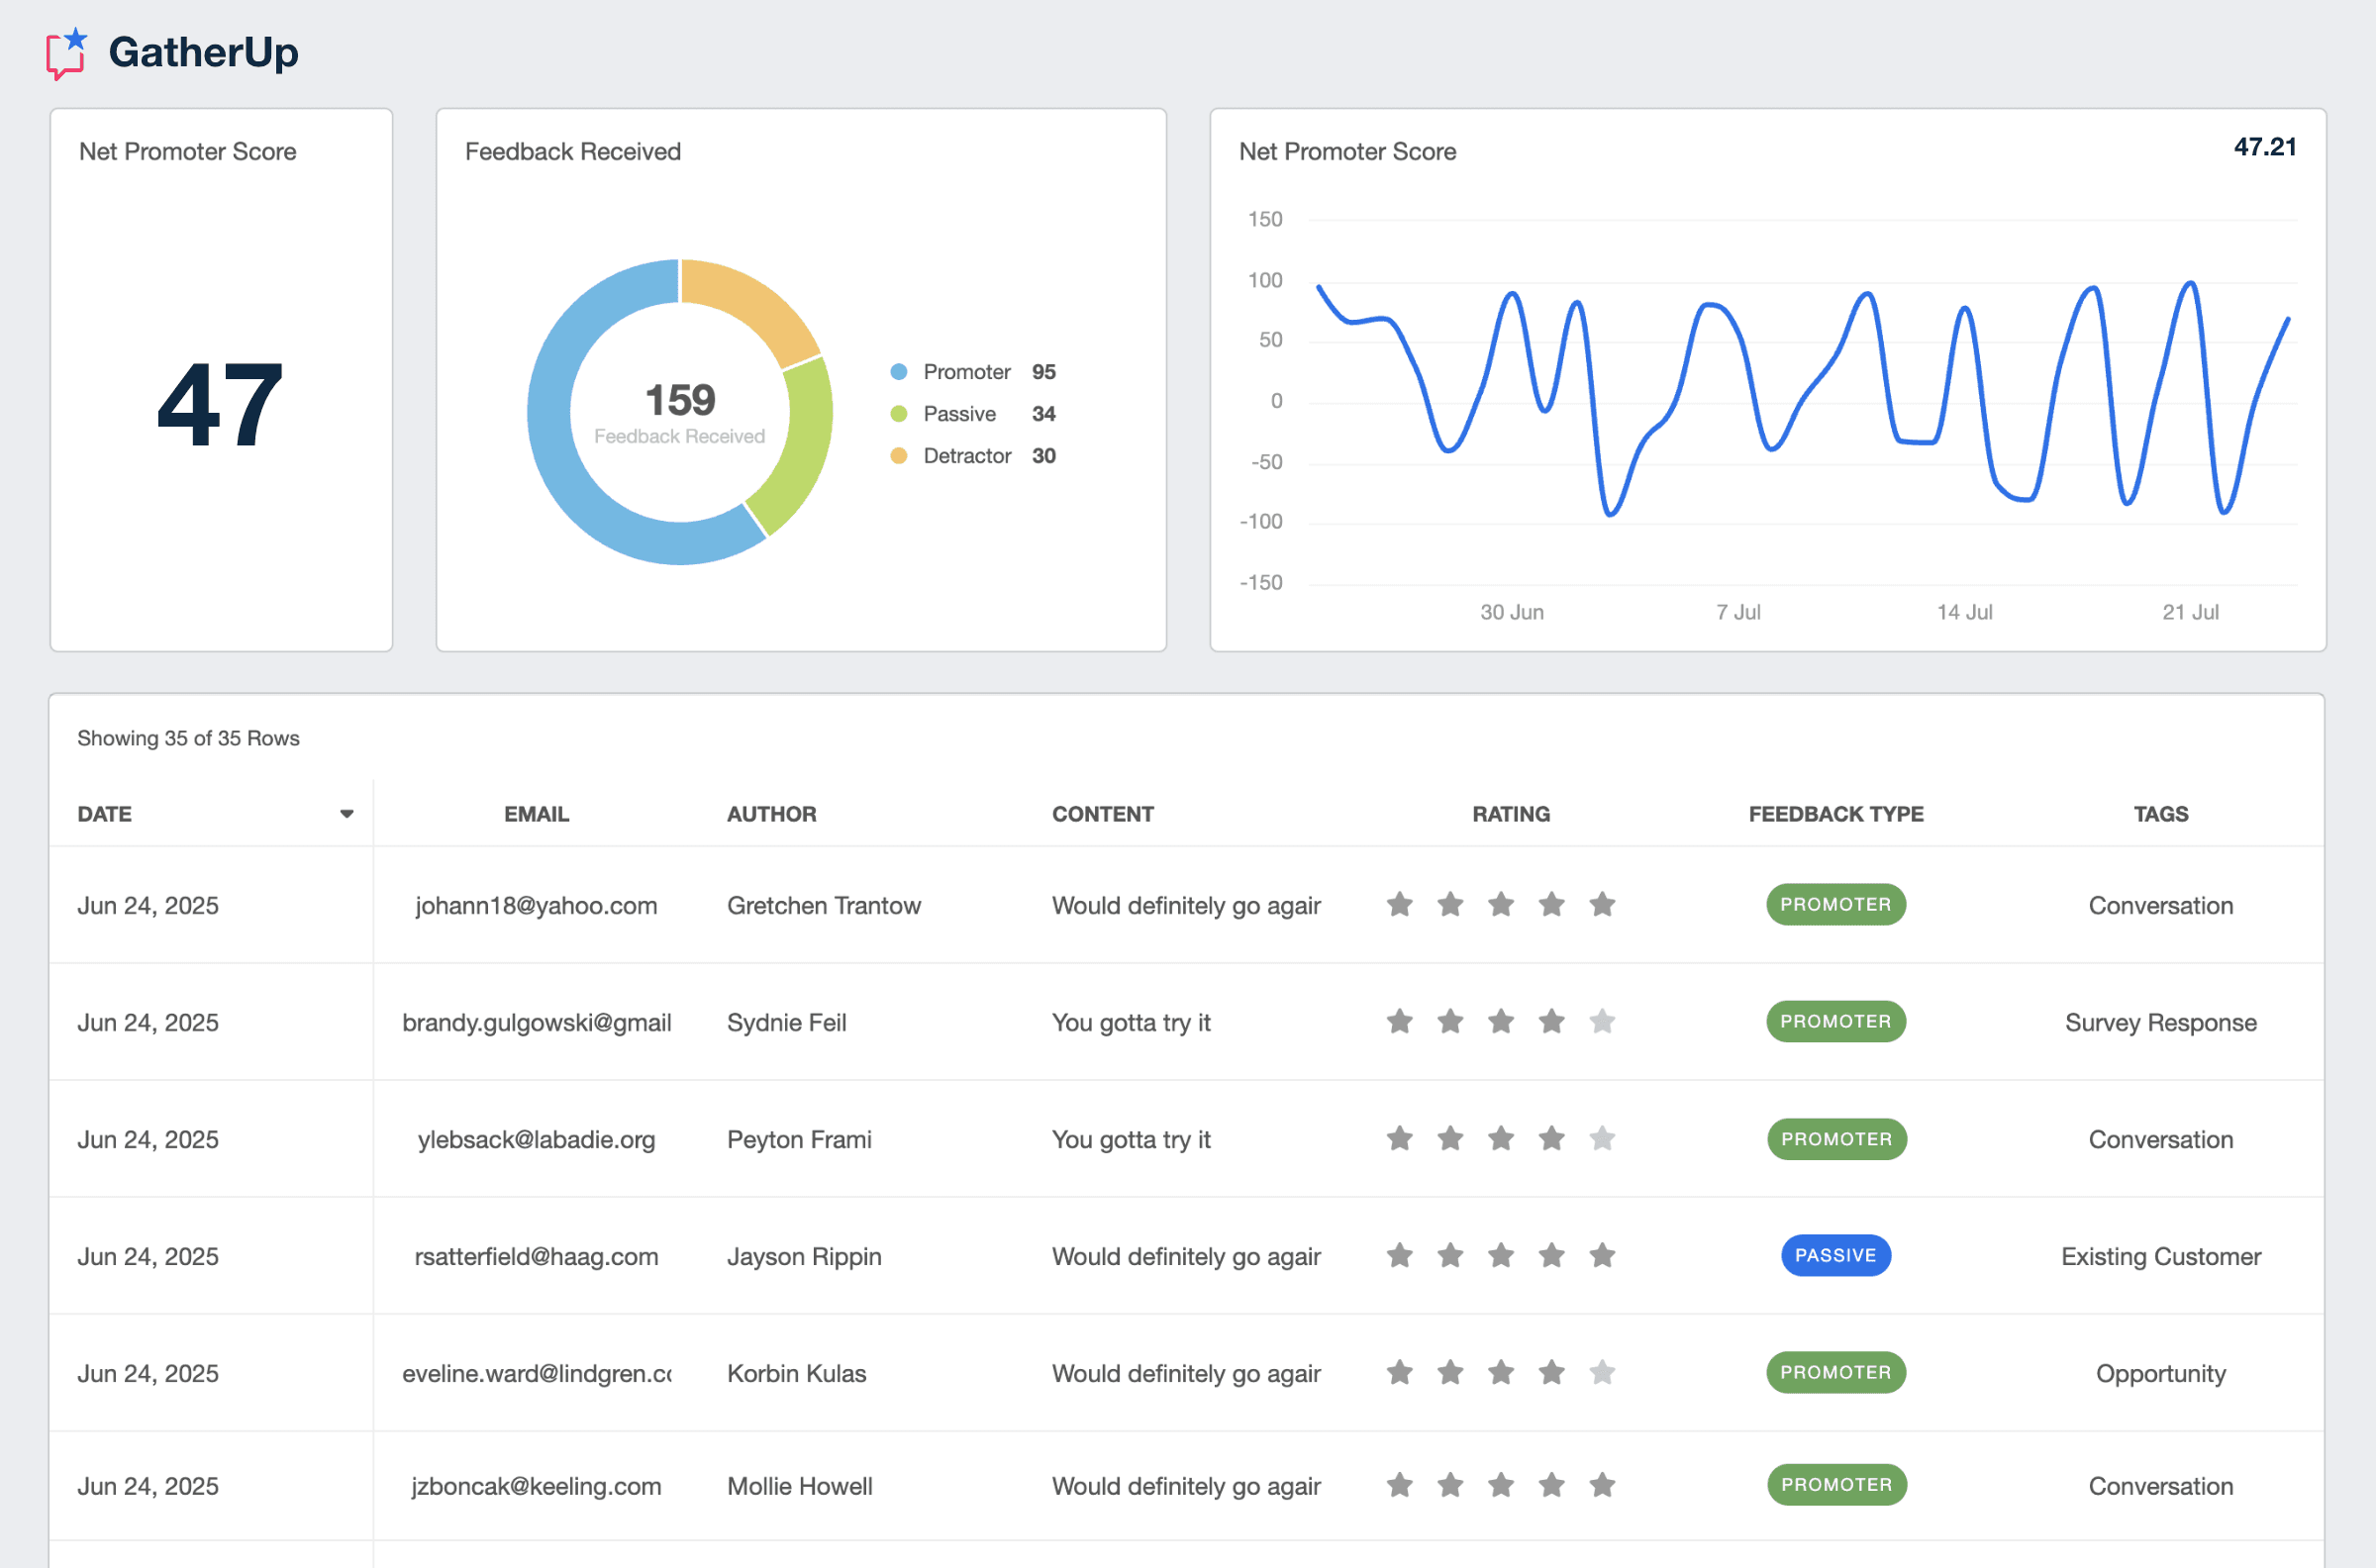
GatherUp Dashboard Example
Related Integrations
How To Improve Net Promoter Score
A favorable NPS is a crucial part of building a brand reputation and fostering loyal customers. Here are a few practical tips to increase this score.
Focus on Service
Ensure the customer service team is well-trained, empathetic, and quick to resolve issues.
Gather Feedback
Seek regular customer feedback through surveys, forms, and direct communication.
Improve Product Quality
Put customer feedback into action by making improvements and ensuring their expectations are met.
Related Blog Posts
See how 7,000+ marketing agencies help clients win
Free 14-day trial. No credit card required.


