Table of Contents
QUICK SUMMARY:
Website performance metrics measure a site's speed, user experience, and functionality. Marketing agencies look at them to optimize client's site and boost overall client satisfaction. This article lists 13 essential metrics, guiding on how to track and enhance website performance for improved user engagement and business outcomes. It covers the role of these metrics in delivering a seamless experience, necessary for meeting both user expectations and search engine standards.
The most informative website in the world won’t mean anything if it doesn’t load fast enough.
After you’ve put all that effort into creating your client’s content, optimal website performance is the only way to ensure it gets the traction it deserves.
It isn’t just about a visually appealing website or adding a couple of pretty pictures, though. Optimizing web performance puts user experience in the front seat, ensuring that site visitors get exactly what they’re looking for, when they’re looking for it.
Beyond user engagement, enhancing a site’s performance increases the chances of a high conversion rate and even a favorable brand perception.
It’s also a given that you’ll have limited control over some things (like Google algorithm updates). However, you don’t want your client to lose potential customers over website optimization issues that could have been rectified. After all, it’s easy to open another browser tab, find faster websites, and access information quickly.
That said, how should you go about tracking website performance? As an agency, you’ll want to go beyond surface-level insights and demonstrate the value you provide to clients by using the right KPIs and metrics to track success.
Why Does Website Performance Matter?
Website performance metrics are often an overlooked part of the puzzle that is SERP success. Arguably, though, it’s one of the most important pieces.
To put it succinctly, optimal website performance matters because it:
Helps clients reach their overall website goals (e.g., climbing up on search engine results)
Ensures a great user experience, which increases the chances of high engagement and conversion rates down the road
Enhances brand perception by delivering a well-optimized, professional finish (in some cases, it’s the first touchpoint a customer has with your client’s brand!)
Perceived vs. Actual Website Performance
Before we get into the ins and outs of assessing your clients’ websites, it’s important to distinguish between perceived and actual website performance.
To help you understand this better, consider that:
Perceived website performance is relative to the user experience. In other words, it takes their subjective perception into account when using your client’s website. For example, a site visitor may think there’s a fast page loading time simply because core website elements showed up quickly. In reality, the actual page loading time may have been significantly slower.
Actual website performance is based on measurable metrics that give a more concrete and accurate indication of how your client’s website is performing.
While both types of metrics are important, keep in mind that user experience should always remain at the forefront.
Perception matters, after all.
We understand that a website is often the first point of contact between a business and its potential customers, which is why we prioritize good design and user experience.
Adam Binder, Founder and CEO at Creative Click Media
13 Website Performance Metrics Your Agency Should Know
To help your clients optimize their websites, there are a few key performance metrics to keep tabs on–let’s explore further.
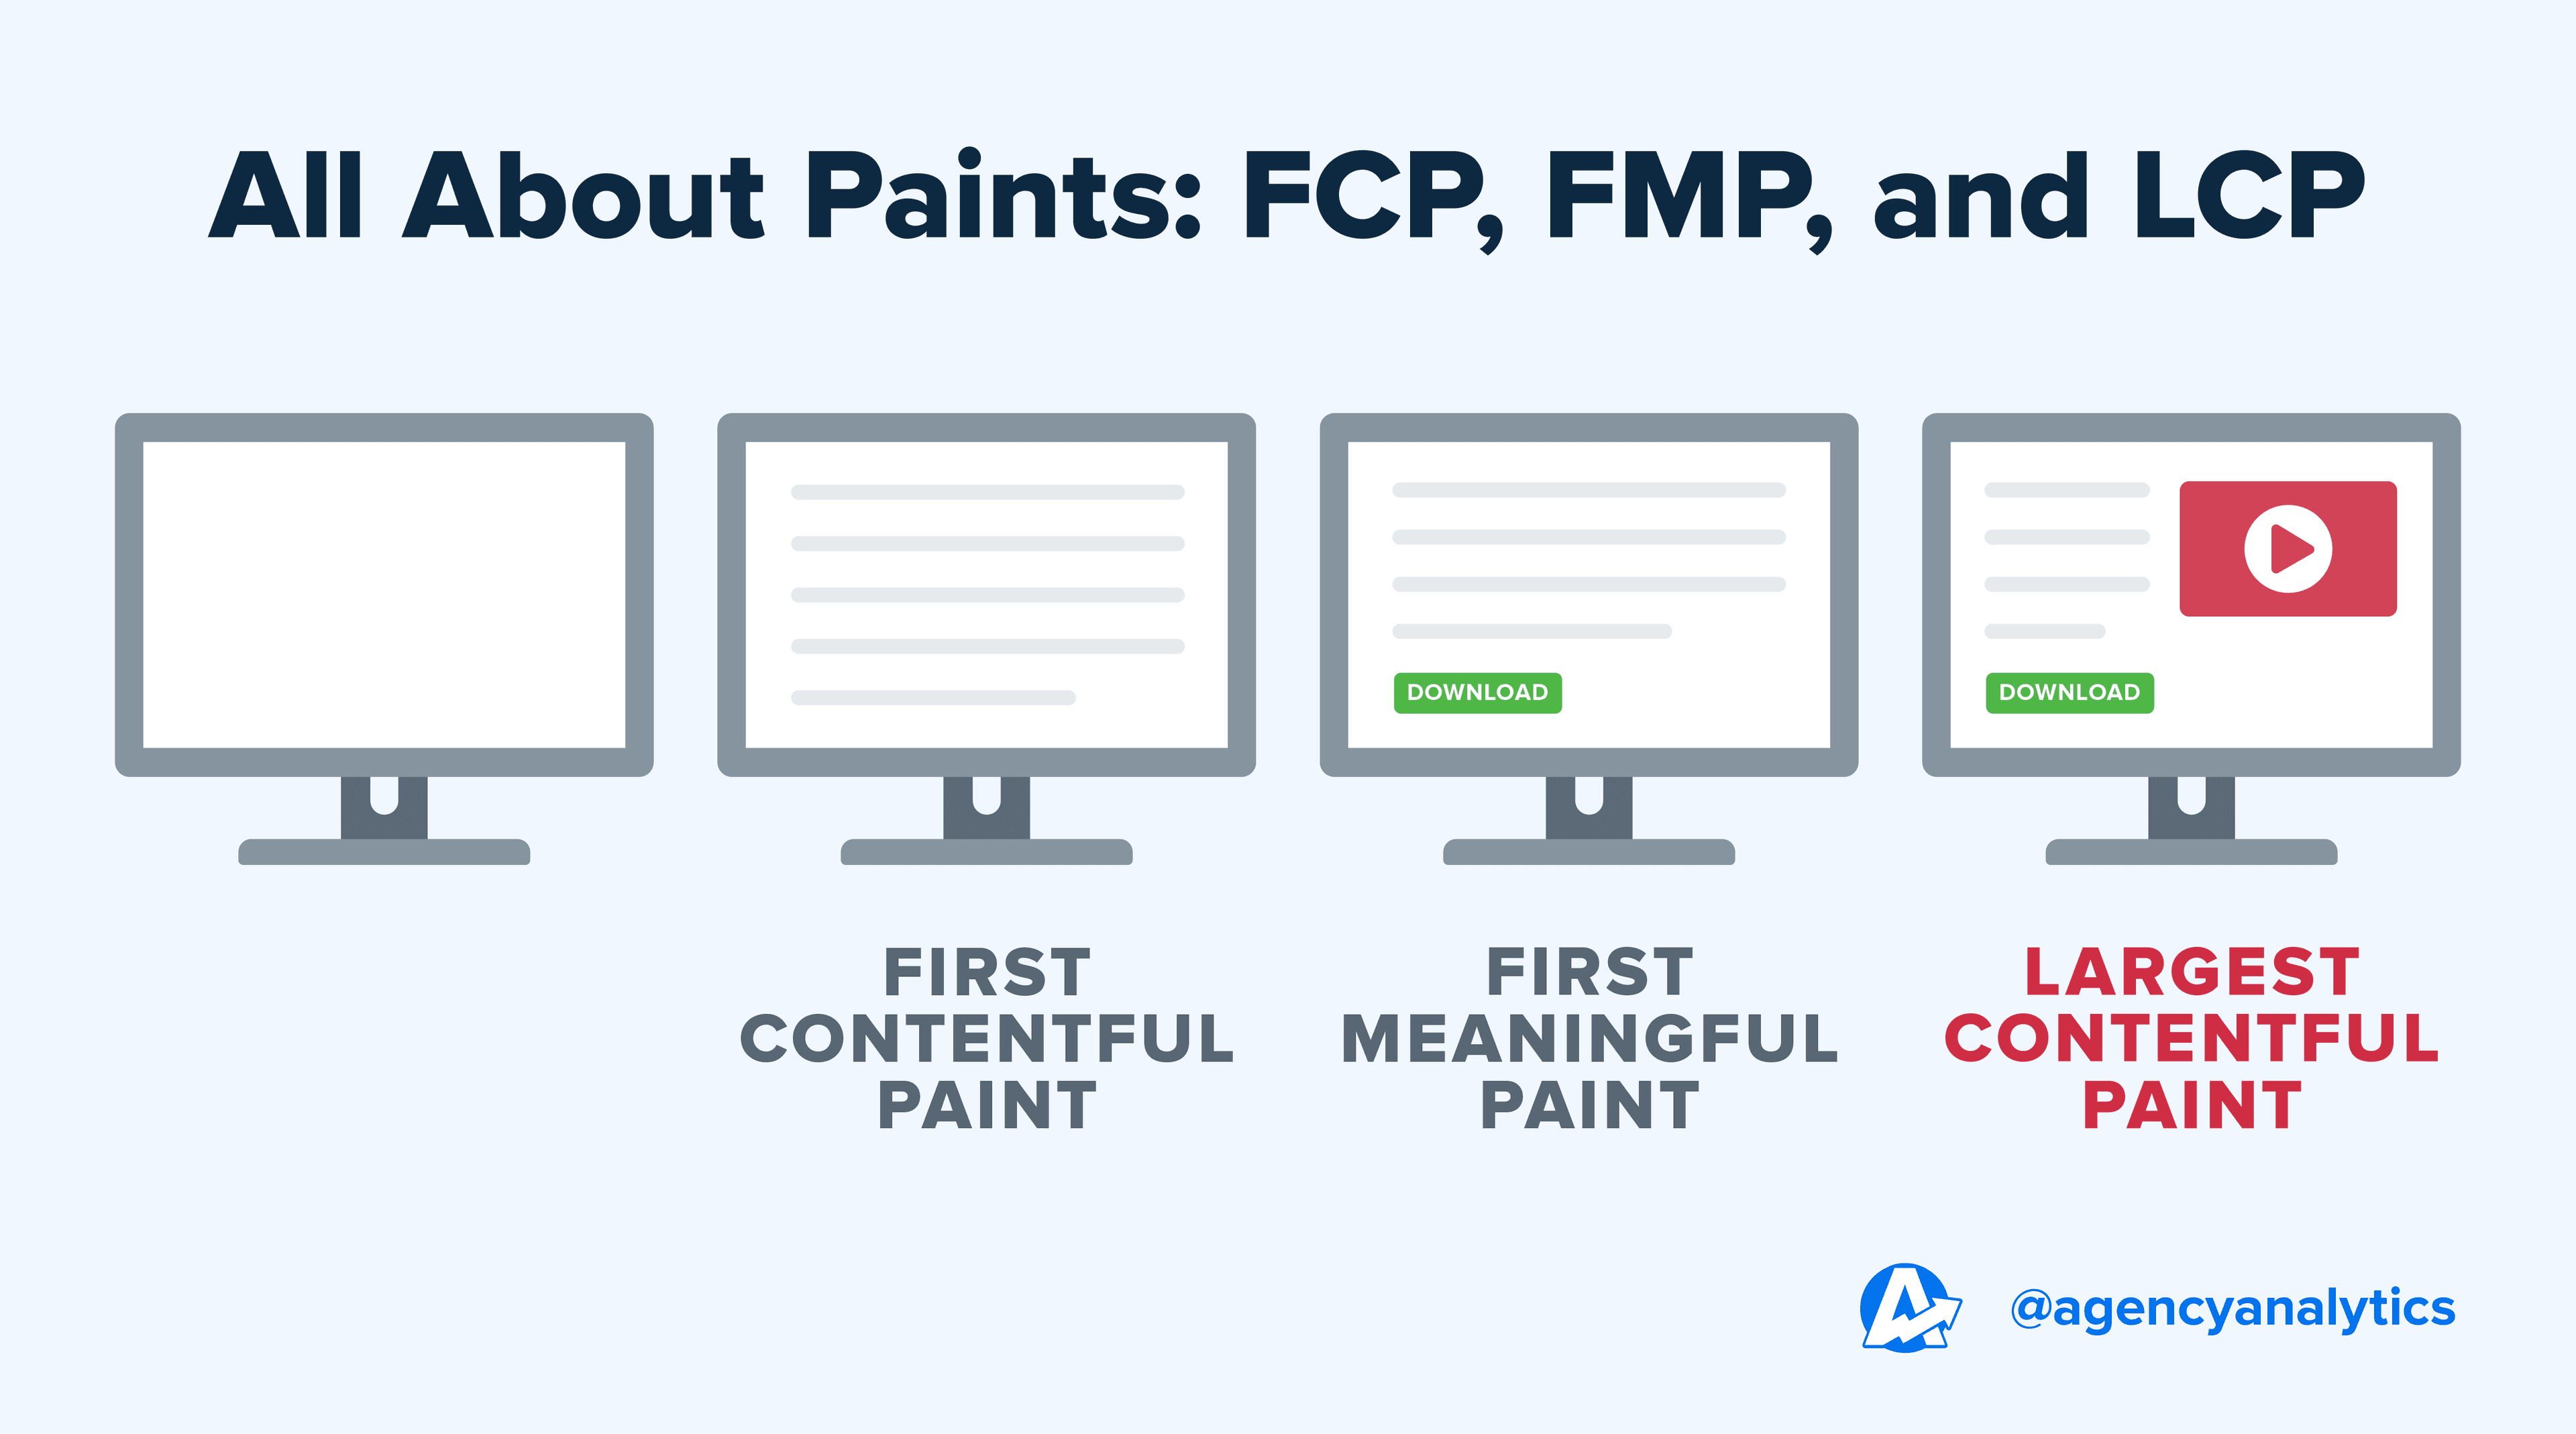
1. First Contentful Paint (FCP)
This performance metric often influences a user’s perception of overall page load time, which is why it’s important to optimize it.
Keep in mind that FCP should be 1.8 seconds or less for any client website.
2. First Meaningful Paint (FMP)
Sounds pretty similar to First Contentful Paint (FCP), right? There’s a key difference.
As the name suggests, FMP is how long it takes for the first meaningful content to display (i.e., whatever users actually want to view).
This value is often the same as First Contentful Paint (FCP) but varies based on your client’s website. For example, say a user has made it to your eCommerce client’s product page.
In this scenario, the product image and “Buy Now” button will hold more meaning than a non-responsive background image (more than likely, your client is probably more interested in prioritizing their conversion rate, too).
In this scenario, you’ll want the First Meaningful Paint to be that product image, description, and CTA button (typically the content that renders above the fold on a product page), which provides the most value to the user and increases the chances of conversion success. A good FMP score is between 0 - 2 seconds.
3. Largest Contentful Paint (LCP)
This perceived performance metric is the time it takes for the largest piece of content to load on your client’s website (e.g., a video embed, image slideshow, text body).
It’s worth noting that LCP falls under Google’s Core Web Vitals, which means it directly impacts a website’s performance on Google search results.
It makes sense when you think about it. LCP is useful for a website visitor to gauge how long they’ll have to wait to access your client’s full website (which often determines whether they’ll stay or not).
As a point of reference, an ideal LCP should be no more than 2.5 seconds. To recap, here's a neat visual.
4. Cumulative Layout Shift (CLS)
CLS is a measure of how much your client’s website layout shifts while loading. In essence, it’s an assessment of the overall visual stability of your client’s website.
Similar to Largest Contentful Paint, CLS also falls in the Google Core Web Vitals bucket.
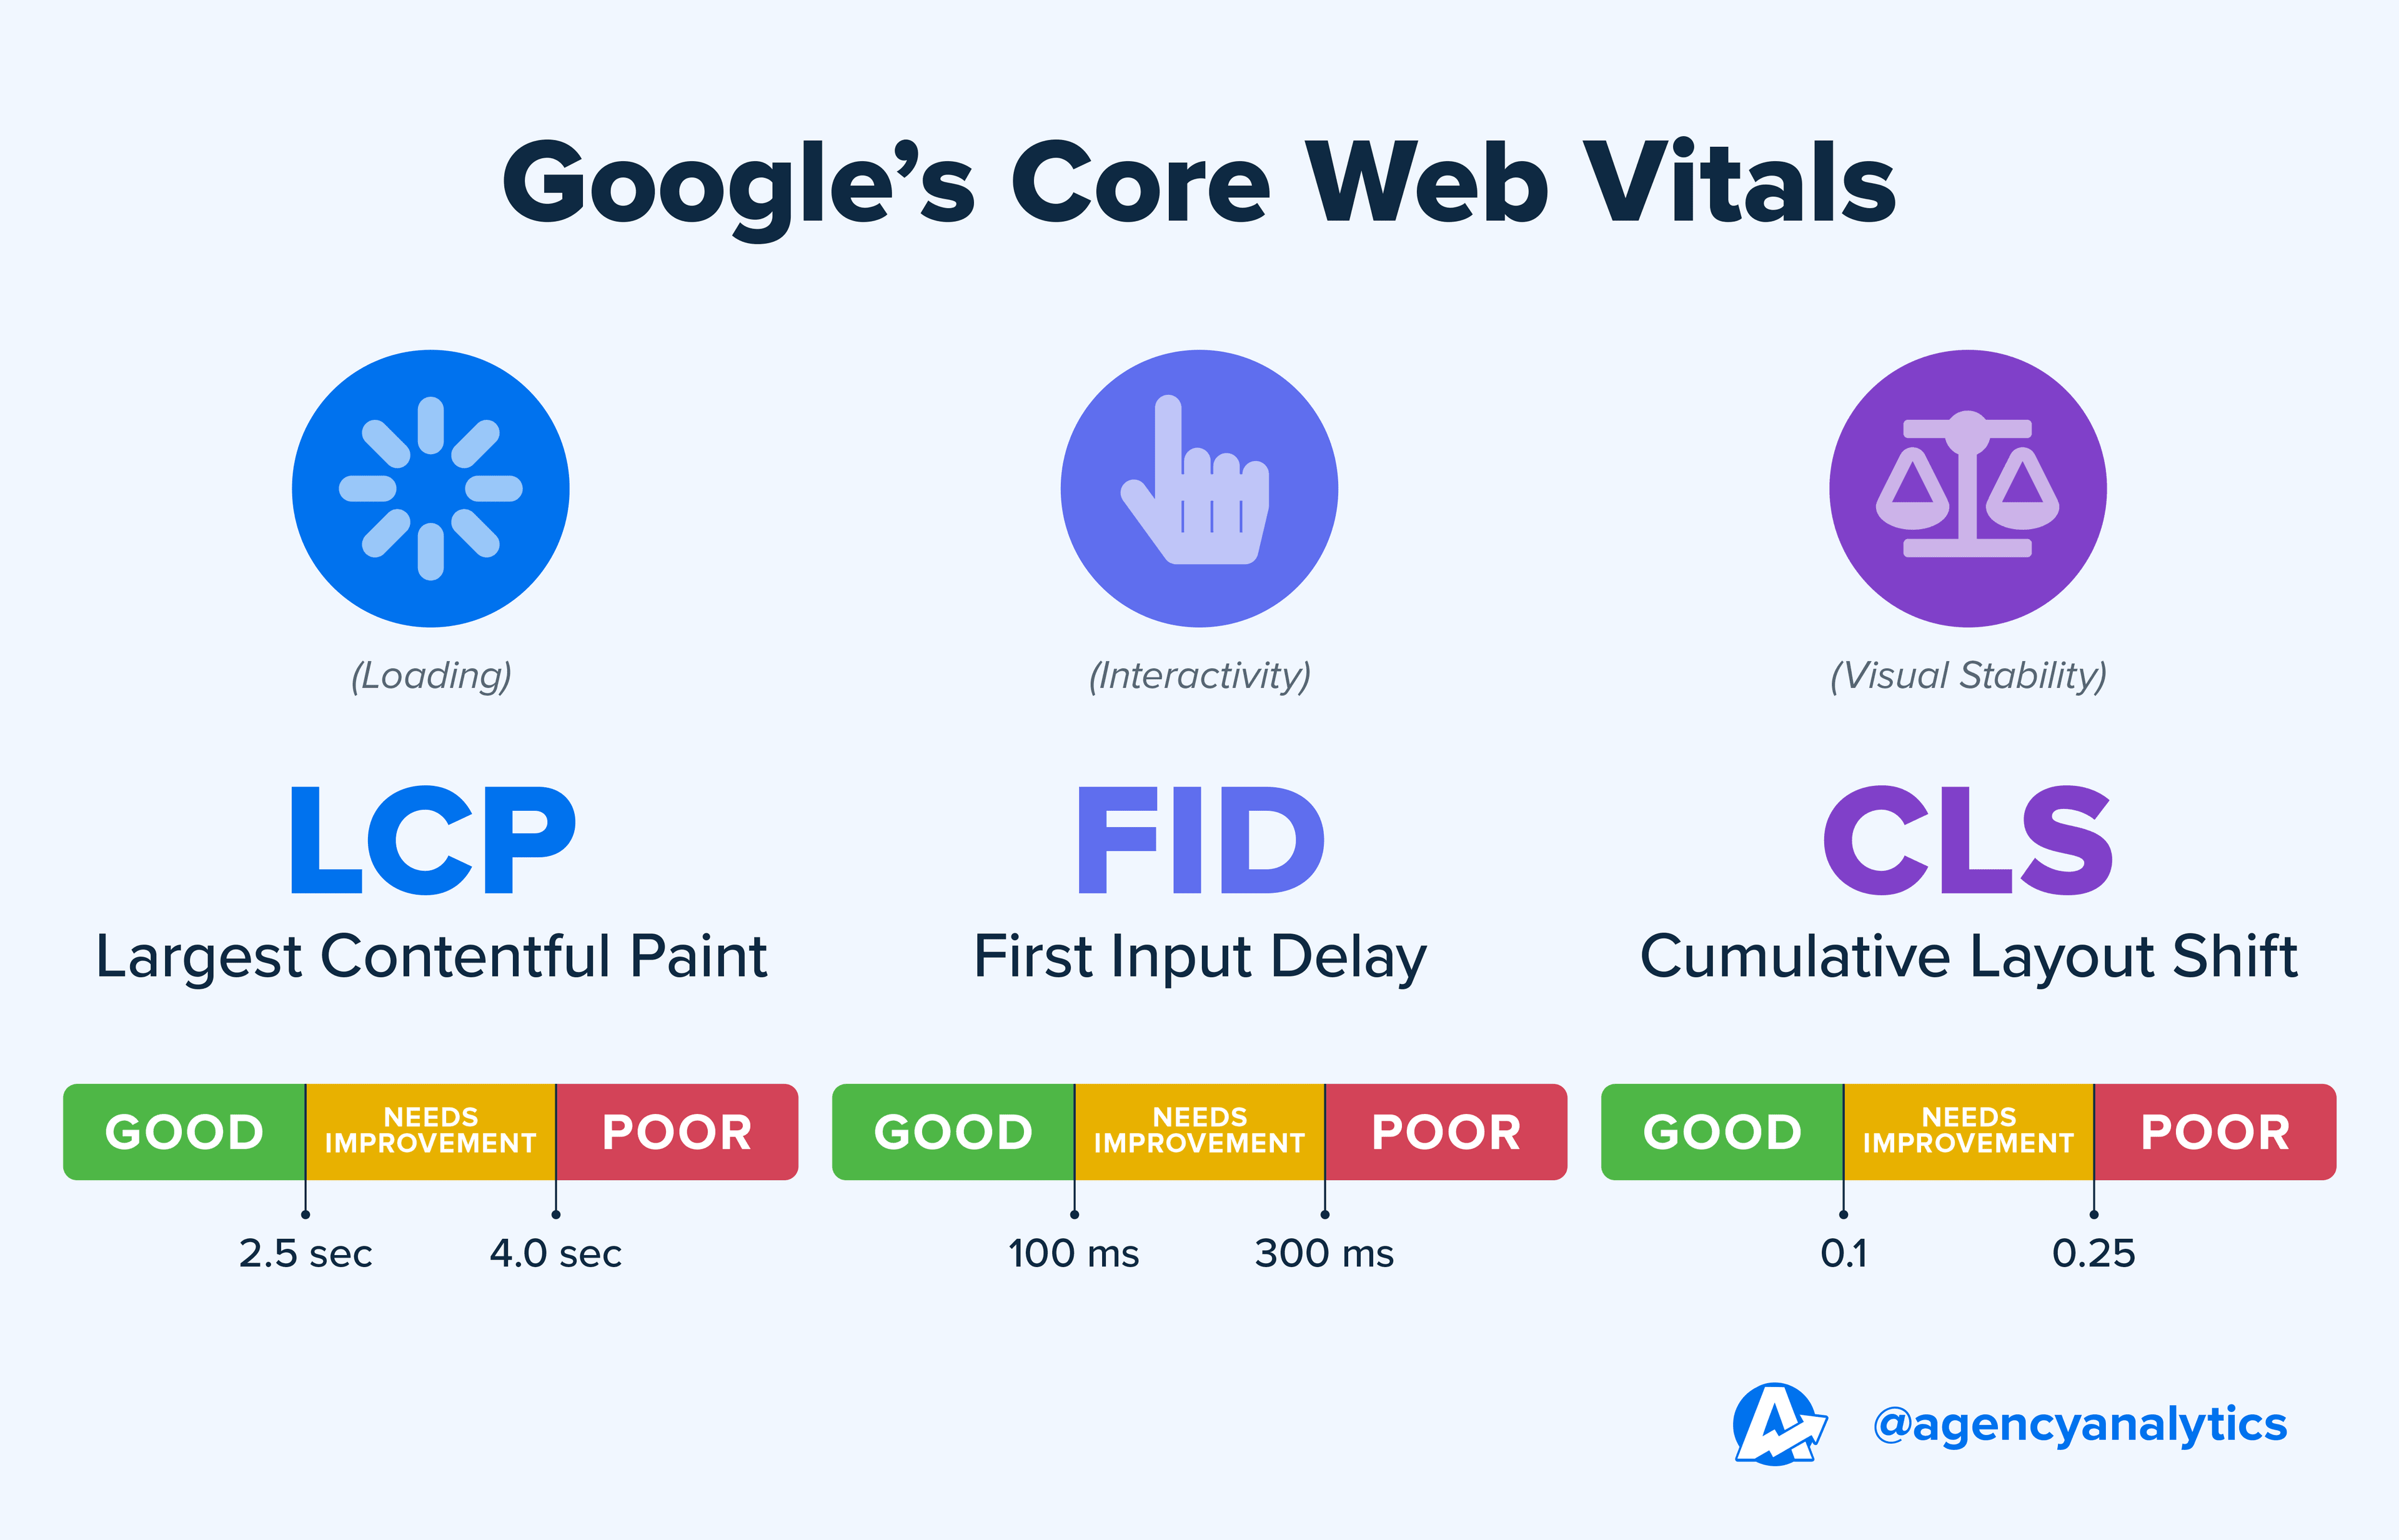
A website with a significant CLS score isn’t exactly user-centric–in fact, it may be visually confusing and a bit of an eyesore. As a benchmark, Google recommends a CLS score of no more than 0.1 for optimal user experience.
5. First Input Delay (FID)
Wrapping up Google’s Core Web Vitals is First Input Delay (FID). This metric tracks the time between a user’s interaction with your client’s website (e.g., clicking on external links) and the browser responding to their action.
An ideal FID is no more than 100ms since you don’t want users initiating action and stalling for a significant time period.
As a quick recap of Google’s Core Web Vital benchmarks, here’s a summarized visual below.
6. Max First Potential Delay (Max FID)
As the term suggests, this metric refers to the highest possible FID (i.e., the predicted maximum delay between a user’s first input and the browser’s execution of that request).
According to the data above, a high Max FID (>300 milliseconds) indicates that users may find your client’s website unresponsive or slow. That means it’s definitely an area to improve if it shows up.
7. Page Load Time
This metric measures how long it takes for your client's website to fully render on a user's screen after their initial click.
A web page with a fast page load time may lead to decreased bounce rates, improved search rankings, and more interest from users.
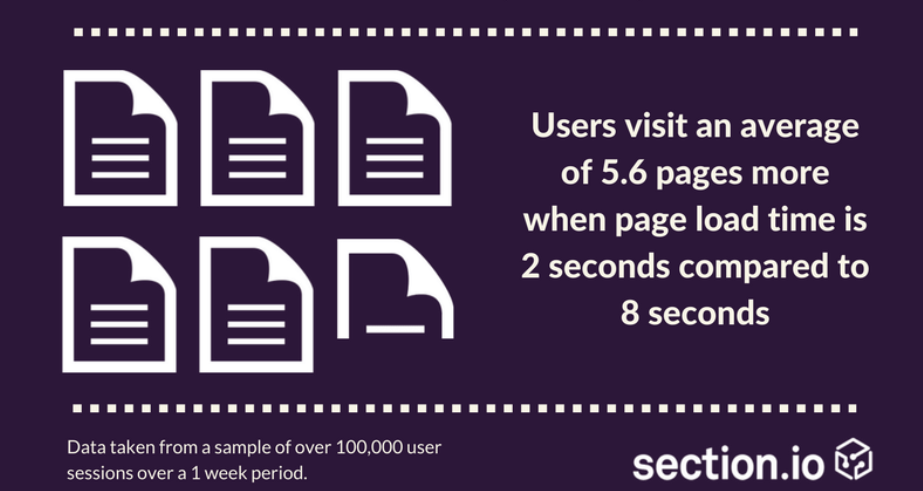
In fact, a recent study found that users visit approximately 5.6 pages more with just a marginal improvement in page loading time. Plus, an enhanced user experience may lead to a longer average session duration and increased engagement.
8. Time to First Byte (TTFB)
Time to First Byte is the duration it takes for a user's browser to obtain a data byte from a web server following a user’s initial click.
Much like page loading time, avoid a notably slow time to first byte that leaves users waiting excessively for their requests to be processed.
As a benchmark, aim for a time to first byte of no more than 600 milliseconds.
9. Speed Index
Speed Index is the rate at which a webpage loads progressively over time. In contrast to FCP, this metric considers the entire page loading process rather than solely focusing on one part.
A fast website speed index is generally between 0 to 3.4 seconds.
10. Time to Interactive (TTI)
TTI is the time it takes for your client’s website to become responsive to user interactions (e.g., getting a successful response after clicking a ‘Download’ button).
Interactivity is a no-brainer when it comes to the user experience. After all, you don’t want users to stumble across an interesting blog post or try to fulfill a conversion action only to realize they’re stuck in cyberspace.
As a rule of thumb, site owners should have TTI scores between 0 - 3.8 seconds.
11. First CPU Idle
First CPU Idle measures when website loading is idle enough that it becomes responsive to user input.
In other words, it means that the user’s CPU is no longer being used to perform resource-heavy tasks (such as processing third-party scripts).
A lower First Idle CPU score (around 0 - 4.7 seconds) means your client’s website is highly responsive and readily available for user interaction.
12. Total Page Size
This important metric measures the consolidated download size of any of your client’s web pages when downloaded in a user’s browser. This factors in items like images, script, and fonts.
Ideally, you’ll want your client’s website to have a total page size of 100KB or less, but this ideal is not always possible–especially for niche content or eCommerce where images are needed to engage the visitor.
In these cases, it’s not unusual to see pages that range from 200KB to 400KB. The important thing is to strike a balance between minimizing page size and maximizing user engagement. After all, you don’t want an unreasonable page size to result in a slow site speed or compromised conversion rate.
13. Number of HTTP Requests
When a user clicks on your client’s website, their browser will send out individual HTTP requests to the server.
These requests are directly tied to the loading of key website elements such as images, fonts, and HTML files (to name a few).
More requests may mean a higher page load time and a reduced user experience.
While the average number of HTTP requests is around 70, fewer requests mean enhanced website performance. Because of this, it’s best to have a minimal number of requests where possible.
7 Supplementary Engagement and Behavior Insights to Track
Designing a website with optimal loading times won’t mean much if there isn’t a deeper understanding of what type of content resonates.
Think about it–you can have amazing website performance metrics, but it won’t mean much if website visitors don’t even engage with your client’s content or perform conversion actions. Therefore, your agency must go a step further and present the entire picture to clients.
The only way to assess how what you are saying is perceived is by studying the reactions. Online, clicks, shares, and/or replies are the "facial expressions" and "words" that a person shares back that can tell you how well your conversation is going.
Seth Giammanco, Principal, Strategy and Technology at Minds On Design Lab
That’s where user behavior and engagement metrics come in. By considering all the elements in conjunction, you’ll be in a better position to increase the time users spend on your clients’ websites and invest in the most promising traffic sources.
It’s worth noting that any dips in these metrics may indicate an SEO-related issue (e.g., creating content that isn’t relevant to your client’s target audience).
Alternately, it may mean site performance optimization is needed, such as reducing page loading time or having a faster First Contentful Paint.
Metric | Description |
|---|---|
The percentage of users that land on your client’s website and exit after viewing one page | |
The average time users spend on your client’s website. In other words, they were actively engaged (e.g., scrolling, clicking links), or the website ran in the foreground | |
How many pages a user typically views during a single visit to your client’s website. This important metric helps to understand overall interest and whether content is engaging | |
A measure of the distance a user scrolls down on any one of your clients’ pages. This helps to assess content effectiveness and whether there are opportunities for more CTAs | |
The rate at which users carry out a specific, desired website action (e.g., clicking on a button, completing an online transaction) | |
The last page a user visits before leaving your client’s website. An exit page with a high bounce rate in GA-4 may indicate that content optimization is needed (e.g., adding more headings) |
How To Measure Website Performance Metrics With Tools
It’s nearly impossible to accurately track a website’s performance without some form of automation. Rummaging through too many page load testing tools just to understand what’s happening is time-consuming and anxiety-inducing.
Luckily, a client reporting tool like AgencyAnalytics consolidates all that valuable data for you.
The way metrics are laid out and displayed on AgencyAnalytics is much easier for the client to digest, as opposed to viewing them directly on an intricate platform like Google Analytics. It gets the point across without forcing the client to get too into the weeds.
Jessica Weiss, Director of Marketing & Strategic Partnerships at One Firefly
Here are three top dashboards that automate data retrieval and give you a better understanding of website performance.
1. Google Lighthouse
This handy tool helps you to assess website performance, gauge user experience, and identify any potential issues.
Use an automated Google Lighthouse dashboard to:
Run a comprehensive audit and website speed test at regular intervals with an SEO audit tool
Track page loading metrics (like the ones we’ve outlined)
Measure website accessibility to ensure your clients follow best practices
Identify performance bottlenecks listed by priority level and actionable feedback on how to improve them
Get an overall website performance score to understand the big picture
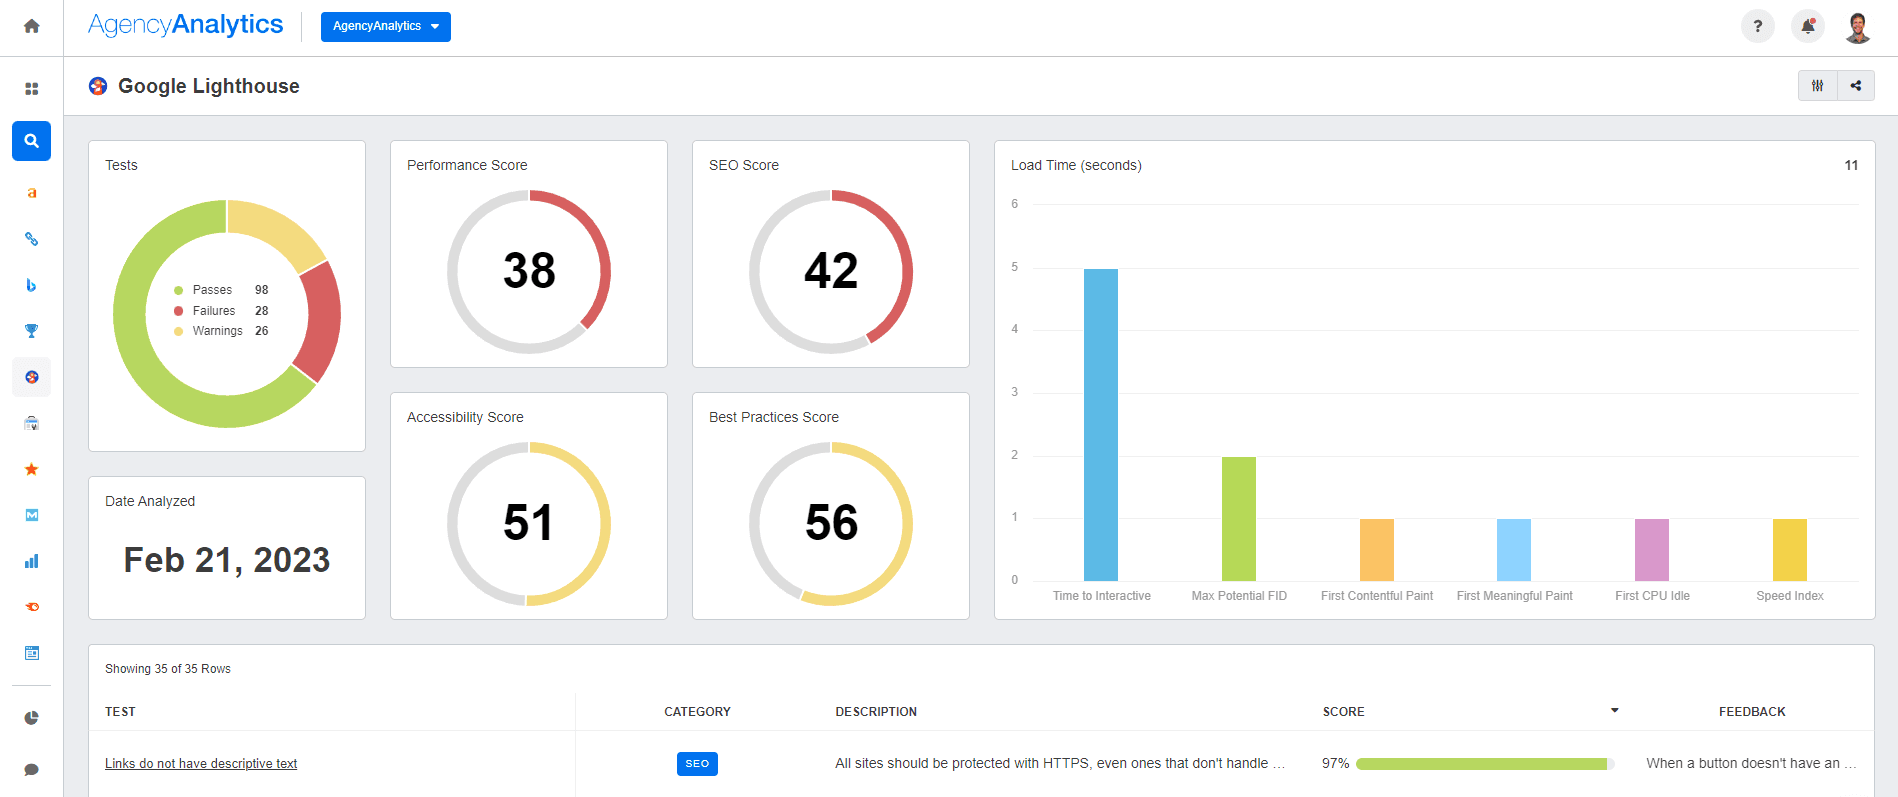
Access real-time web page performance insights at the click of a button. Use a pre-built Google Lighthouse dashboard–try it on AgencyAnalytics, free for 14 days.
2. Google Search Console
Google Search Console provides insights that help you to optimize content for search engines.
In addition to website performance, a Google Search Console dashboard is useful to track:
Your client’s top pages (this will help you to decide which ones to optimize first)
Any sitemap issues that could affect search crawlability
Other related insights like top devices used, keyword rankings, and geographic data
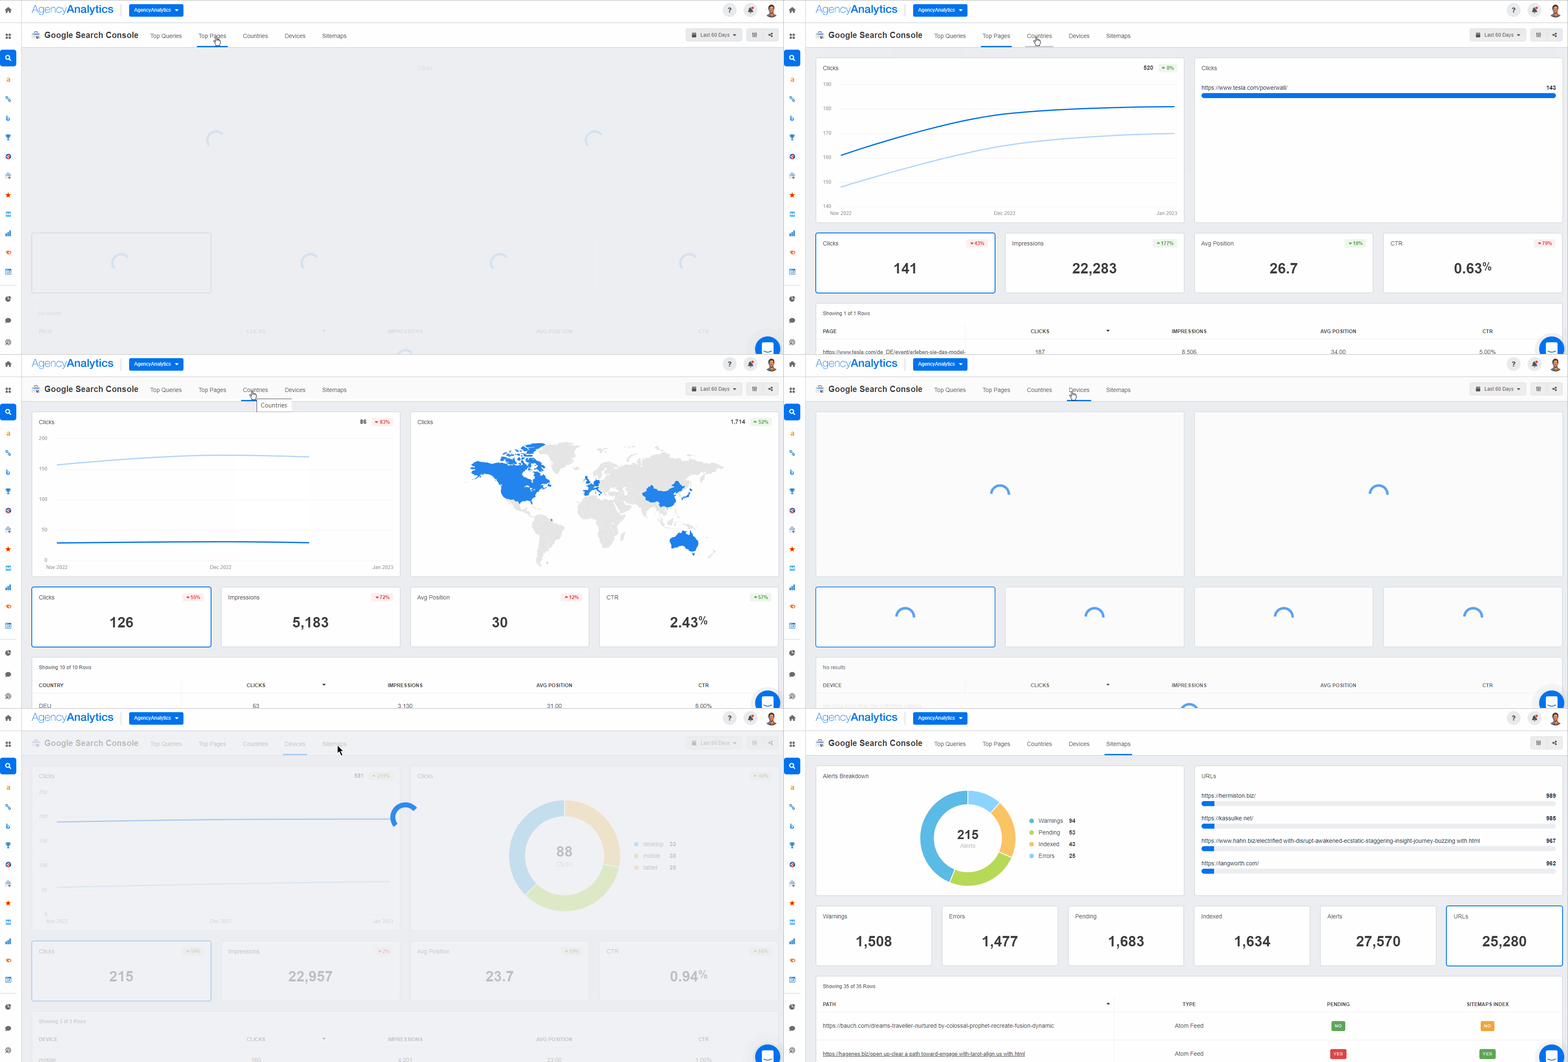
Monitor your clients’ SEO performance and optimize their website for increased searchability. Consolidate Google Search Console data in a visual format–it’s free for 14 days on AgencyAnalytics.
3. Google Analytics 4
This list wouldn’t be complete without a mention of Google Analytics.
While this platform doesn’t directly assess performance insights like page load times, a comprehensive GA4 dashboard showcasing top GA4 metrics gives a more granular view of:
User engagement rates
Any notable changes to overall bounce rate and conversion rates
Total number of user sessions and average session duration
Best performing website traffic sources (e.g., direct website traffic or a referral traffic source)
Top landing pages
Audience-related analytics (such as new and returning users)
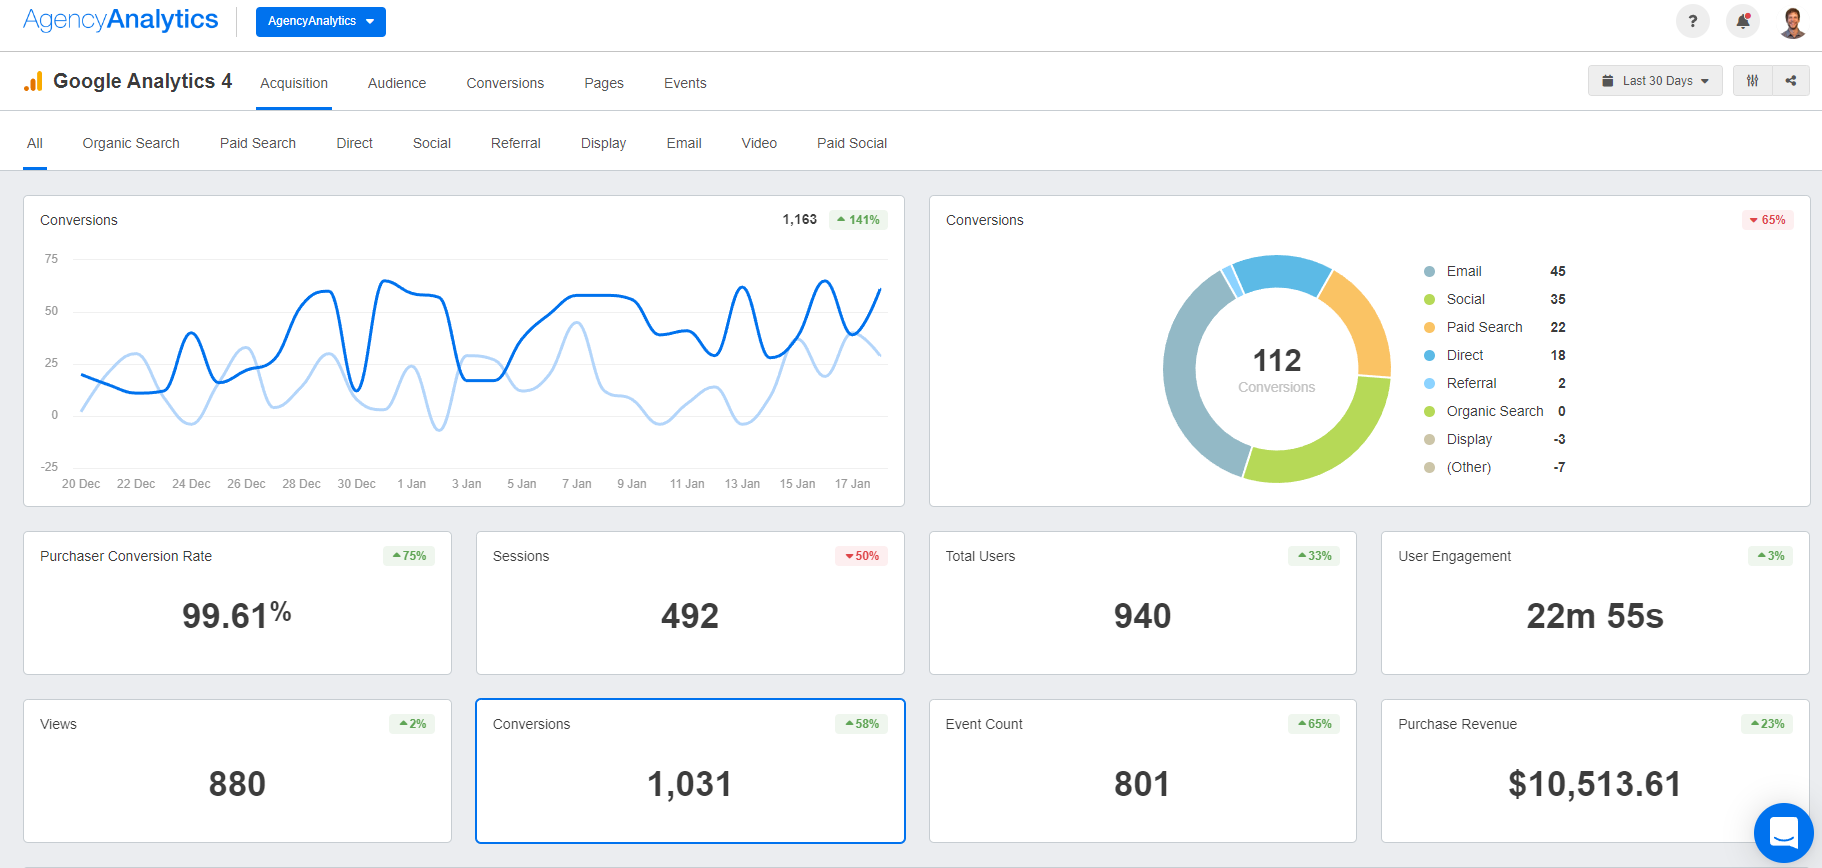
Track metrics like bounce rate, average session duration and exit pages alongside web page performance insights–create a custom dashboard on AgencyAnalytics, free for 14 days.
4. GTmetrix
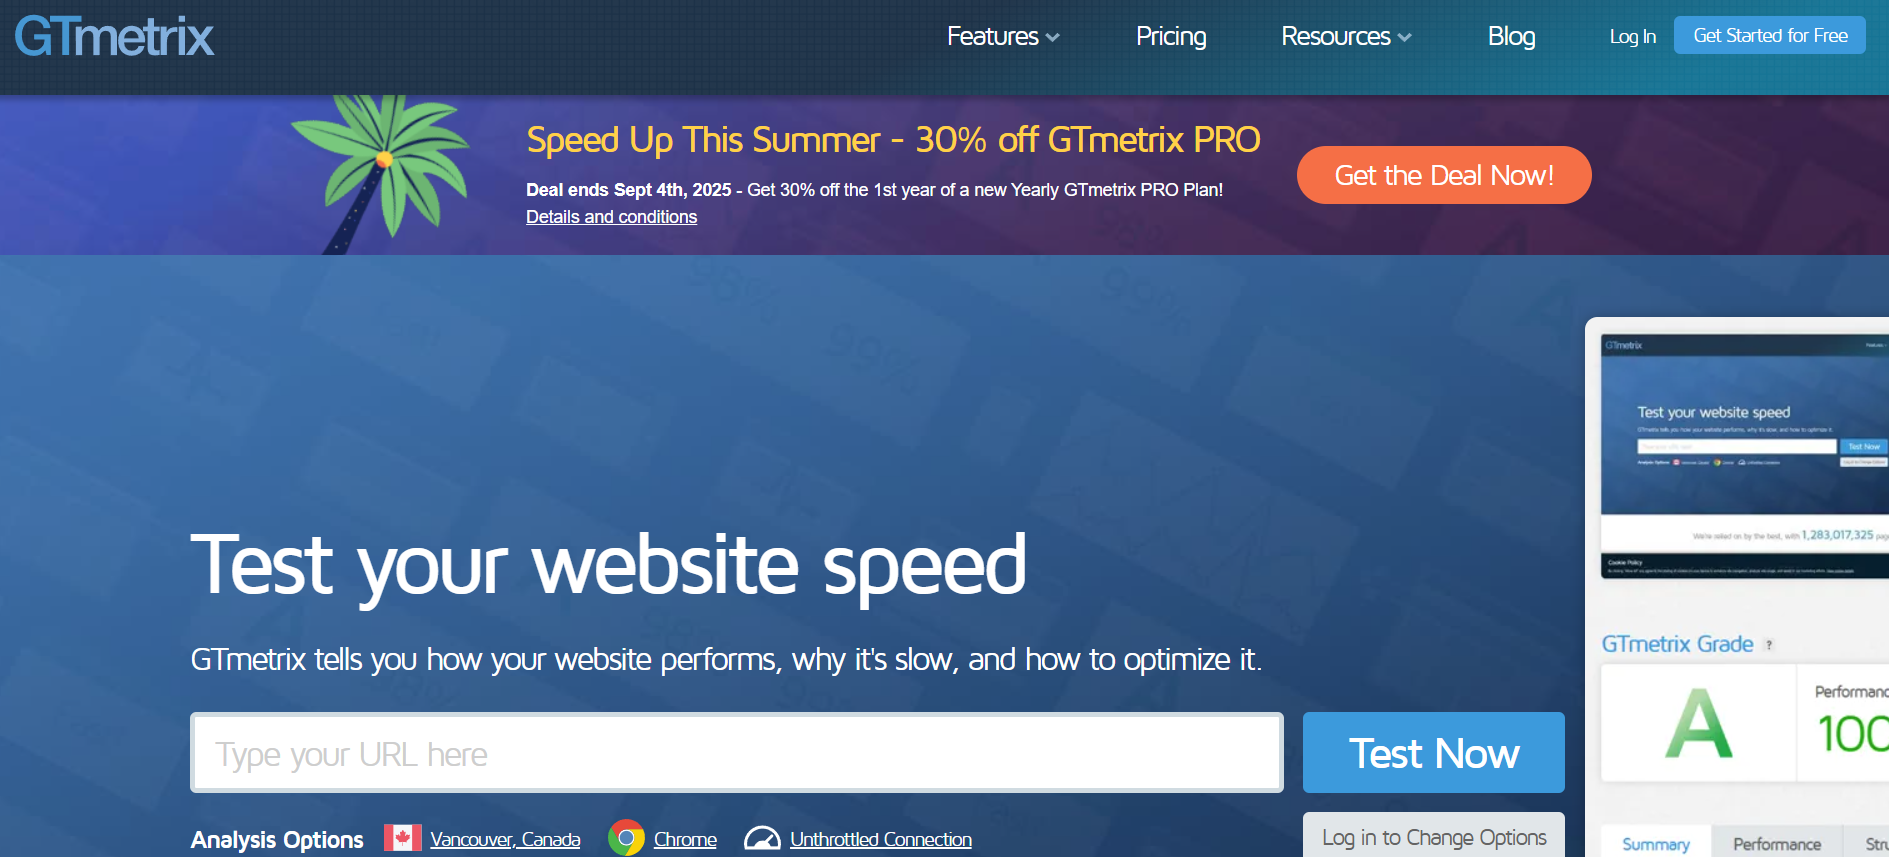
GTmetrix is a popular website audit tool that’s used to evaluate site speed, identify performance issues, and track historical changes.
In addition to page speed, this platform also lets you test web page performance by geographic region (including the US, Canada, and Australia), which is helpful if you’ve got clients with websites in multiple locations.
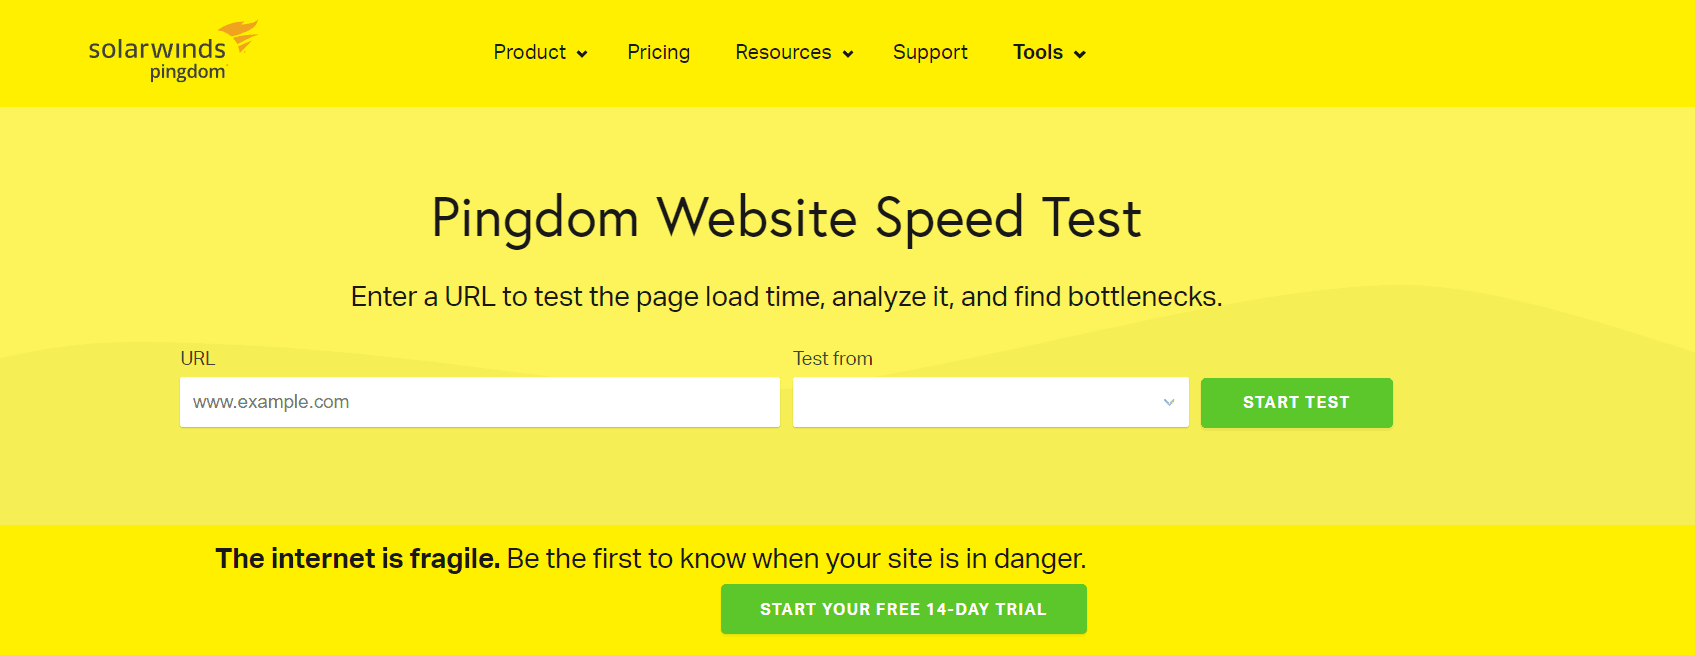
5. Solarwinds Pingdom Speed Test
Similarly, Solarwinds Pingdom Speed Test is another platform that delivers page speed insights across different regions (including the US, UK, and Japan).
There’s also a transaction monitoring feature that identifies workflow issues that could affect the overall website conversion rate.
Implementing Website Performance Metrics in Client Dashboards
Wondering how to get started with monitoring website performance metrics? It’s easy-peasy with a platform like AgencyAnalytics.
All you have to do is:
1. Integrate Your Data Sources
Head to your AgencyAnalytics account and click on “Integrations” on the right-hand menu.
Pick your desired integration, grant any requested permissions, and sync it to your AgencyAnalytics account.

2. Choose a Pre-Built Dashboard or Build Your Own
After successfully integrating your platforms, it’s time to automate those insights into a dashboard.
You’ve got a few options, such as:
Choosing a platform-specific dashboard (like the ones we’ve mentioned)
Picking a more general dashboard (e.g., a digital marketing dashboard) and customizing it to include website performance metrics
Building a dashboard from scratch and tailoring it to your client’s unique needs (e.g., adding custom metrics, adjusting widget sizes)
Replicating an existing dashboard (or even just a specific section)
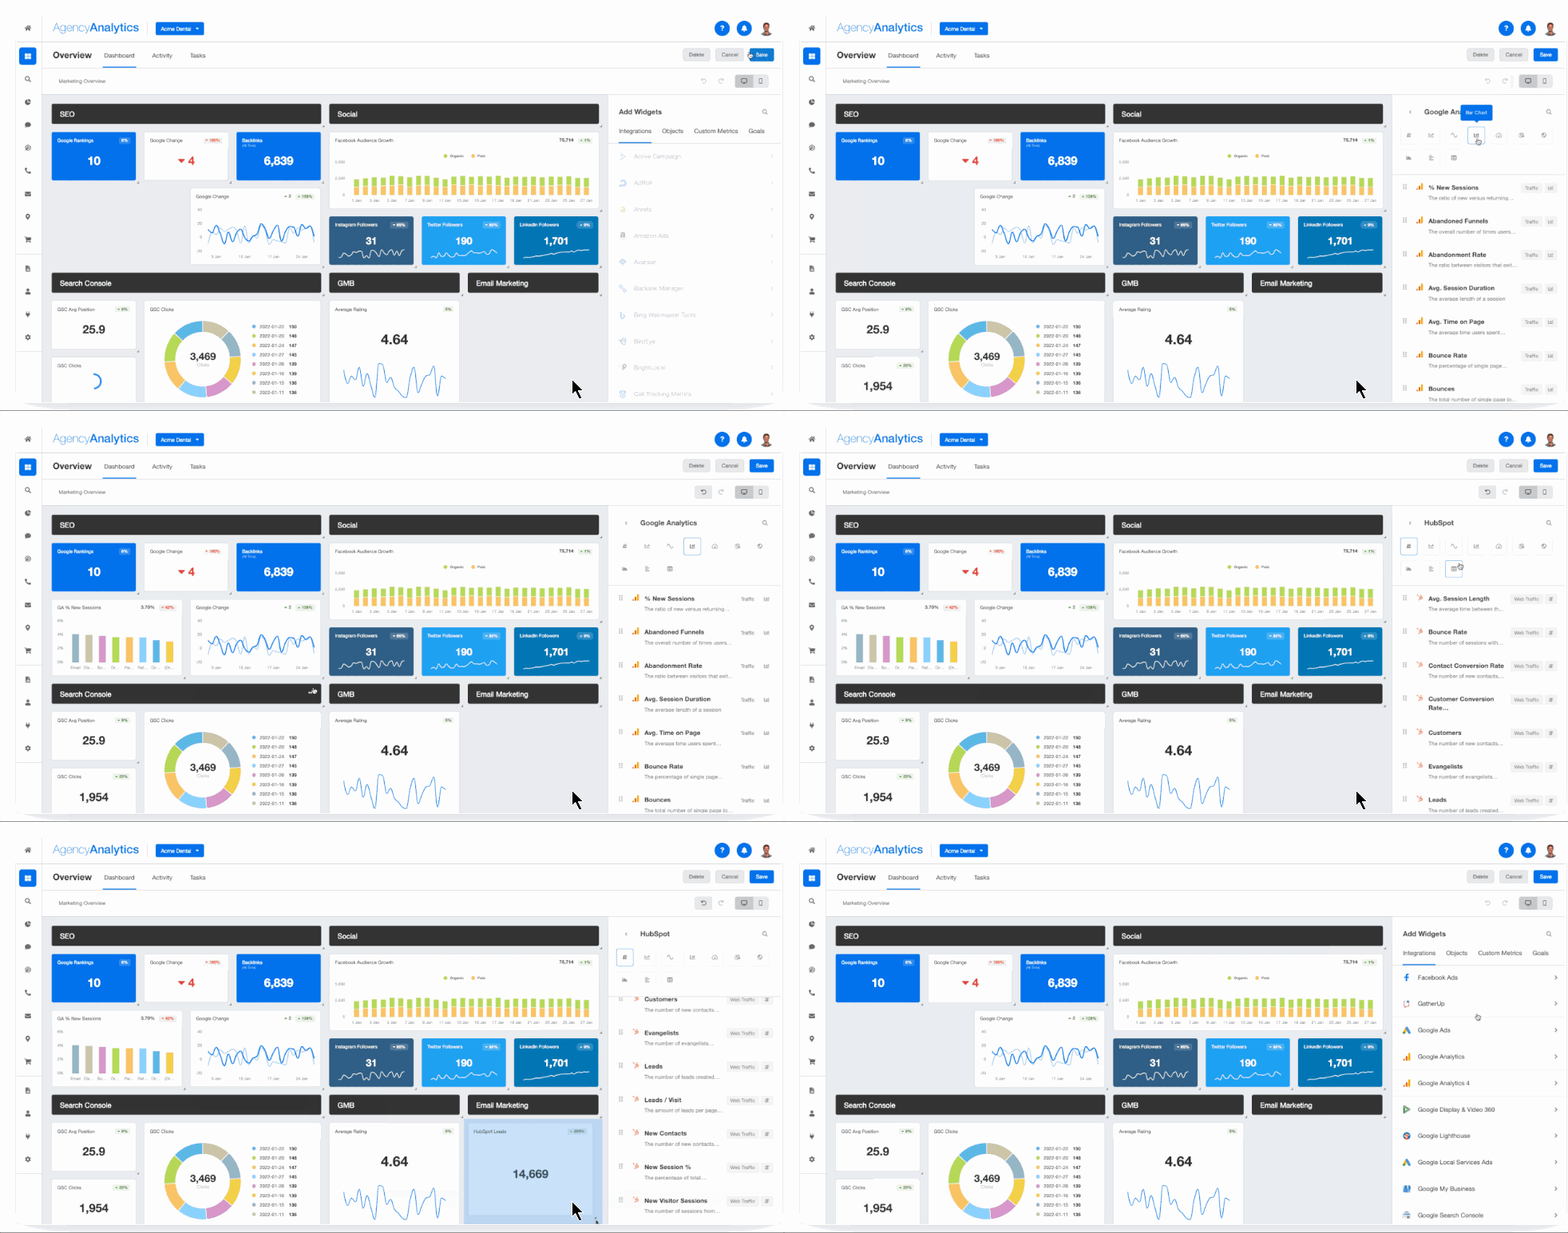
Add social media widgets and search engine optimization insights alongside your clients' web performance metrics. Create your own custom dashboard on AgencyAnalytics, free for 14 days.
3. Consider Granting Client Login Access
To keep data transparency on the table, create login profiles for your clients.
That way, they’ll have 24/7 access to their website performance metrics, which also reduces follow-up times.
If you’re concerned about sharing too much information, create custom user permissions to decide exactly what’s shared.
By providing us with access to real-time data and analytics, AgencyAnalytics helps us make informed, data-driven decisions about our clients' marketing campaigns, website performance, and other key metrics. This allows us to optimize our strategies and tactics more effectively, leading to better results for our clients and agency.
Daniel Dye, President of Native Rank, Inc.
Use Website Performance Metrics To Assess the Big Picture
As we’ve outlined, monitoring website performance metrics identifies issues that prevent internet users from accessing what they need. After all, no one likes slow load times or any other significant delays.
Factoring engagement insights will also help you to address website-related issues (like a high bounce rate on landing pages or even marginal conversion rates). Knowledge is power, and doing your due diligence will steer your clients to success.
That said, consolidating all these metrics manually is time-consuming and headache-inducing. Instead of toggling between platforms, use AgencyAnalytics to automate data retrieval and filter those important metrics into intuitive, visual dashboards.
The response from our clients has been overwhelmingly positive, as they appreciate the convenience of having their Google Search Console, rankings, and Google Analytics data consolidated in one user-friendly interface. This eliminates the hassle of logging into multiple platforms and navigating through complex interfaces.
Alexa Rees, SEO Manager at seoplus+
Say bye-bye to clunky, manually-intensive reports and hello to automated dashboards. Invest in the client reporting tool trusted by over 7,000 agencies and counting–try AgencyAnalytics today, it’s free for 14 days.

Written by
Faryal Khan is a multidisciplinary creative with 10+ years of experience in marketing and communications. Drawing on her background in statistics and psychology, she fuses storytelling with data to craft narratives that both inform and inspire.
Read more posts by Faryal KhanSee how 7,000+ marketing agencies help clients win
Free 14-day trial. No credit card required.


