Cumulative Layout Shift (CLS)
User Experience Monitoring
Identify and fix issues that disrupt the webpage's layout to ensure a smoother browsing experience.
SEO Optimization
A lower CLS score leads to better search engine rankings and an overall better SEO score.
Troubleshooting Strategy
Identifies pages with high CLS for targeted improvements, pinpointing elements causing layout shifts.
A/B Testing Analysis
Use A/B testing to determine which webpage layout offers the most stable user experience.
Why Cumulative Layout Shift Is Important
Cumulative Layout Shift aims to provide a seamless and user-friendly web experience. CLS measures the visual stability of a webpage, specifically tracking the unexpected layout shifts during loading.
Search engines like Google consider CLS as a ranking factor part of their Core Web Vitals. Websites with low CLS scores tend to rank higher, attracting more organic traffic and potential customers. So, a favorable CLS score ensures users have a smooth website journey, ultimately contributing to higher Engagement and longer Page Sessions.
Stop Wasting Time on Reports. Get Marketing Insights Faster & Drive Results.
How Cumulative Layout Shift Relates to Other KPIs
A high CLS often leads to increased Bounce Rates and reduced Average Session Duration. That’s because users tend to leave websites with a disjointed browsing experience. This correlation highlights the need for a stable and smooth user interface to retain visitor attention.
Additionally, CLS has a significant influence on Conversion Rates. Websites with low CLS scores typically see higher Conversion Rates, as a stable layout encourages visitors to complete actions (e.g., making an online purchase).
Search engines also favor websites with low CLS, which may improve search rankings. This interplay underscores CLS's importance in a comprehensive marketing strategy since it affects the user experience and other outcomes.
Key Elements Impacting Cumulative Layout Shift Score
To address Cumulative Layout Shift, start by understanding the causes of unexpected layout shifts during page load. These layout shifts often disrupt the user experience and negatively impact the CLS score.
A lack of image dimensions and aspect ratios often leads to unexpected layout shifts. When these dimensions and ratios aren’t defined, the browser can’t allocate the correct space until the media loads. Another contributing factor is the use of web fonts that cause the flash of unstyled text (FOUT) or invisible text (FOIT).
A delay in web font loading leads to layout shifts, so consider using a faster-loading fallback font that closely matches the chosen font. Dynamically injected content (like ads or responsive images) may also lead to an unexpected layout shift.

A website is often the first point of contact between a business and its potential customers, which is why we prioritize good design and user experience. Our web design services are tailored to meet each client’s unique needs, ensuring that their website not only looks great but also functions optimally and engages visitors.
How To Calculate Cumulative Layout Shift (CLS)
To calculate Cumulative Layout Shift, track all the times parts of a webpage move unexpectedly while someone is using it. Each movement gets a score based on how much of the screen they affect and how far they move. The total CLS is the sum of these scores, showing how stable or unstable the webpage is as it's being used.
CLS is usually calculated through specialized tools like Google Lighthouse and Google PageSpeed Insights, considering these two key elements:.
Impact Fraction: Measures the area of the viewport that's affected by the shift.
Distance Fraction: Measures the distance each unstable element has moved relative to the viewport.
The Cumulative Layout Shift is the sum of all individual layout shift scores that occur during the entire lifespan of the page. However, it's important to note that layout shifts that occur in response to user interactions (like clicking a button that dynamically loads content) are not included, as these are considered expected shifts.
Cumulative Layout Shift Formula Example
What Is a Good Cumulative Layout Shift?
A good average CLS is generally considered to be 0.1 or below. This low score indicates a stable, user-friendly website where content remains largely static as the page loads, minimizing disruptions in the browsing experience.
Achieving such a score usually involves meticulous design and development practices. These include specifying image sizes and avoiding content that shifts existing elements. A CLS score in this range positively influences SEO rankings and results in a professional-looking website.
What Is a Bad Cumulative Layout Shift?
A bad average CLS score is typically above 0.25 and signals significant webpage instability. Such shifts can be caused by unoptimized image loading, ads that suddenly expand, or any content that displaces existing elements.
These abrupt changes lead to a poor user experience and lower search rankings. Websites with consistently high CLS scores should identify underlying issues, focus on optimizing content stability, and provide a better overall user experience.
How To Set Cumulative Layout Shift Benchmarks and Goals
Creating benchmarks and goals for CLS involves a structured approach. First, conduct an initial website assessment using tools like Google Lighthouse.
Set a realistic benchmark for expected layout shift based on industry standards (e.g., a CLS score below 0.1). Then, identify the specific elements causing layout shifts, such as images without dimensions or dynamically injected content. Establish clear goals to reduce these shifts, like optimizing image sizes, preloading key assets, or implementing more stable loading sequences.
Regularly monitor the CLS score and adjust strategies as needed. Collaborate with web developers to implement changes and improve performance.
Why Cumulative Layout Shift Matter to Clients
For clients, Cumulative Layout Shift is a reflection of user experience and brand perception. A low number of unexpected layout shifts means a stable, user-friendly website, crucial for maintaining customer trust and satisfaction.
Clients should view CLS as a key indicator of their website's quality and effectiveness in delivering a positive user experience. It's not only about keeping the content visually stable. It’s also about providing a seamless and enjoyable website interaction, which leads to a more favorable brand perception.

Why Cumulative Layout Shift Matters to Agencies
For agencies, CLS demonstrates technical proficiency and strategic insight. A focus on minimizing unexpected layout shifts showcases an agency's commitment to crafting high-quality digital experiences.
Agencies use CLS as a benchmark to optimize website performance, which is integral for client satisfaction and retention. Prioritizing CLS means an enhanced user experience and a strengthened portfolio with high-performing, stable websites. Therefore, this metric demonstrates an agency’s capability to deliver technically sound websites.

Fixing Common CLS Problems
To fix Cumulative Layout Shift, reserve space on web pages to support dynamic ad sizes or load it in a way that doesn’t disrupt existing content. When there’s user input on a web page (e.g., filling out a form), improper planning can lead to unexpected layout shifts. Properly managing JavaScript and CSS animations is crucial for maintaining a stable page load experience.
Use tools to regularly monitor layout shifts (along with other Core Web Vitals) to optimize the user experience and address any issues.

Save Time and Money by Automating Your Client Reporting
Best Practices When Analyzing and Reporting on Cumulative Layout Shift
Understanding the nuances of CLS enables targeted optimizations that significantly impact campaign effectiveness and ROI. Here are six actionable tips to enhance CLS reporting.
Highlight Baseline Scores
Present the initial measure of unexpected layout shifts as a baseline. This sets a clear benchmark for measuring improvements.
Show Improvement Over Time
Include a timeline showing an improvement in the number of unexpected layout shifts. This demonstrates the direct impact of ongoing or completed work.
Segment Data by Page Type
Break down CLS scores by different page types (like home, product, or landing pages). This specificity helps identify which pages need more attention.
Compare Before and After
Show a before-and-after comparison of CLS scores for each significant update. This highlights the effectiveness of specific changes.
Detail Contributing Factors
Identify what elements contributed most to layout shifts (like images, ads, or fonts) and discuss how they were addressed.
Relate to User Experience
Explain how improvements in CLS scores positively affect user experience, Engagement, and Conversion Rates. Include a report on Core Web Vitals to show overall website performance.
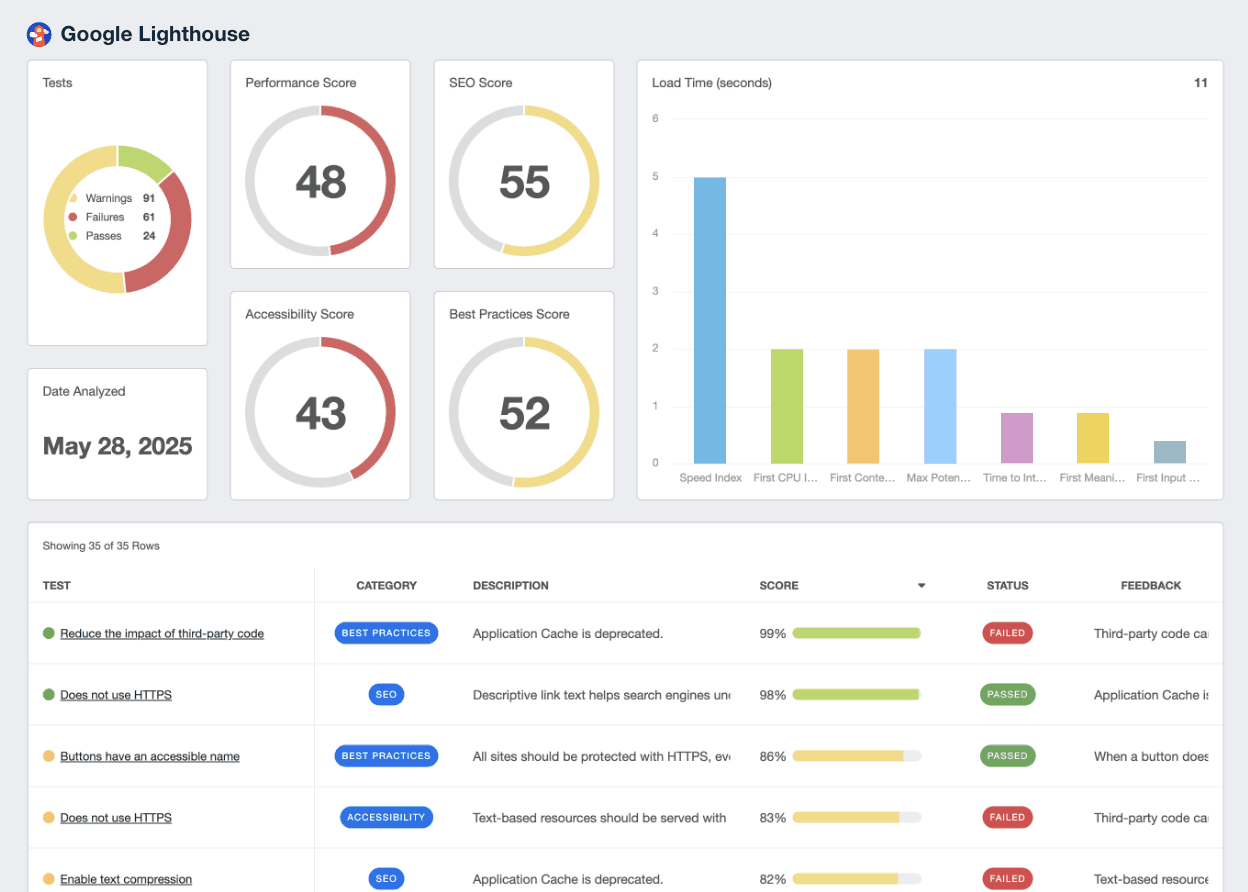
Google Lighthouse Dashboard Example
Related Integrations
How To Improve Cumulative Layout Shift
Improving CLS is crucial for a better user experience and higher SEO rankings. Here are three handy tips to reduce it.
Improve Font Loading
Choose a fallback font that closely matches the primary font's size and style. This prevents layout shifts while the main font is loading.
Plan for Dynamic Content
Pre-allocate space for dynamic content like pop-ups. Load them when the page is idle to prevent shifting other page elements.
Optimize Images
Set fixed image dimensions or the same aspect ratio to avoid layout shifts. Preload key images to enhance user interaction.
Related Blog Posts
See how 7,000+ marketing agencies help clients win
Free 14-day trial. No credit card required.


