Table of Contents
Table of Contents
- Google Lighthouse Explained
- How To Conduct Google Lighthouse Audits
- Decoding the Performance Score: Your Website's Report Card
- Utilizing Chrome DevTools Lighthouse with Google Lighthouse
- Delving Deeper into Google Lighthouse Audit Outcomes
- Important Google Lighthouse Metrics to Track
- Tips and Tricks for Using Google Lighthouse
- Streamlining Google Lighthouse Reporting: Say Hello to the AgencyAnalytics Integration
- Lighting the Way to Better Websites with Google Lighthouse
7,000+ agencies have ditched manual reports. You can too.
Free 14-Day TrialQUICK SUMMARY:
Google Lighthouse serves as a comprehensive auditing tool, scrutinizing web pages for performance, accessibility, SEO, and more. It evaluates speed, detects layout shifts, and offers optimization insights. This guide provides actionable steps for leveraging Google Lighthouse to boost web performance for agency clients.
Google Lighthouse was initially developed to assess progressive web apps (PWAs), including essential features like service worker registration and offline functionalities. While PWAs remain a key category in auditing, other optimization areas such as performance and SEO have been integrated as well.
Strap in, fellow Web Performance enthusiasts! We're about to embark on an illuminating journey that involves none other than our trusted website optimization guide, Google Lighthouse.
Imagine walking into a house filled with hidden rooms, secret passages, and tricky doorknobs. This, my friends, is much like the daunting universe of website performance improvements.
Google Lighthouse is your one-stop shop for performing comprehensive audits on your client’s web pages. It’s like a dedicated detective, probing deep into a website, revealing factors affecting the page load speed and overall performance score. It’s an essential part of your developer tools arsenal.
And when you use Google Lighthouse, remember this: it’s not about passing the test; it’s about understanding what each aspect of the test means for a website’s performance. A lighthouse report isn’t a school report card with a pass or fail stamp; rather, it’s a detailed roadmap to optimization, guiding you to the areas of a site that need your attention most.
In this blog post, we will delve deeper into the specifics of using Google Lighthouse. Remember, each website–like each client–is unique, requiring an individualized approach. Success lies in understanding and applying the insights that Google Lighthouse provides.
So, are you ready to unleash the potential of Google Lighthouse and enhance web page performance? Let’s get started.
Google Lighthouse Explained
When it comes to making sense of the tangled web (pun intended) of web performance, Google Lighthouse is the beacon that shines brightest.
Google Lighthouse targets several aspects of a page, including performance, accessibility, best practices, and SEO. Initially developed to assess progressive web apps, Lighthouse evaluates essential features like service worker registration and offline functionalities. Over time, it has expanded to include other optimization areas such as performance and SEO.
What Is Google Lighthouse, Anyway?
Google Lighthouse is an open-source, automated auditing tool that doesn't just scan a web page, but does so with an eagle eye. It targets several aspects of the page, like performance, accessibility, SEO, and more. The importance of a Lighthouse audit is directly tied to the web's evolving dynamics, where speed and accessibility are not just a luxury, but a necessity.
At its core, Google Lighthouse is like your page's report card, and it doesn't hold back any punches.
How It Helps Website Performance Optimization
The magic of Google Lighthouse lies in its systematic approach to website auditing. It examines how quickly the web page becomes interactive (speed index), watches for sudden page shifts (cumulative layout shift), and much more.
Once you run Google Lighthouse, it provides detailed feedback on the areas that require improvement, setting a roadmap for optimizing web performance.
The Importance of Performance and Page Load Speed
In a world that moves at the speed of a scrolling thumb, a delay of even a second in page load time can spell doom for the best of websites. Slow-loading pages push visitors away, affect search engine rankings, and impact the bottom line. Therefore, using tools like Google Lighthouse to ensure optimal performance is more than a good practice–it's a survival strategy.
It's not just about improving numbers on an audit; it's about turning insights into action, one web page at a time.
Impress clients and save hours with custom, automated reporting.
Join 7,000+ agencies that create reports in under 30 minutes per client using AgencyAnalytics. Get started for free. No credit card required.
Already have an account?
Log inHow To Conduct Google Lighthouse Audits
Let's take a closer look at the types of audits, how they work, and how you can conduct one yourself.
Types of Lighthouse Audits
Google Lighthouse divides its audits into five primary categories:
Performance: This focuses on core web vitals, such as the speed index (how quickly content is visually displayed), cumulative layout shift (how much elements on the page move around during load), and more. If you’ve ever tried to click on a button on a website, only to have it shift out of the way so you ended up clicking on something else–you’ll understand how important this is.
Accessibility: These audits scrutinize whether your website is easily accessible to all users, including those with disabilities. It checks elements like color contrast, correct use of headings, and appropriate labeling.
Best Practices: Here, Google Lighthouse identifies opportunities to apply web development best practices, helping to prevent potential issues that could harm your site’s security or performance.
SEO: The SEO audits ensure that your site is optimized for search engine visibility, focusing on elements like meta descriptions, crawlability, and appropriate use of HTML tags.
Progressive Web Apps: Google Lighthouse also evaluates progressive web apps, ensuring they meet essential criteria like service worker registration and offline capabilities.
Although, for most agencies, the top 4 are the most critical.
Easily track your client's Google Lighthouse data with the Google Lighthouse reporting integration. Try AgencyAnalytics free for 14 days!
Step-by-Step Guide on How to Run a Lighthouse Audit
Google Lighthouse audits are straightforward to conduct, and you can do them right in your Chrome browser. Here’s how:
Step One: Install the Google Lighthouse plugin. You can either use it once you have a Google Chrome browser installed (via the Developer Tools). Alternatively, install it as a Node module.
Step Two: Open Developer Tools in your Google Chrome browser. You can do this by right-clicking on your webpage and selecting ‘Inspect,’ or by pressing ‘Ctrl+Shift+I’ (Windows) or ‘Cmd+Option+I’ (Mac).
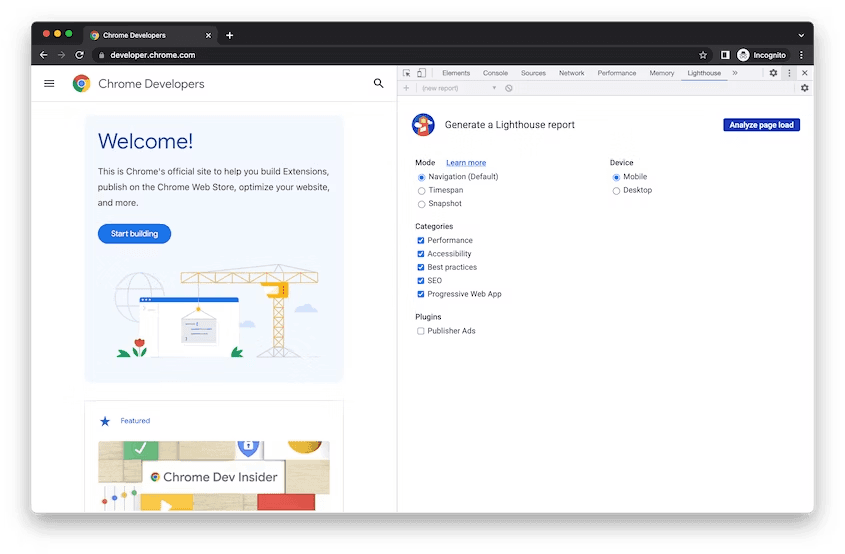
Step Three: Go to the Chrome DevTools Lighthouse option.
Step Four: Configure your audit by choosing the categories you wish to test (Performance, Accessibility, Best Practices, SEO).
Step Five: Click on ‘Generate report.’ Lighthouse will now run the audit on the currently active tab.
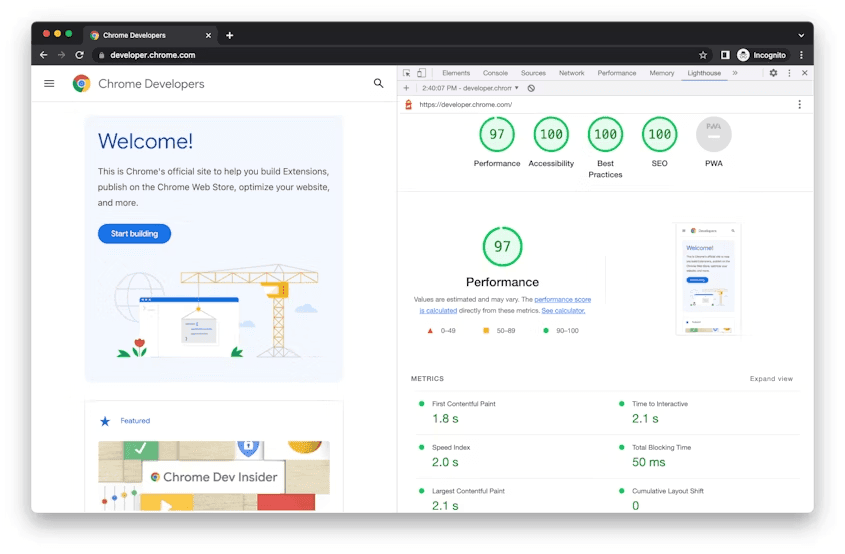
Step Six: Review your report. The Lighthouse score, a weighted average of all the performance metrics, gives you a snapshot of your web page’s health.
You’ll also have the option to test the functionality of a progressive web app (PWA), which is designed to work on any device with a screen and a web browser. Google Lighthouse was initially developed to assess progressive web apps, including features like service worker registration and offline functionalities. Well-functioning web apps deliver an optimal user experience and increase engagement, so it’s also worth evaluating.
Remember, running a Lighthouse audit doesn’t impact your website. It’s just an automated tool that visits your site, just like any other user would, albeit with a far more analytical eye.
There are also tips on how to install and run the Node command line tool, but we’ll leave that for another time.
Extra: Utilizing PageSpeed Insights
PageSpeed Insights is another automated tool that utilizes Lighthouse in its core processes.
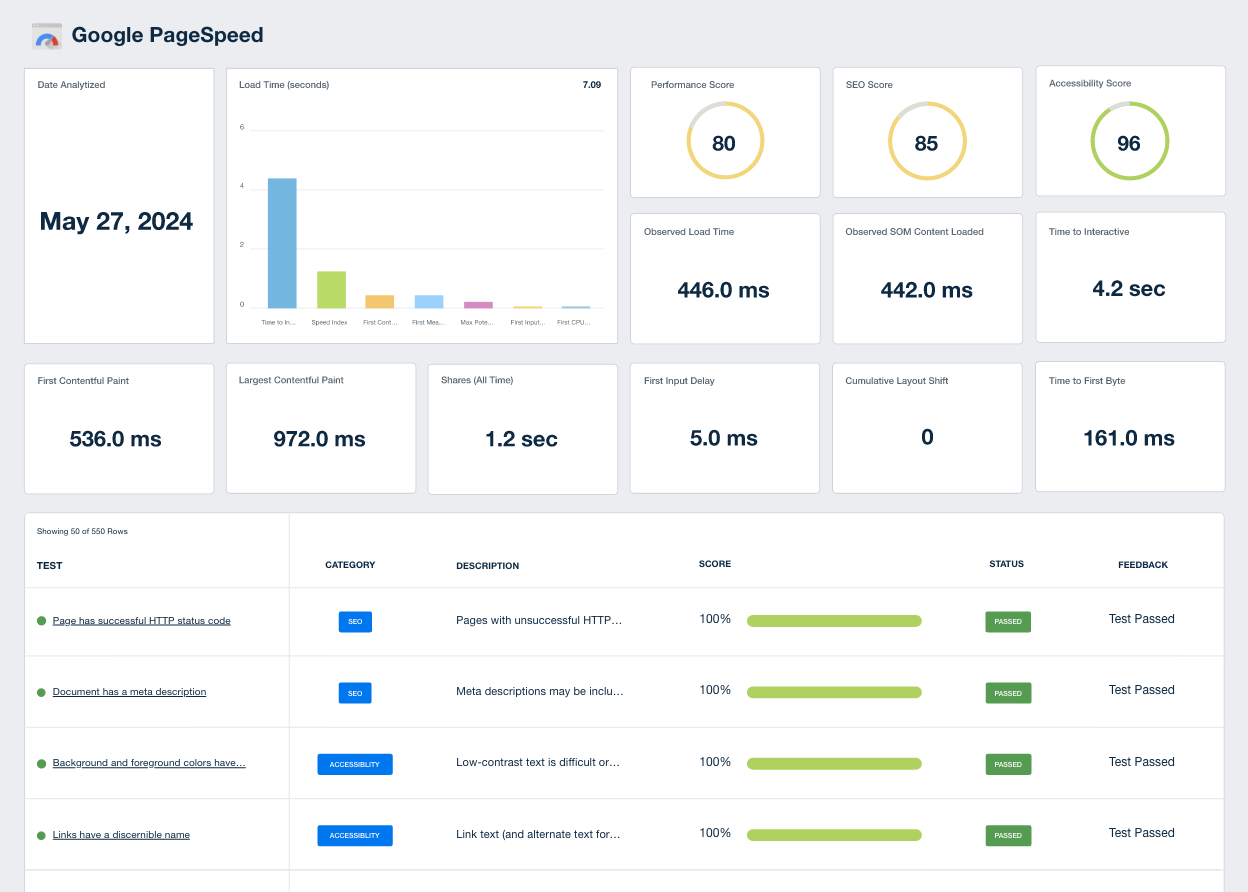
This online tool not only offers a simple way to run a speed test on any webpage but also integrates real-world user experience data from the Chrome User Experience Report.
Decoding the Performance Score: Your Website's Report Card
Google Lighthouse performance scores are more than just numbers. Think of them as the pulse of your website, a reflection of your website's health. This section will unravel the mystery of the Lighthouse performance score, how it's calculated, and why it matters.
Overview of the Lighthouse Performance Score
The Lighthouse performance score is a fast, visual summary of your web page's performance.
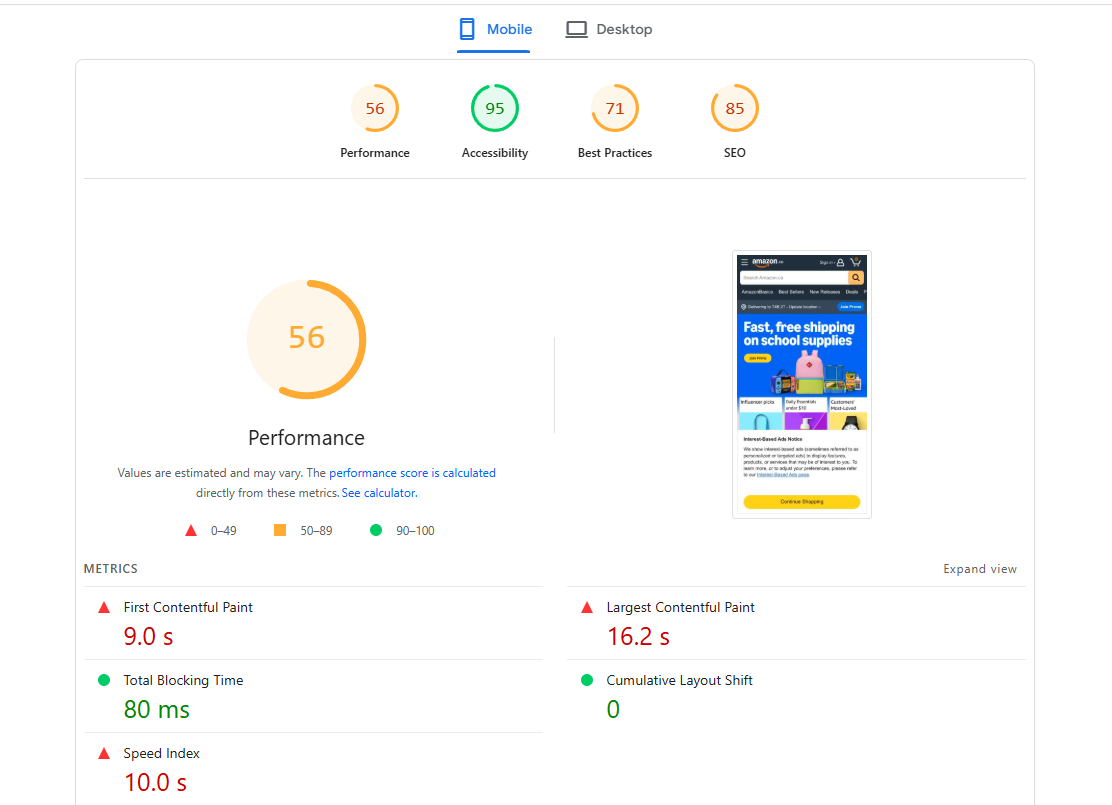
On a scale of 0 to 100, it's a composite score, meaning it combines several different metrics to give you an overall view of your site's speed and usability. A score of 100 is the Holy Grail, indicating that your page is performing–well-perfectly. Anything less means there's room for improvement.
Although there is a bit of a law of diminishing returns. You could spend weeks tweaking every line of code in order to move a page from a score of 92 to 94, or hours shifting a score from 40 to 90. Remember to prioritize your efforts to provide the most bang for your client’s buck.
Breakdown of How the Score Is Calculated
Now, onto the geeky bit (and it's not even that geeky, promise!). How is this mysterious performance score calculated? It's all about metrics. The performance score is based on a weighted average of various metrics, such as First Contentful Paint (FCP), Speed Index (SI), Largest Contentful Paint (LCP), Time to Interactive (TTI), Total Blocking Time (TBT), and Cumulative Layout Shift (CLS).
Each metric reflects a different aspect of page load speed and responsiveness. For example, First Contentful Paint measures how long it takes for the first bit of content to appear on screen after a user navigates to your page. Cumulative Layout Shift, on the other hand, quantifies how much elements on the page shift around during load.
Each metric is assigned a weight, reflecting its relative importance in the overall score. These weights can change as Lighthouse's algorithm evolves, so it's a good idea to stay updated on the latest version of Lighthouse.
The Importance of the Performance Score in Gauging Website Health
So, why should anyone care about these Lighthouse scores? Well, a high performance score signifies a fast, responsive, and user-friendly website, which makes visitors want to stick around. Plus, search engines are kind of in love with speedy, efficient websites, meaning a high score also gives your clients a boost in search rankings.
In short, understanding the Lighthouse performance score isn't just about chasing after a perfect 100 (although that's a great goal). It's about getting a clear, quantified snapshot of a website's health. So, next time you see that Lighthouse score, remember–it's not just a number. It's part of the whole story about the website's performance (along with Google's Core Web Vitals metrics and other data points).
Utilizing Chrome DevTools Lighthouse with Google Lighthouse
Google Lighthouse and Chrome DevTools go together like peanut butter and jelly. They are a match made in digital heaven that can help decode the mysteries of site performance.
Chrome DevTools is a set of web developer tools built directly into the Google Chrome browser. These tools enable you to view, edit, debug, and optimize a site directly from your browser, making them an indispensable asset in your digital toolkit.
Key features of DevTools relevant to Google Lighthouse include:
Network Panel: Here, you can analyze network requests that can potentially slow down your site. You can also see how much data is being transferred, and how long it takes, giving you an insight into what’s delaying your page load times.
Performance Panel: This provides a timeline of network requests, JavaScript parsing, layout rendering, and other critical events that impact page load times.
Coverage Tab: This Lighthouse panel helps identify unused CSS and JavaScript on your page, highlighting areas for potential optimization.
Audits Panel: This is where Google Lighthouse lives within DevTools, ready to run comprehensive audits on your site.
Google Lighthouse in Chrome DevTools interact seamlessly to improve the site's performance. Run Lighthouse audits directly from the Audits Panel in DevTools, offering immediate insight into performance, accessibility, and SEO right in your browser.
After running an audit, dive deeper with other DevTools to address issues identified by Lighthouse:
Eliminating Render Blocking Resources: DevTools helps pinpoint scripts or stylesheets that block rendering, thereby slowing down your site. By eliminating these roadblocks, a site is free to deliver content faster.
Optimizing Web Fonts: DevTools enables you to identify web fonts that slow down the site and find more efficient ways to load them.
Reducing Unused CSS: The Coverage tab in DevTools lets you find and remove unused CSS, streamlining your code and enhancing load speeds.
Identifying and Addressing Browser Errors: DevTools Console helps you detect browser errors that could interfere with the end-user experience.
Ultimately, Google Lighthouse in Chrome DevTools is incredibly powerful. Lighthouse identifies issues that can impact your site's performance, while DevTools gives you the tools to address those issues head-on. So, whether you're battling browser errors or wrestling with render-blocking resources, these tools have got your back.
Delving Deeper into Google Lighthouse Audit Outcomes
A Google Lighthouse audit generates a detailed report divided into several sections, each offering insights into a different aspect of your website.
The top of the report displays your performance score, a number from 0 to 100 that encapsulates your site's overall performance. Following that, the report dives into specific metrics. Each metric comes with a score, a value, and a description to help you understand what it measures and how your site is doing.
The 'Opportunities' and 'Diagnostics' sections offer advice on how to improve your website. They list potential issues impacting your site's performance, along with estimated savings if these issues were fixed.
Finally, the 'Passed Audits' section lists everything that's going well with your site, giving you a pat on the back for things you're doing right.
Understanding What Each Metric Represents
Understanding the metrics in your Lighthouse report is key to interpreting and actioning the audit outcomes. Here's a quick look at some of the critical areas to dig into withing Lighthouse:
First Contentful Paint (FCP): Measures the time from when the page starts loading to when any part of the page's content is rendered on the screen.
Speed Index (SI): This measures how quickly the contents of a page are visibly populated. The lower the score, the better.
Largest Contentful Paint (LCP): Reflects the time it takes to render the largest content element visible in the viewport.
Time to Interactive (TTI): This quantifies how long it takes a page to become fully interactive.
Cumulative Layout Shift (CLS): Quantifies how much unexpected layout shift of visible page content occurs during page load.
Total Blocking Time (TBT): Measures the total amount of time when the main thread was blocked long enough to prevent input responsiveness.
Each metric shines a light on a different aspect of your website's performance, and together they provide a comprehensive overview of your site's health.
Decoding a Google Lighthouse audit may feel a bit like deciphering a secret code at first. But once you understand what each metric represents, it turns into a treasure map, leading you towards a high-performing, user-friendly website.
The following provides a quick overview of common Lighthouse issues, as well as recommendations on what you can look into to address them.
Common Lighthouse Issues | Things to Try |
Slow First Contentful Paint (FCP) | Minimize server response times, remove render-blocking JavaScript and CSS, and optimize and compress images. |
High Speed Index (SI) | Optimize the website's content efficiency, minimize main-thread work, and keep request counts low and transfer sizes small. |
Slow Largest Contentful Paint (LCP) | Optimize the server, critical CSS, images, and font loading, and remove any client-side rendering. |
Long Time to Interactive (TTI) | Minimize third-party usage, reduce JavaScript execution time, and keep request counts low. |
High Total Blocking Time (TBT) | Minimize long tasks, reduce JavaScript execution time, and keep sizes of network payloads small. |
High Cumulative Layout Shift (CLS) | Ensure elements have a reserved space, avoid inserting new content above existing content, and avoid animations that cause layout shifts. |
Unused CSS | Remove unused CSS, and minify and compress CSS files. |
Render-blocking resources | The first step is to eliminate render-blocking resources. Defer non-critical CSS and JavaScript, minify and compress CSS and JavaScript files. |
Unoptimized images | Compress and resize images, serve images in next-gen formats like WebP, and lazy load offscreen images. |
Too many HTTP requests | Use HTTP/2, concatenate and minify files, and use content delivery networks (CDNs). |
Over reliance on heavy third-party scripts | Limit the use of third-party scripts or use lightweight alternatives. |
Important Google Lighthouse Metrics to Track
Google Lighthouse provides us with a plethora of metrics to understand website performance. Let's cast our gaze over these essential metrics, highlighting what they are and why they matter.
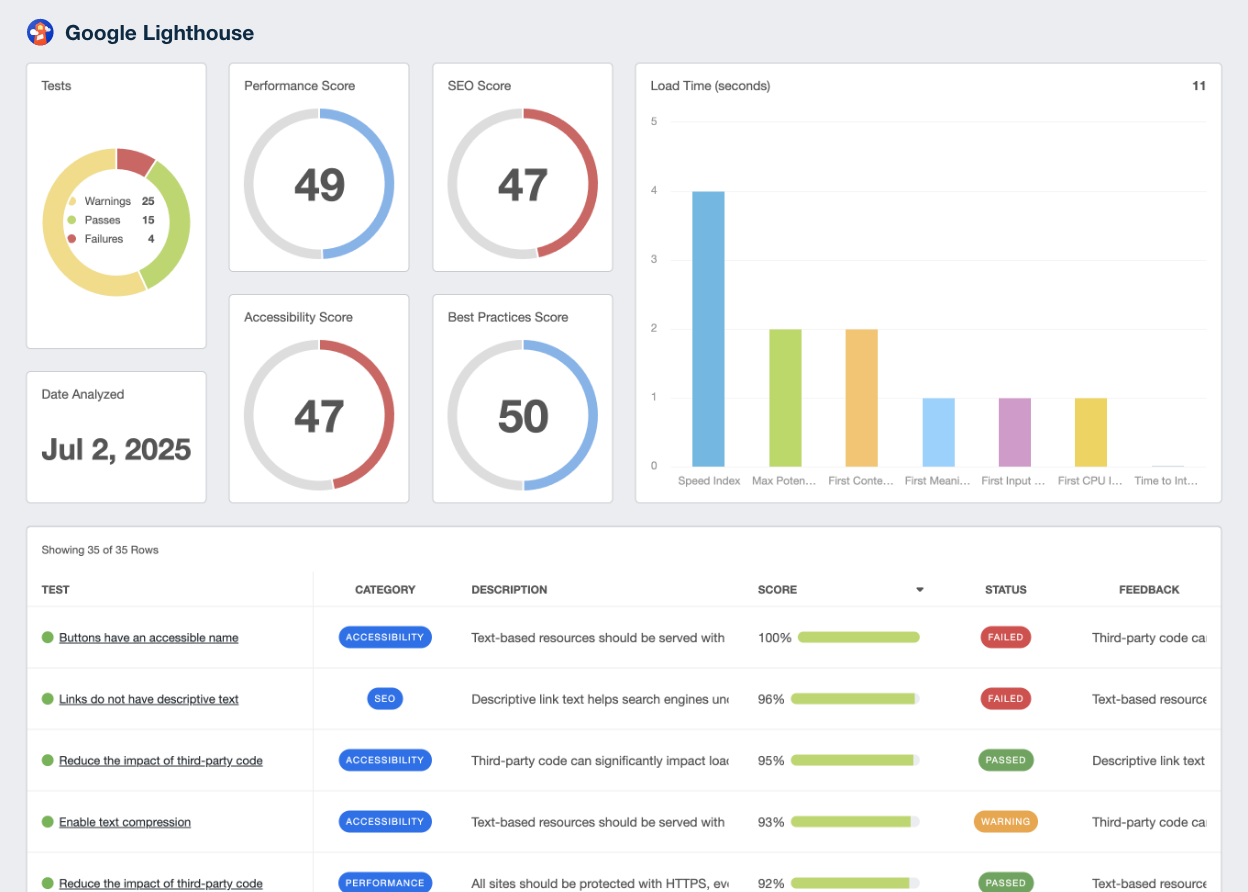
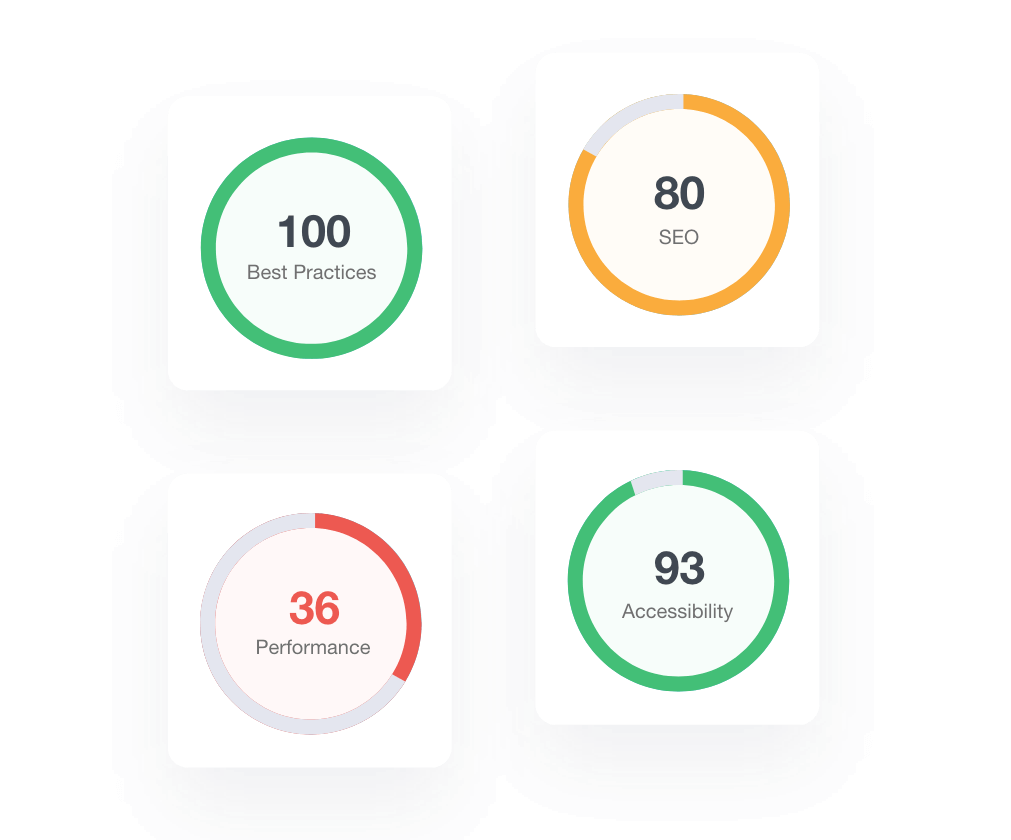
Lighthouse Performance Score
Think of the performance score as the main character of your Lighthouse report.
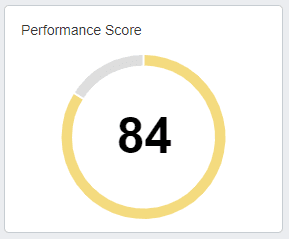
It's an aggregate score derived from various page-level metrics, including First Contentful Paint (FCP), Speed Index (SI), and Largest Contentful Paint (LCP). It provides an instant snapshot of your website's speed and performance. Remember, the closer the score is to 100, the better.
Lighthouse SEO Score
SEO, or Search Engine Optimization, is the art of making your site more attractive to search engines.
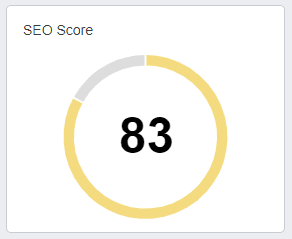
Your SEO score reveals how well your site adheres to SEO best practices. A high SEO score means you're making it easy for search engines to crawl and index your site, improving your visibility in search results.
Lighthouse Accessibility Score
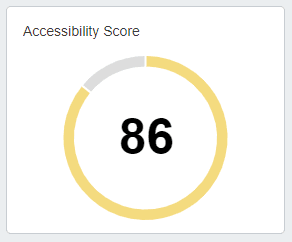
It looks at things like color contrast, font size, and the presence of alt text for images. A high score in this area signals a site that is accessible and inclusive.
Lighthouse Best Practices Score
This score assesses your adherence to modern web development best practices.
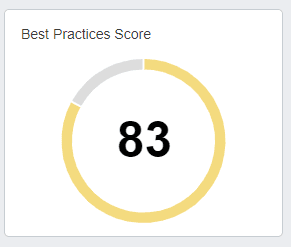
This includes everything from HTTPS usage to correctly sized images. Keeping this score high is a sign that the site is keeping up with the fast-paced world of web development.
Tests Passed, Failed, Warnings
Google Lighthouse tests your website against a list of preset checks. The results highlight the tests your site passed, the tests it failed, and any potential issues that might need your attention.
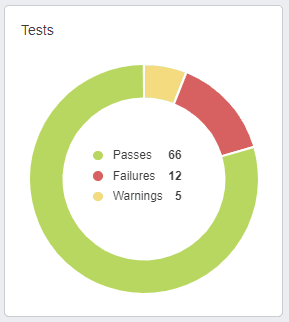
It's a quick snapshot that highlights where you excel and where there's room for improvement.
Load Time (seconds)
Load time is a crucial aspect of website performance.
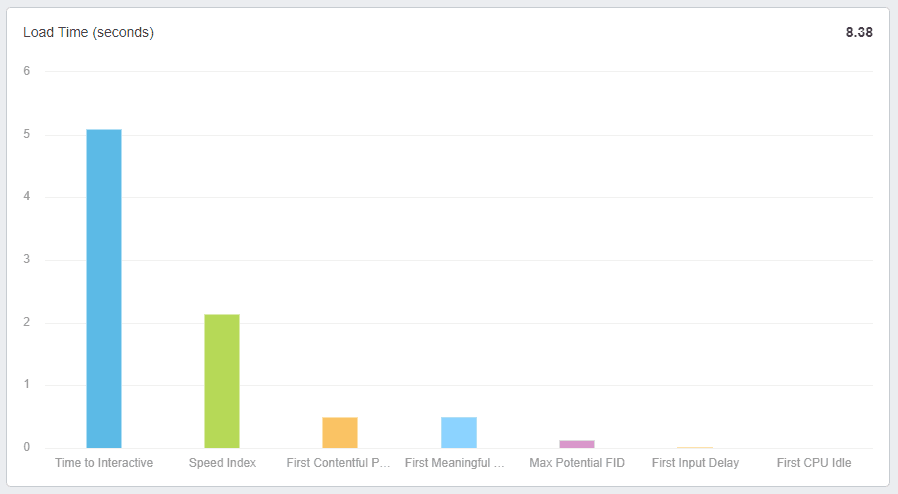
It measures the time it takes for a web page to fully load. In the world of web performance, speed is king, and every second counts.
Detailed Test Results: Decoding the Feedback
As they say, the devil is in the details. And when it comes to Google Lighthouse performance audits, the details live in the test results.
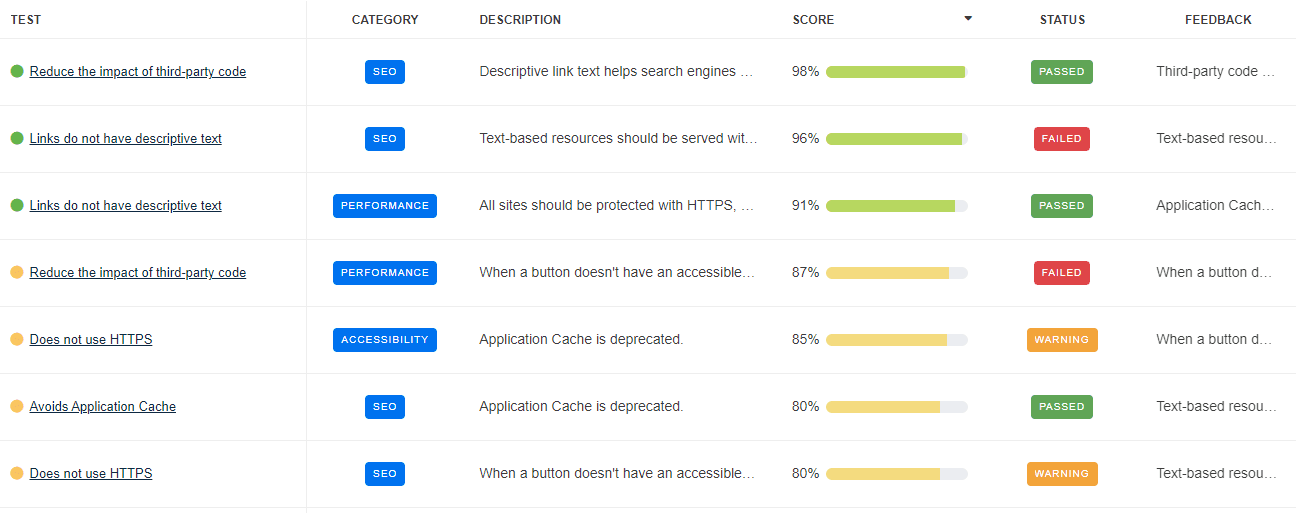
Each audit you run presents a specific test, pinpointing the areas of your webpage that need some TLC. Think of these tests as your webpage's report card. Each one presents its findings in a clear, easy-to-understand format.
The test results are broken down into sections:
Passed Audits: This is where you get to pat yourself on the back. These are areas of your webpage that met the Google Lighthouse standard, typically scoring 90 or above. But don't just gloss over them, as they provide valuable insights into what you're doing right.
Audits to Improve: Here's where the work starts. This section lists the areas in the 50-89 range where the webpage could do better. But don't worry! Each item here is an opportunity for improvement, not a failure.
Failed Audits: Okay, so this is the tough love section. These are areas where your webpage didn't quite hit the mark, scoring below the 50 mark. But it's not all doom and gloom. Think of these as your roadmap to a better website.
This table outlines some of the tests that Google Lighthouse runs automatically.
All text remains visible during webfont loads | Document has a meta description | Largest Contentful Paint image was not lazily loaded | Preload Largest Contentful Paint image |
Avoid an excessive DOM size | Document has a valid `hreflang` | Links are not crawlable | Properly defines charset |
Avoid enormous network payloads | Document has a valid `rel=canonical` | Links do not have descriptive text | Properly size images |
Avoid multiple page redirects | Does not use HTTPS | Links have a discernible name | Reduce JavaScript execution time |
Avoid serving legacy JavaScript to modern browsers | Efficiently encode images | Max Potential First Input Delay | Reduce unused CSS |
Avoids deprecated APIs | Eliminate render-blocking resources | Minify CSS | Reduce unused JavaScript |
Background and foreground colors have a sufficient contrast ratio | Enable text compression | Minify JavaScript | robots.txt is valid |
Buttons do not have an accessible name | First Contentful Paint | Minimize third-party usage | Serve images in next-gen formats |
Cumulative Layout Shift | First Meaningful Paint | No issues in the `Issues` panel in Chrome Devtools | Serve static assets with an efficient cache policy |
Defer offscreen images | Image elements have `[alt]` attributes | Page has successful HTTP status code | Serves images with appropriate resolution |
Displays images with correct aspect ratio | Image elements have explicit `width` and `height` | Page has the HTML doctype | Speed Index |
Document avoids plugins | Initial server response time was short | Page has valid source maps | Time to Interactive |
Document has a `<title>` element | Largest Contentful Paint | Page isn’t blocked from indexing | Total Blocking Time |
Tips and Tricks for Using Google Lighthouse
Google Lighthouse is like the Swiss Army knife of website optimization. But like any multifaceted tool, there are ways to wield it more effectively. Here are some tips and tricks to help you get the most out of Google Lighthouse.
Install Lighthouse for Flexibility: You can install Lighthouse as a Chrome extension for quick, easy access. For more flexibility, try installing it as a Node command line tool. This enables you to automate your audits and integrate them into your development process.
Understand the Difference between Field and Lab Data: Lighthouse reports contain both lab and field data. Lab data is collected in a controlled environment and is useful for debugging performance issues. Field data, on the other hand, reflects real-world user experiences. Both are valuable in their own right.
Embrace Browser Extensions: The Lighthouse panel in Chrome's developer tools is your best friend. But don't forget about other browser extensions, like the Chrome Extension Workflow, which can enhance your auditing process.
Overcoming Common Obstacles in Performance Optimization
Even the most seasoned site owner can encounter obstacles on the path to optimization. Here are some pointers to help you overcome common hurdles:
Testing Local Sites: If you want to run an audit on a local site or a page behind a firewall, consider using the command line version of Lighthouse. It's perfect for testing before pushing changes live.
Dealing with Variability: If you're getting different results each time you run an audit, don't panic. Performance can vary due to network conditions, CPU throttling, and cache state. It's best to run several audits and look at the median result.
Interpreting Single Page Load: Lighthouse's performance score is primarily about how fast a single page loads when a user visits it for the first time. If your site relies heavily on subsequent page loads, take this into account when interpreting your performance score.
Remember, Google Lighthouse isn't a magic wand that solves all of a site's performance issues. But with these tips and tricks up your sleeve, you'll be better equipped to navigate the lighthouse reports, uncover valuable insights, and shine a light on areas for improvement. The journey to optimal website performance is just a few audits away!
Streamlining Google Lighthouse Reporting: Say Hello to the AgencyAnalytics Integration
Let's face it: managing Google Lighthouse reports across various clients can feel like spinning plates. Enter the AgencyAnalytics integration with Google Lighthouse. It's like having an extra pair of hands, allowing you to keep all those plates in the air with grace and efficiency.
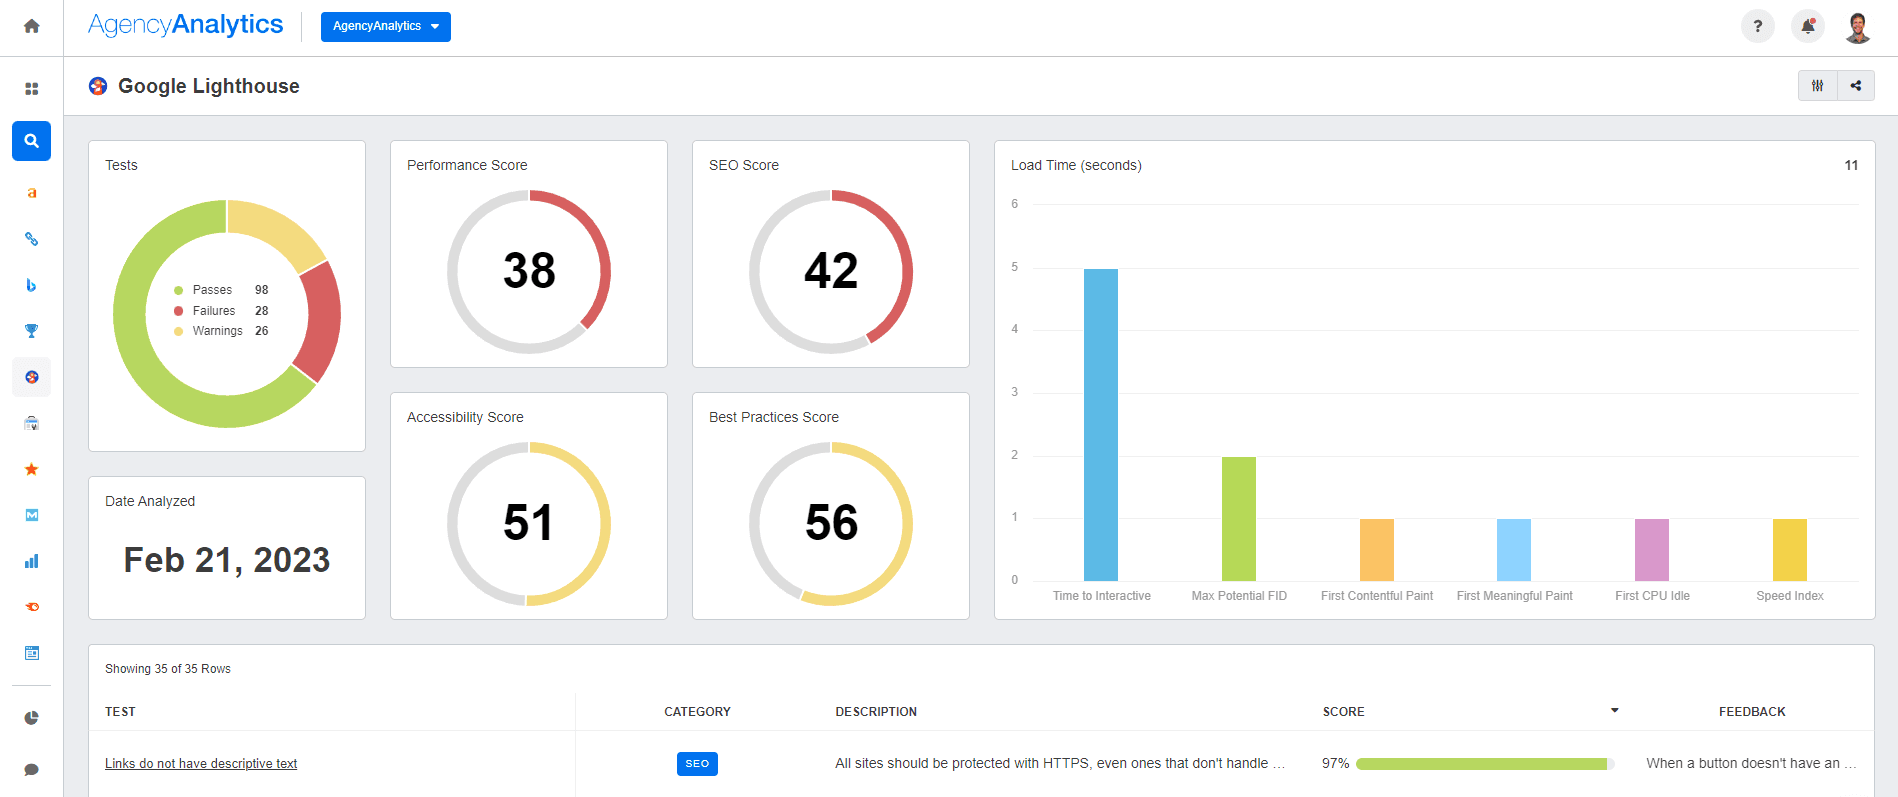
The AgencyAnalytics integration fetches data from Google Lighthouse, giving your agency an overview of all your clients' website performance at a glance. It offers both broad and detailed views, allowing you to easily assess overall performance or deep-dive into individual tests. In short, it's like having a translator who speaks both Google Lighthouse and your agency's language.
Using AgencyAnalytics with Google Lighthouse is like having your cake and eating it, too. You get to enjoy the detailed insights from Google Lighthouse audits, while AgencyAnalytics serves up these insights in a clear, client-friendly format. It saves you time, reduces complexity, and presents data in a way that clients can understand and appreciate.
Lighting the Way to Better Websites with Google Lighthouse
Like a digital North Star, Google Lighthouse helps steer a website towards the land of optimum performance. It shines a light on the site's strengths, points out areas for improvement, and provides invaluable metrics that help you chart your agency’s progress.
Mastering Google Lighthouse doesn't just make you a better digital marketer—it makes the web a better place. With faster, more accessible, and user-friendly websites, the Internet becomes a more inclusive and enjoyable space for all. So here's to lighting the way, one website at a time, with Google Lighthouse at our side.

Written by
Alex is in product marketing, pushing the great work from the engineering team out into the world. When he's not marketing, he's probably rock climbing or researching the latest eCommerce trends!
Read more posts by Alex GirardiSee how 7,000+ marketing agencies help clients win
Free 14-day trial. No credit card required.


