Time to Interactive (TTI)
Optimize Speed
Reducing the time for pages to become interactive boosts user satisfaction.
Analyze Performance
Regular TTI checks are useful to identify areas for optimization, like web speed.
Improve SEO
Faster interactive times contribute to better search engine rankings.
Enhance UX
A quick TTI ensures a smooth, optimal, and seamless user experience (UX).
Why TTI Is Important
TTI is a user-centric metric that provides a page load timeline, helping marketers discover bottlenecks and ensure better website performance.
Plus, a positive user experience is closely tied to business success. Fast and responsive websites tend to hold user attention for a longer time. It may even encourage further engagement (like Clicks) or a conversion-oriented action.
Also, Google and other search engines use page load speed as a ranking factor. A website with a good TTI score is more likely to achieve a higher ranking in search results. In turn, this leads to increased visibility and traffic.
In essence, a low TTI leads to a more seamless user experience. In the long run, this means more website traction, higher SERP positions, and better marketing results.
Stop Wasting Time on Manual Reports... Get Insights Faster With AgencyAnalytics
How TTI Relates To Other KPIs
TTI is closely related to Google’s Core Web Vitals: Largest Contentful Paint (LCP), First Input Delay (FID), and Cumulative Layout Shift (CLS).
LCP measures the time it takes for the largest content element in the viewport (like an image or block of text) to become fully visible. FID measures a website’s response time after an initial user action. Finally, CLS measures all unexpected layout shifts that occur while a page is loading.
While TTI is not a Core Web Vitals metric, it complements these insights by assessing website interactivity. Therefore, improving TTI–in addition to Core Web Vitals–will significantly enhance the user experience.
Additionally, a favorable TTI reduces Bounce Rate, ensuring that users can navigate a web page in a reasonable timeframe. This may lead to a higher Engagement Rate and Conversions over time.
Key Factors That Impact TTI
Many key elements affect TTI. These include code structure, resource loading, and server response time. To improve TTI, developers should prioritize loading the most visible page elements and using event handlers (i.e., code snippets that fast-track specific actions).
This avoids the delay caused by render-blocking resources, which could keep users waiting unnecessarily. Additionally, use a Content Delivery Network (CDN) to enhance server performance and deliver content more efficiently.
In short, optimize these elements to make a website visually ready and fully interactive as quickly as possible.
A website is often the first point of contact between a business and its potential customers. It’s why we prioritize good design and user experience. We ensure a client’s website looks great, functions optimally, and engages visitors.
How To Calculate Time to Interactive (TTI)
To measure TTI, note when a page begins loading until it fully responds to user interactions. Following this, evaluate the load times of critical elements (e.g., CTA buttons, lead forms). Once this is complete, calculate the difference between these two numbers.
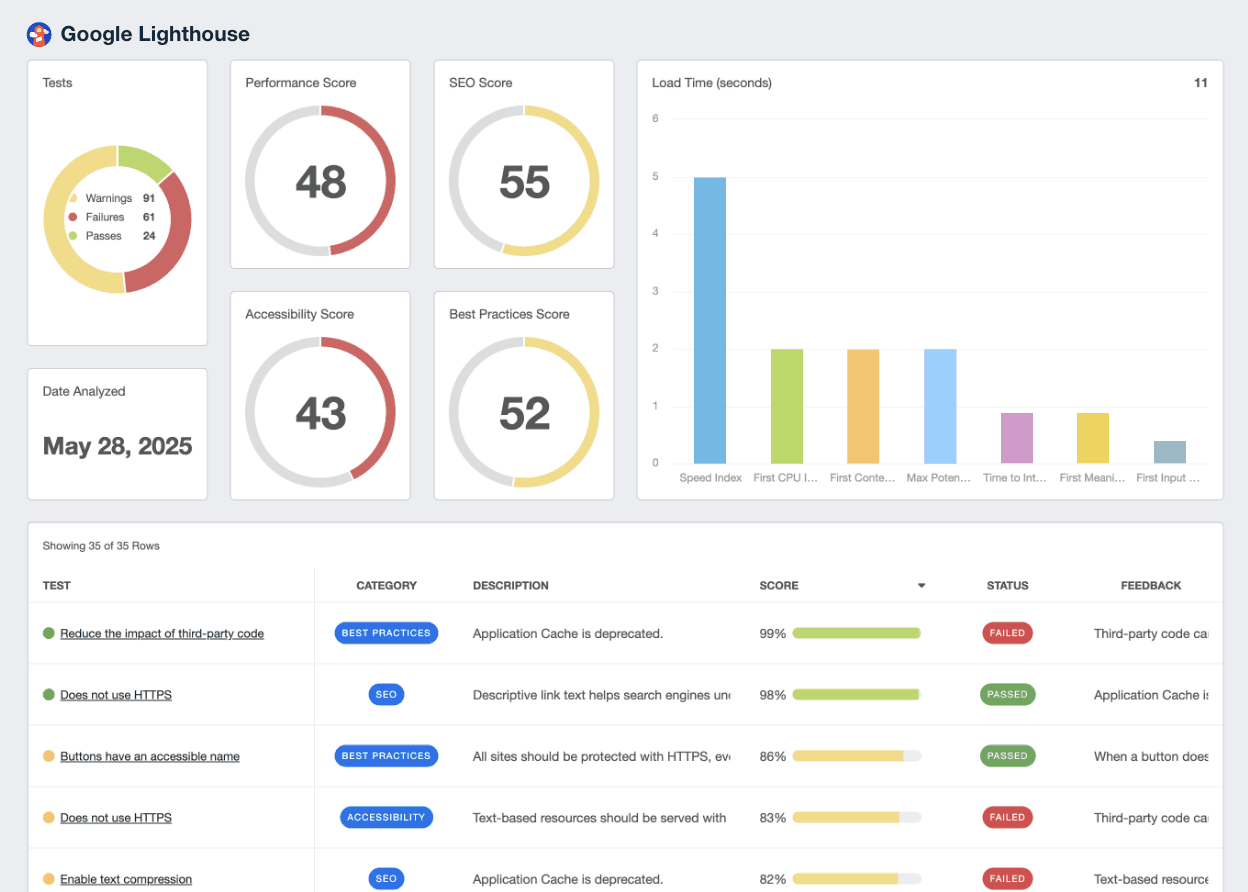
For best results, use automated tools like Google's Lighthouse and Chrome DevTools. They’re designed to simulate user input, providing a more accurate TTI metric.
TTI Formula Example
What Is a Good TTI Score?
A good TTI score is generally under 3.8 seconds, ensuring that users can start interacting with a page after it loads.
This quick responsiveness minimizes frustration and reduces the likelihood of users abandoning the page. To maintain this range, regularly monitor TTI scores to identify performance bottlenecks and make improvements.
What Is a Bad TTI Score?
A slow TTI score is typically over 7.3 seconds, which may lead to a frustrating user experience and a higher Bounce Rate. Some common reasons include heavy JavaScript execution and unoptimized media files.
To prevent this from happening, optimize code for long Javascript tasks and minimize third-party dependencies. Also, it’s a good idea to prioritize the most visible elements.
How To Set Time to Interactive (TTI) Benchmarks and Goals
To get started, run a performance audit to assess the initial page load time and establish a baseline. Then, pinpoint specific areas that lead to a high TTI, such as server response times, heavy JavaScript, or inefficient loading of CSS scripts.
If the overall performance score is significantly high (e.g., 7 seconds), aim for a substantial reduction, like 5 seconds or less. For a moderately high TTI score (around 4-6 seconds), set a goal to bring it under 3.8 seconds. After making improvements, monitor TTI scores over time and adjust goals accordingly.
Why TTI Matters to Clients
TTI matters to clients because it directly impacts the user experience and other business outcomes. A fast TTI ensures that potential customers are able to interact with a website almost immediately. This makes it easier to perform meaningful actions, like filling out a form or completing an online sale.
Additionally, a healthy TTI often improves a website's SEO performance and leads to increased organic traffic. A higher SERP position boosts website credibility and authority, which is an ideal scenario for any client.

Why TTI Matters to Agencies
For agencies, a good TTI highlights technical expertise and their ability to drive marketing results. It also enhances the effectiveness of SEO strategies, which builds client confidence in the process.
A fast TTI also has a trickle effect on other marketing goals. If users have a positive experience with a client’s website, they’re more likely to engage further. Therefore, optimizing TTI helps agencies achieve other results, like increased leads or sales. In turn, this may increase retention rates over time.

Try the Only Reporting Software Created For Marketing Agencies.
Best Practices When Analyzing and Reporting on TTI
When reporting on TTI, it’s essential to ensure the data is clear, relevant, and actionable. Here are some best practices to keep in mind.
Ensure Data Accuracy
To avoid skewed results, check that TTI data is collected under consistent conditions (e.g., testing with a similar server response time).
Analyze Over Time
Look for patterns related to specific campaigns, content updates, or seasonal changes. This shows the impact of recent optimizations on TTI.
Put in Context
Correlate TTI with metrics like Bounce rate, Conversion rate, and Page Views to illustrate its full impact. Also, explain how TTI influences user satisfaction.
Align to Client Goals
Ensure TTI improvements are framed according to the client’s specific goals (e.g., explain how a favorable TTI led to a higher Time on Page).
Visualize Performance
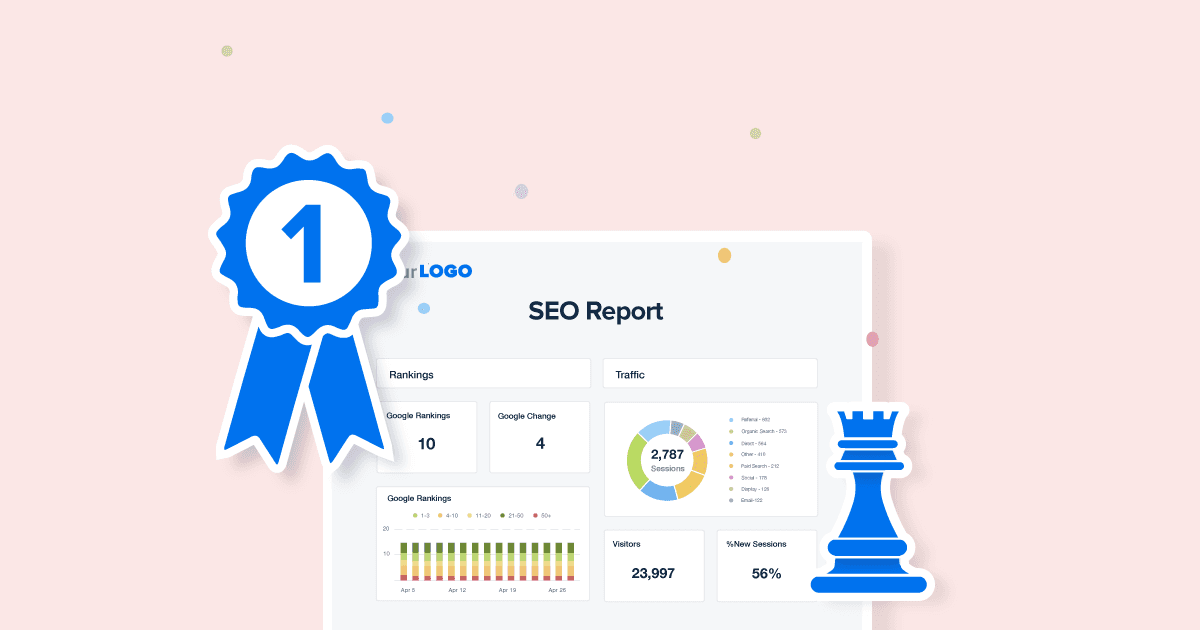
Use data aids such as charts, graphs, and timelines to illustrate TTI trends. This allows clients to assess website health, uncover patterns, and analyze user interactivity.
Include Actionable Recommendations
Send a report with clear, actionable steps for improving TTI. This includes reducing a long task (e.g., CSS files) or prioritizing elements in the main thread.
Professional reports help communicate the results of marketing campaigns, website performance, and other key metrics to stakeholders such as clients, management, and investors. This helps demonstrate the value of the work being done and provides a clear picture of progress towards goals and objectives.
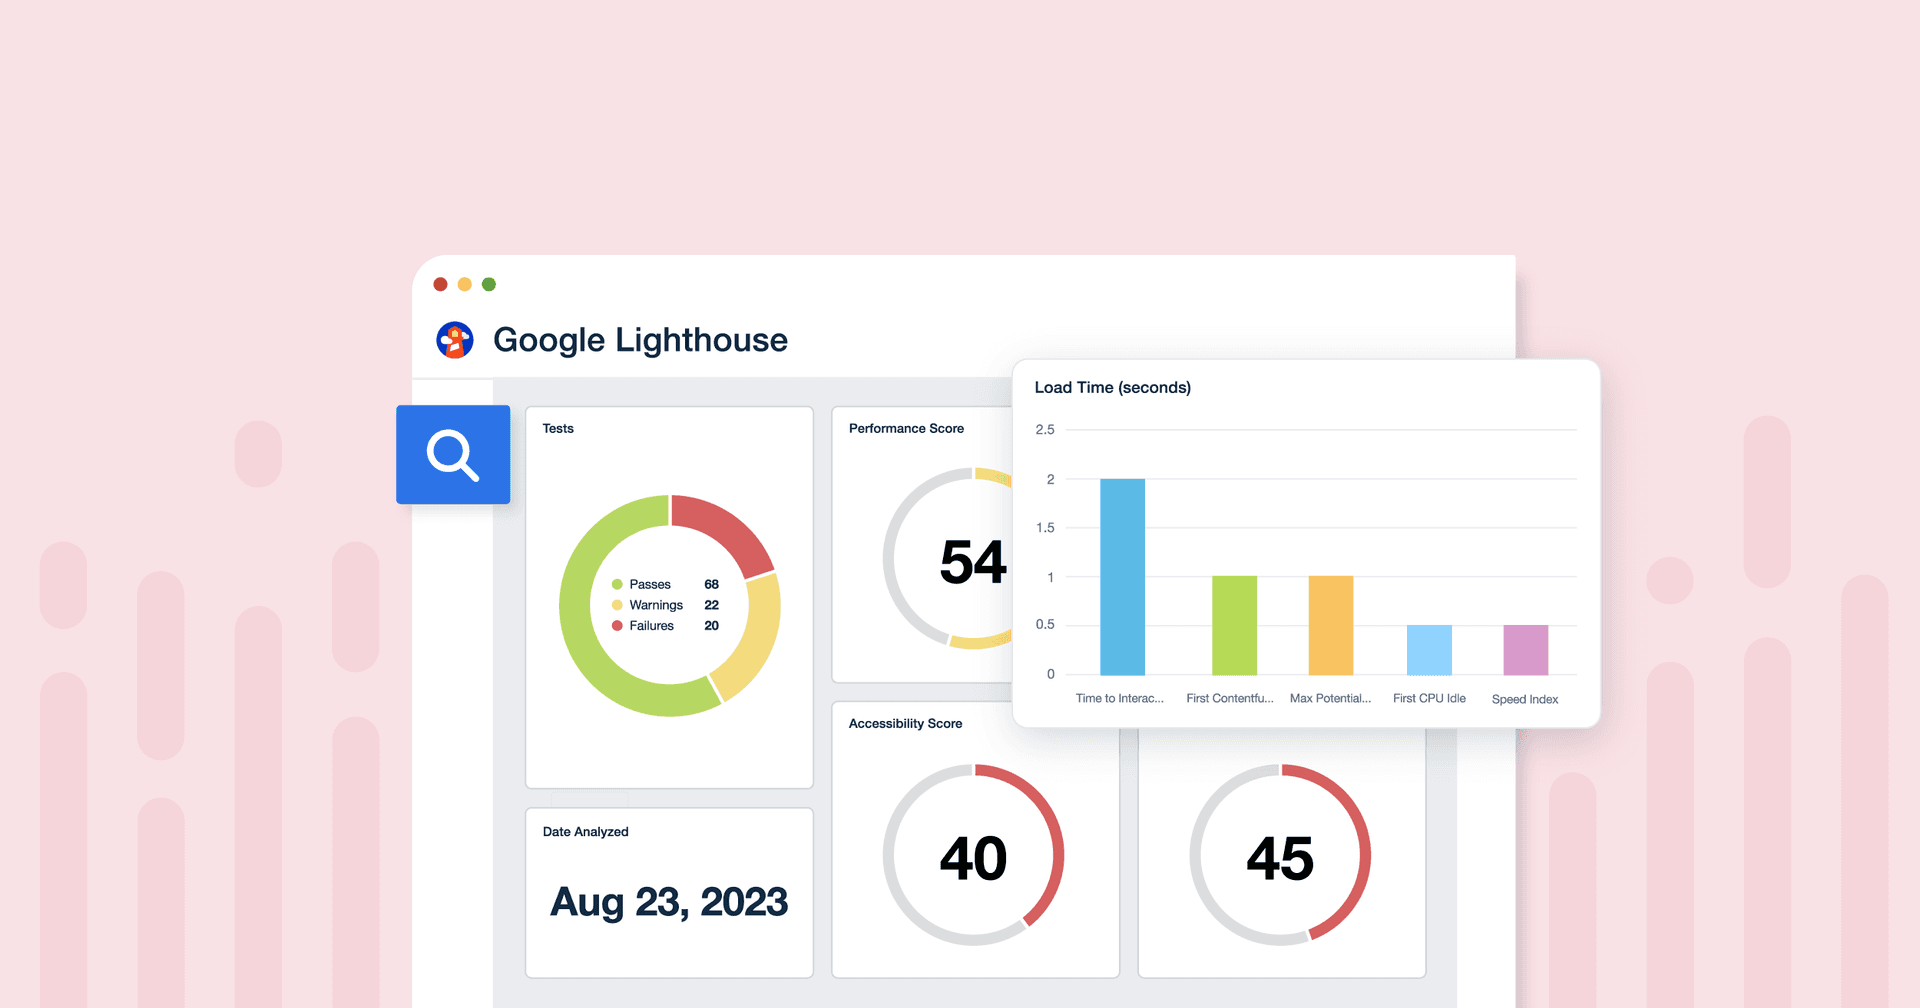
Google Lighthouse Dashboard Example
Related Integrations
How To Improve Time To Interactive (TTI)
Enhancing the speed of user interaction may significantly boost user engagement. Here are some effective strategies to accelerate TTI performance scores.
Optimize Third-Party Scripts
Minimize the impact of third-party scripts by loading them asynchronously. Alternatively, consider deferring their execution.
Refine JavaScript Scripts
Break down Javascript code into smaller, manageable chunks. This prevents long tasks from overwhelming the main thread.
Prioritize Event Handlers
Assign event handlers to critical elements during loading. This ensures early interactivity of visible page elements.
Related Blog Posts
See how 7,000+ marketing agencies help clients win
Free 14-day trial. No credit card required.


