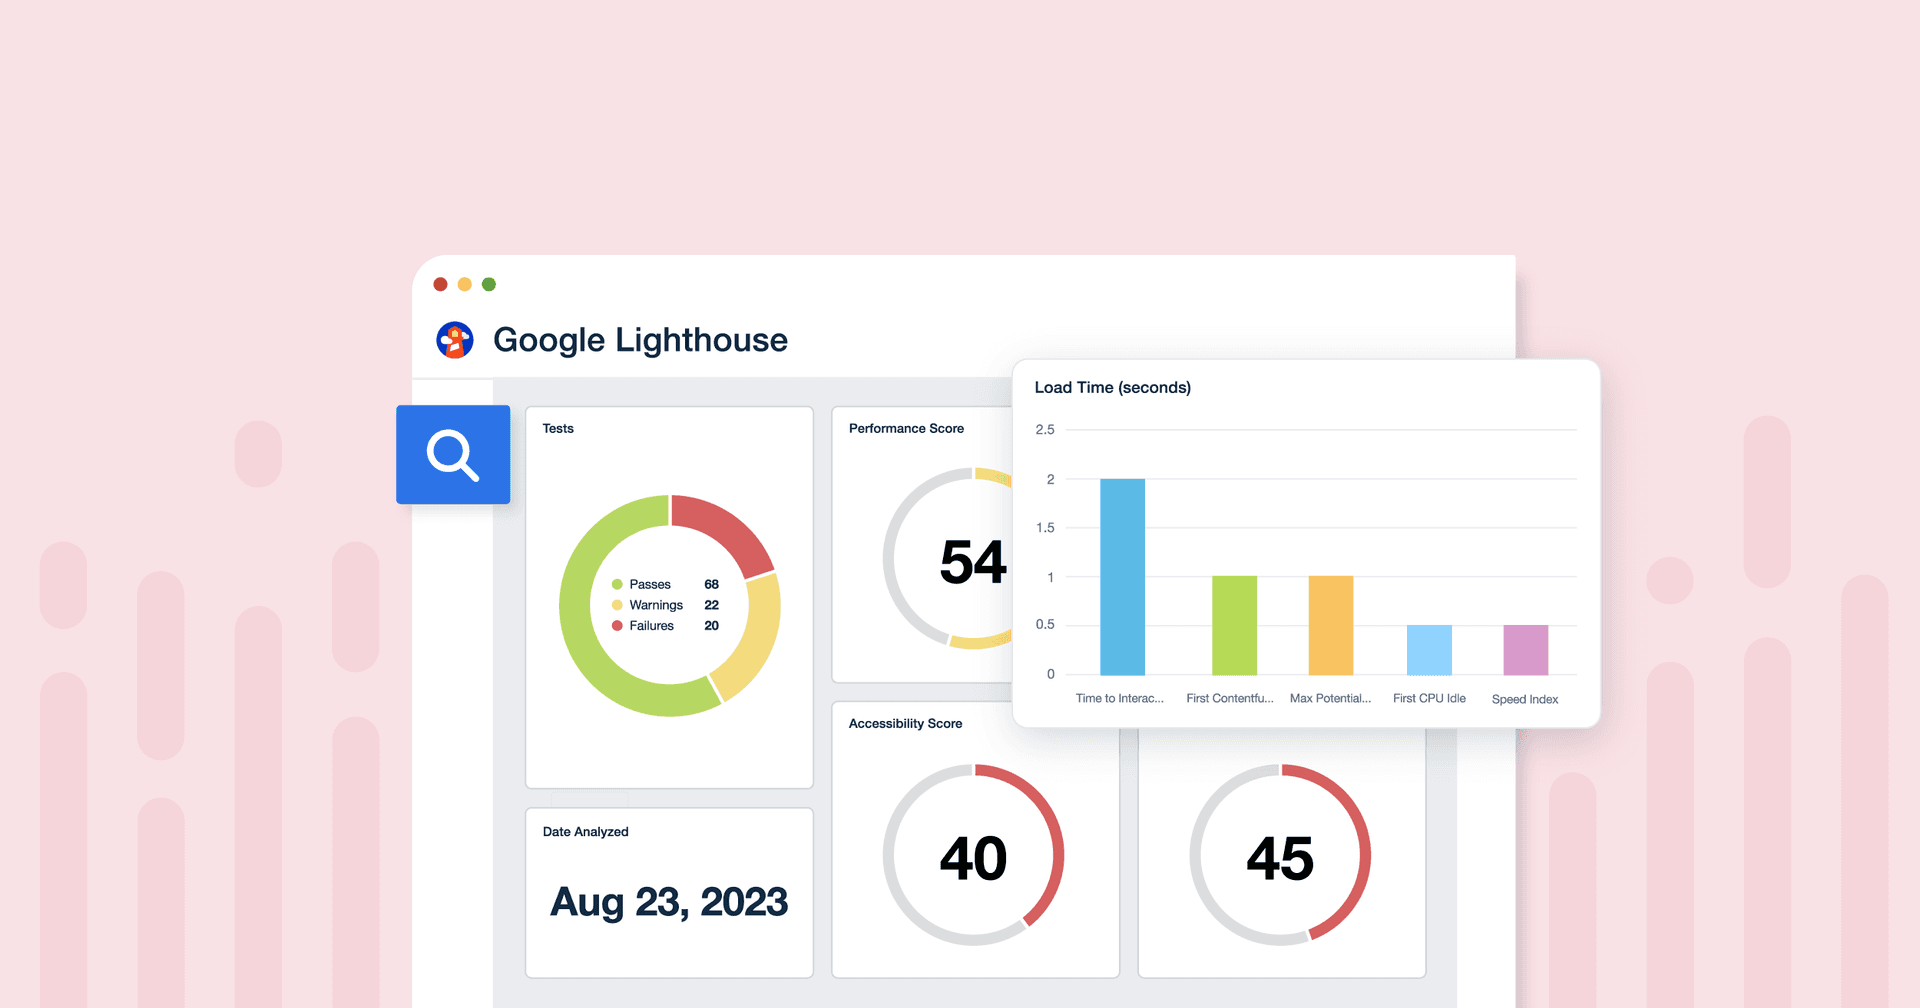
First Input Delay
Enhance User Experience
Analyze FID to improve the overall user experience and ensure smooth website interactions.
Ensure SEO Optimization
Use FID data to enhance search rankings and overall SEO performance.
Benchmark FID Performance
Compare scores against competitors to gauge performance and make improvements.
Link To Conversions
Correlate FID with conversion rates to understand how response time impacts user actions.
Why First Input Delay Is Important
FID is an early indicator of a user's experience and overall satisfaction. A low FID means a website is responsive and engaging from the outset. Even split-second delays lead to frustration. That means a FID score makes all the difference between a user staying or exiting.
Additionally, FID is particularly important for websites that prioritize interactive features. In such contexts, a high FID hampers the user experience and may signal underlying site optimization issues.
FID is all about enhancing site responsiveness and ensuring the seamless loading of website elements. Ultimately, a good FID leads to a more positive user experience.

Stop Wasting Time on Reports. Get Marketing Insights Faster & Drive Results.
How First Input Delay Relates To Other KPIs
FID is closely intertwined with several key performance indicators, such as Page Load Time. If a page takes too long to render in its entirety, it leads to a higher FID and a slower user experience.
Furthermore, FID influences metrics like Bounce Rate and Conversion Rate. A high FID often increases Bounce Rates as users will likely exit unresponsive pages. This leads to a negative impact on Conversion Rates.
Alternatively, a low FID time may enhance Engagement Rate, leading to more interaction and higher conversion opportunities. In essence, FID is a critical metric in understanding and optimizing a website user's journey.

Key Factors Impacting First Input Delay
First Input Delay, a core web vitals metric, is key to measuring the time between user input and browser response. It's a direct measure of input latency, crucial for understanding how quickly a web page will process user input. For example, the complexity of JavaScript code on a page significantly influences the First Input Delay score. Heavier JavaScript blocks the browser's main thread, leading to increased input delays.
Additionally, the type of user interaction plays a role. Whether it’s a click, scroll, or keystroke, the nature of the first user interaction will affect the input delay scores. Pages with complex or numerous elements usually take longer to respond to these interactions.

How To Calculate First Input Delay
Measuring FID means capturing the time difference between a user's first interaction with a page and the browser's response. Considered as one of the top core web vitals metrics, First Input Delay scores are typically recorded in milliseconds. Tracking FID under real-world conditions is essential, as it varies based on different factors like device type and network conditions. Tools like Google's Lighthouse help measure FID automatically.
First Input Delay Formula Example
What Is a Good Time for First Input Delay?
A good FID time is typically under 100 milliseconds from when a user interacts with a web page. This benchmark indicates a responsive and user-friendly website where interactions are processed almost instantaneously.
Achieving a low FID score positively contributes to user experience and engagement. Aim for this range to ensure that users encounter a minimal delay while increasing the likelihood of positive interactions.
What Is a Bad Time for First Input Delay?
A poor FID time is over 300 milliseconds, which means there’s a lag in website responsiveness. This delay often leads to negative user experiences, higher Bounce Rates, and reduced Engagement Rates.
A high FID time should be immediately addressed to improve site performance. Improving FID involves optimizing key elements like JavaScript, server response, and images.
How To Set First Input Delay Benchmarks and Goals
To set benchmarks and goals for FID, start with industry standards–below 100 milliseconds is ideal, and above 300 milliseconds is poor. Analyze historical FID data to establish a realistic baseline, then set incremental goals for gradual improvement (e.g., moving FID from 400ms to 300ms).
Segment FID data by device type, location, and demographics for more custom targets. Also, correlate FID with other KPIs like Conversion Rate to understand its impact on revenue. Over time, continuously monitor and update FID targets to ensure they stay relevant.
Why First Input Delay Matters to Clients
FID is a critical metric that directly impacts the user experience on client websites. Since First Input Delay measures the responsiveness of a page, a low FID is ideal since it indicates a seamless interaction. A smooth, fast-loading website encourages users to stay longer, explore more, and take desired actions (e.g., fulfilling an online purchase).
It’s especially important since any time delay–even a few milliseconds–may lead to lost engagement or revenue.

Why First Input Delay Matters to Agencies
For agencies, a low FID showcases expertise in optimizing website performance. It demonstrates technical proficiency in creating fast and responsive websites. FID is also a useful diagnostic tool to guide technical optimizations, inform content strategies, and uncover other areas for improvement. Optimizing FID helps agencies to drive more traffic while setting the stage for meaningful user interactions. This leads to more tangible results and builds agency-client relationships in the process.

Save Time and Money by Automating Your Client Reporting
Best Practices When Analyzing and Reporting on First Input Delay
Effective reporting on FID is necessary for understanding website performance–here are a few best practices to follow.
Segment by Device Type
Differentiate FID data across mobile devices, tablets, and desktops. Use this to understand how the website performs on various platforms.
Incorporate User Feedback
Combine quantitative FID data with qualitative user feedback to gain a comprehensive view of the user experience.
Include Geographic Segmentation
Break down FID by region to identify location-specific performance issues. FID discrepancies could be tied to server locations or local internet speeds.
Analyze Impact on Key User Journeys
Focus on how FID affects critical user paths, such as the checkout process or sign-up flows.
Highlight Correlation With Conversion Rates
Draw connections between FID improvements and changes in Conversion Rates. This approach shows the impact of a responsive site.
Recommend Actions for FID Enhancement
Offer clear, practical steps for improving FID times (e.g., optimizing image sizes or changing servers).
AgencyAnalytics helps us make informed, data-driven decisions about website performance by providing us with real-time data and analytics. This allows us to optimize our strategies and tactics more effectively, leading to better results for our clients and agency.
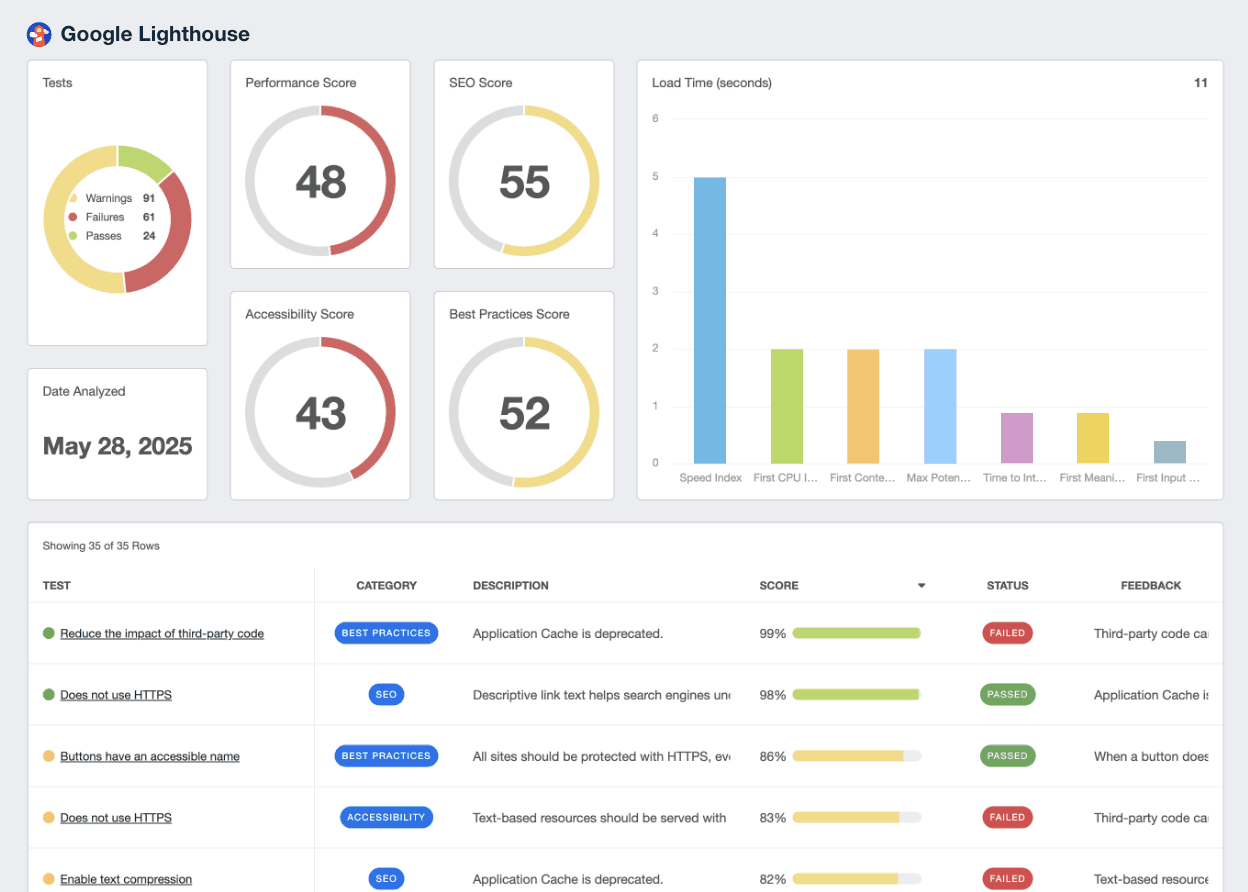
Google Lighthouse Dashboard Example
Related Integrations
How To Improve First Input Delay
Enhancing FID is crucial for a better user experience and website performance–here are three targeted strategies to adopt.
Optimize Server Response
Improve server response times by revisiting configurations, using efficient database queries, and implementing caching.
Remove Unnecessary Scripts
Evaluate and remove non-essential third-party scripts that significantly slow down website response times.
Implement Lazy Loading
Utilize lazy loading for images and non-critical content. This ensures that these elements are loaded only when needed.
Related Blog Posts
See how 7,000+ marketing agencies help clients win
Free 14-day trial. No credit card required.


