Table of Contents
QUICK SUMMARY:
Google Lighthouse metrics offer key insights into website quality, focusing on performance, accessibility, and SEO. As an open-source tool, it provides comprehensive audits, identifying technical areas for improvement. This leads to faster loading, better accessibility, and higher SERP rankings. Learn to optimize website performance using Google Lighthouse's actionable metrics, essential for client success.
A millisecond might seem like such a short amount of time that it’s inconsequential. But for every 100 milliseconds a website takes to load, the conversion rate can drop by 7%.
If you want your agency to not only survive, but to thrive, you need to make sure your clients’ websites are as optimized and healthy as possible—performing to the best of their ability as users try to navigate. That’s where Google Lighthouse metrics come in.
In our guide to Google Lighthouse metrics, you’ll learn about the website metrics and performance data you should be tracking to help your clients’ sites perform better. We’ll explain concepts like Interaction to Next Paint, Largest Contentful Paint, and others, sharing what’s considered a “good” score in each of these categories and how you will use these metrics to improve.
Let’s get started breaking down the Google Lighthouse website metrics you should be analyzing to help improve your clients’ website performance.
What is Google Lighthouse?
Google Lighthouse is an open-source, automated tool that measures the quality of a web page. Use Google Lighthouse audits to gauge a website’s performance and audit progressive web apps, getting personalized insights on how to improve user experience.
With this tool, your agency learns what technical changes should be made to help your clients’ websites load more quickly, be more accessible, and rank higher in search engine results pages (SERPs)—which will all result in more people finding the website, and those people staying on the site for longer once they do.
Google Lighthouse works for any web page—public or private. It’s free and easy to use, and offers helpful metrics (Core Web Vitals) to assess site performance and figure out which areas need to improve.
Google Lighthouse vs. Core Web Vitals
Google Lighthouse uses three specific metrics to measure website performance. These Core Web Vitals are:
Largest Contentful Paint (LCP). This metric uses LCP data to measure how a website visitor perceives the page loading experience (how quickly the largest image or text block shows up).
Interaction to Next Paint (INP). Think of INP as a website’s responsiveness to user input. It measures the time it takes for the page to respond across all interactions, replacing the now-retired First Input Delay (FID).
Cumulative Layout Shift. The third and final Core Web Vital looks at how web page elements move, to measure how visually stable the page appears.
When you receive the Google Lighthouse performance score, these vitals will be included. Together, they make up 70% of the weighted performance score.
Today, people embrace companies with customer experiences that best meet their needs. Our focus is heavily centered around user experience across all digital channels and developing relationships with our clients’ customers.
Kim Meissenheimer, Ads Specialist, Expand Agency
What you need to know about the Google Lighthouse scoring system
Running an audit on Google Lighthouse will result in an overall performance score. Here’s how the scoring system works.
What Is the Lighthouse Performance Score?
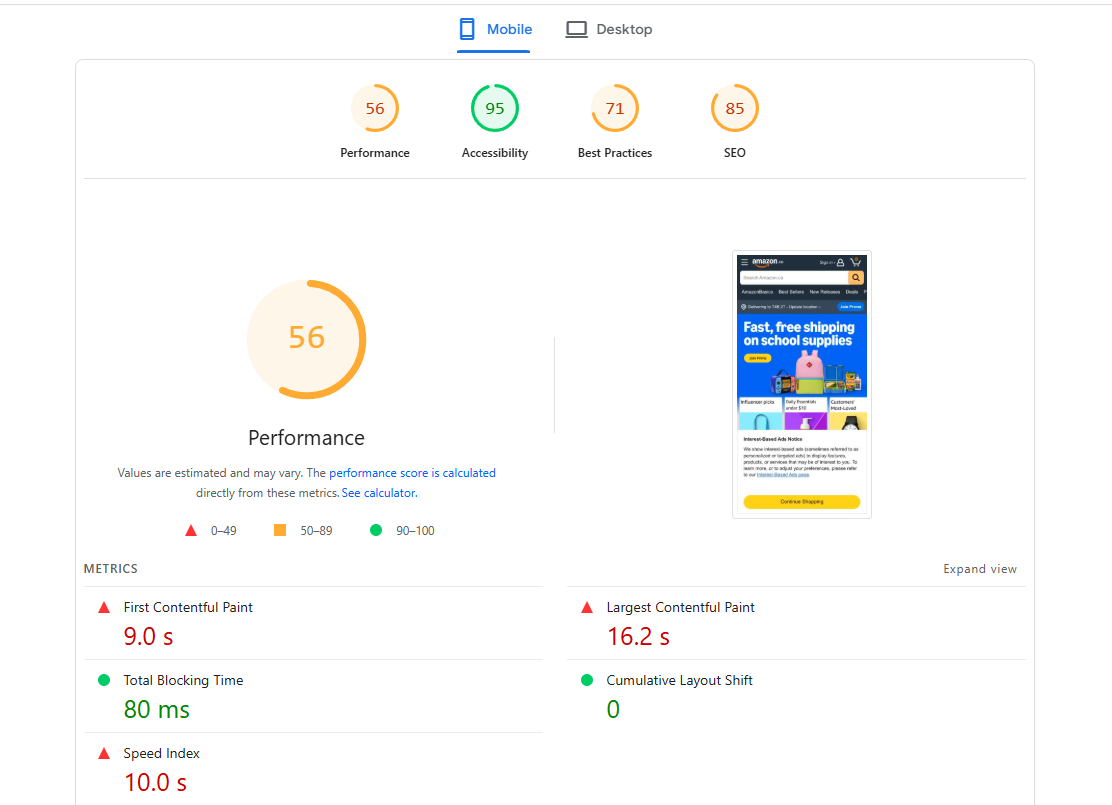
Google Lighthouse uses a scoring system to evaluate a website and provide a rating from 0 to 100. To create this rating, the tool considers different web performance metrics or categories and adds them up:
Largest Contentful Paint (LCP)
Total Blocking Time (TBT)
The higher the score, the healthier and more effective the website. A good Google Lighthouse score is anything above 90.
Why Lighthouse scores fluctuate
You might notice that a client's Lighthouse report score changes over time. Google might give you a different number each time you test the site. This is normal—don’t worry! There are several factors that can affect the score on any given day, including:
Server response times
Network conditions
Browser extensions
Web page ads
Page customizations like AB tests
Network data routes
The length, time, and location of the test
How powerful the CPU is
Different Lighthouse versions or settings
It’s natural to see some variability in a Lighthouse score.
Google Lighthouse desktop vs. mobile
You might also notice that you receive a different performance rating if you run the test on the desktop vs. the mobile version of your client’s website. Again, don’t panic! It’s common for mobile scores to come back lower. This might be because the mobile device has a slower processor or weaker connection than a desktop computer.
Google Lighthouse performance metrics explained
There are several different metrics that go into the total Google Lighthouse score. It can be confusing to think about how a score is calculated. Factors like accessibility, performance, and SEO all play a role. Take a look at the individual website performance metrics Google uses to build the overall final score.
How is the lighthouse performance score calculated?
Google calculates the Lighthouse performance score using a weighted average of different metrics. Each of these metrics indicates a different aspect of the web application page load speed and responsiveness. Google gives each metric a weight. Then you receive the final score, which will be a number between 0-100 (the higher, the better).
Performance audit
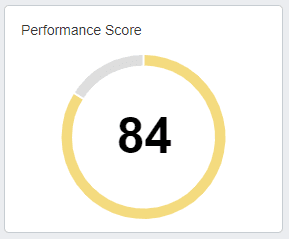
The performance audit portion of the overall Google Lighthouse audit indicates how healthy your client's website performance is. The score is an aggregate based on a number of the page-level metrics we’ve listed above.
As of the latest Lighthouse version (v12), the weighted metrics are:
First Contentful Paint (10%)
Speed Index (10%)
Largest Contentful Paint (25%)
Total Blocking Time (30%)
Cumulative Layout Shift (25%).
Note that Time to Interactive (TTI) is no longer included in the score calculation. The closer the score is to 100, the better.
Broken or missing internal links or lack of a plan for sharing are some pretty standard issues across all industries. Everything should always be tested, shared, and tracked for traffic, backlinks, social stats, and lead conversions.
Kristen Ewen, Director of SEO, Property Manager Websites
Accessibility audit
As part of a Google Lighthouse audit, you’ll receive an accessibility score for the client's website. This gives you an idea of how easy or difficult it is for users with different abilities to access and use the site.
We do our best to start with accessibility considerations from the beginning of a project. We intentionally use elements that are more accessibility-friendly and avoid elements that can be problematic for people using assistive technology. We believe that it is easier to build a site with accessibility, speed, and SEO in mind than try to retrofit a site for accessibility later on.
Josiah Bussing, CEO, Mountaintop Web Design
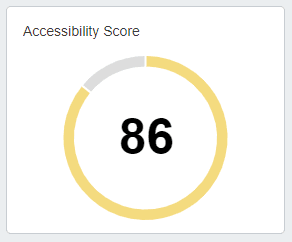
A perfect 100 is your goal for the Lighthouse accessibility score. It may be a lofty goal, but accessibility is crucial. Scores above 90 mean the site is very accessible, but anything below 90 requires some investigation and fixes.
A few examples of ways to improve website accessibility include:
Add alt text to images
Use headings and subheadings correctly
Add labels to form fields
Use large size fonts
Make sure pages have enough color contrast
Caption videos and provide a transcript
Use accessible JavaScript widgets
Best Practices audit
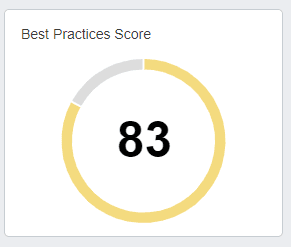
Google Lighthouse runs a Best Practices audit to make sure you’re using web development best practices to improve the user experience. Ideally, you want to receive a 100 in this category, but at a minimum this score should be above 80.
SEO audit
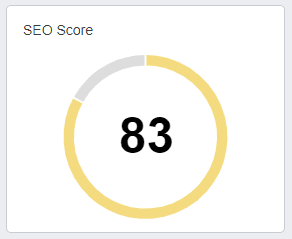
Factors that play into the Lighthouse SEO score include whether:
Web pages are mobile-friendly
There are title and meta description tags, plus image alt text
The page has a valid structured data and valid hreflang attribute
The page is indexable
Internal links are crawlable
The page has a valid “rel=canonical” tag set
The page is returning HTTP 200 (OK) status response code
The page has a viewport meta tag with width or initial-scale set
Progressive Web App (PWA) audit
The Lighthouse Progressive Web Audit (PWA) tests whether a web page is using modern web capabilities to deliver a good user experience. For example, the page should be mobile-friendly and use best practices such as redirecting HTTP traffic to HTTPS.
Impress clients and save hours with custom, automated reporting.
Join 7,000+ agencies that create reports in minutes instead of hours using AgencyAnalytics. Get started for free. No credit card required.
6 key Google Lighthouse metrics to track
Take a look at the six important page load metrics that Google Lighthouse helps you track.
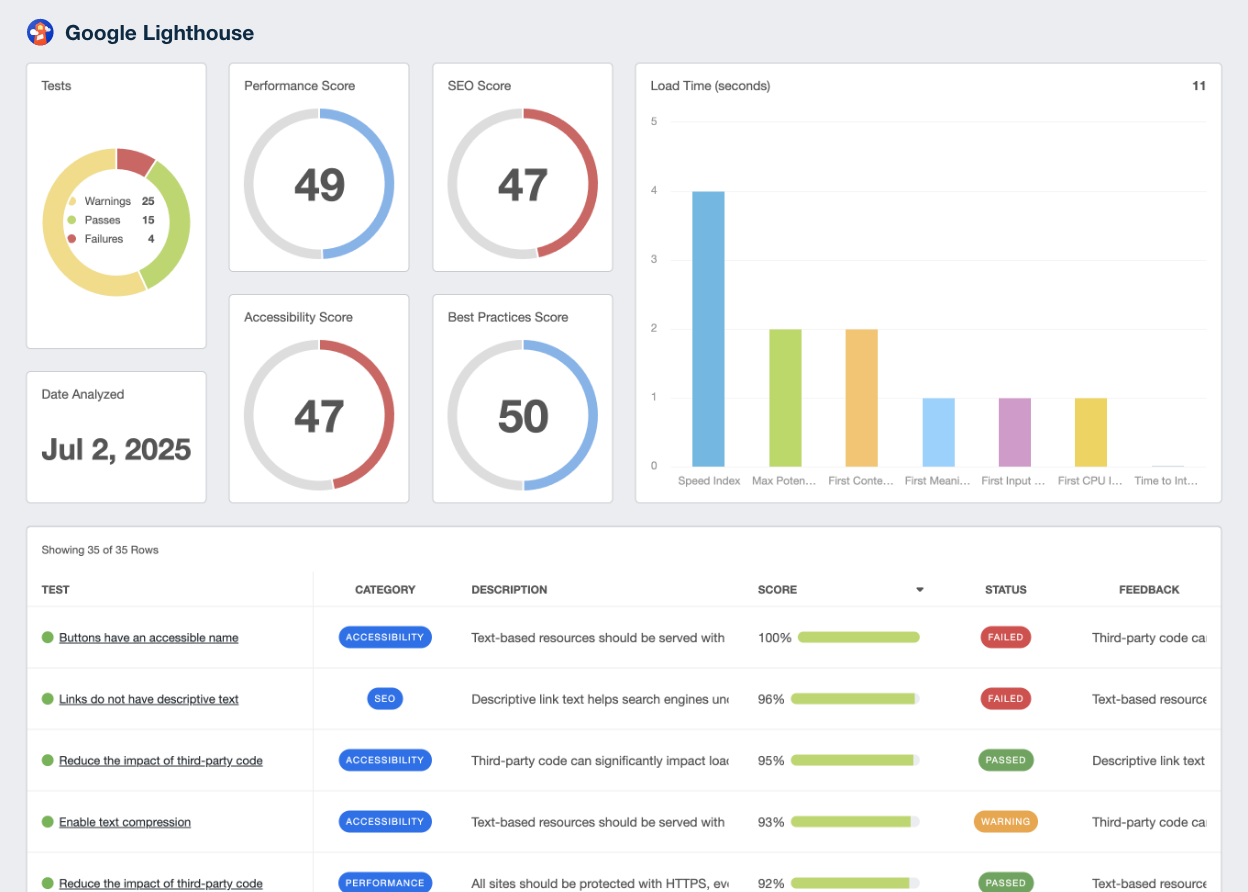
Use this template to track your client's top Google Lighthouse metrics quickly and easily. Try AgencyAnalytics free for 14 days!
First Contentful Paint (FCP)
This Google Lighthouse Metric shows how quickly the first text or image loads on your client’s site—the time until a user can see anything on the screen. A good FCP is anything under two seconds.
Why First Contentful Paint Matters to Clients Imagine that your agency launched a successful PPC campaign that’s driving major traffic to your client’s ecommerce website. But when consumers reach the site, they have to sit for 20 seconds before the main hero image appears. That’s critical time that could drive customers away—and that’s why FCP matters.
Speed Index (SI)
The speed index shows how quickly a web page’s contents are visibly populated. You want the speed index time to be under 4.3 seconds.
Why Speed Index Matters to Clients If a client’s website is slow to load, consumers won’t sit around and wait for long. The website needs to populate its visual elements as quickly as possible to grab and retain visitor attention.
Largest Contentful Paint (LCP)
LCP is the time it takes for the largest element on the site to show up. Ideally, you want this to be 2.5 seconds or less.
Why Largest Contentful Paint Matters to Clients LCP is important because it also affects user experience. People are visiting a website because they want to interact with it. Again, if that website doesn’t load quickly, they aren’t going to stay.
Time to Interactive (TTI)
Time to Interactive (TTI) also measures load responsiveness. This metric shows how soon a web page becomes fully responsive after a visitor arrives.
Why Time to Interactive Matters to Clients Ideally, a webpage should respond to user input within 50 milliseconds. This is simply another metric that keeps users engaged with and interested in your client’s website rather than a competitor’s.
Total Blocking Time (TBT)
Total Blocking Time indicates the amount of time a page is blocked from responding to user input. Look for a TBT that’s less than 300 milliseconds.
Why Total Blocking Time Matters to Clients TBT indicates whether a webpage is usable. If a consumer can’t quickly complete an action on your client’s website, conversions will suffer.
Cumulative Layout Shift (CLS)
Finally, this metric measures the visual stability of a web page, scoring how often users might see unexpected movement. The CLS score should be 0.1 or less.
Why Cumulative Layout Shift Matters to Clients Have you ever been scrolling an eCommerce page, about to click “buy” on an item, when the whole page shifts and you lose your place? If customers have to re-orient themselves several times on your client’s site before clicking “add to cart”, they’re likely to leave without a purchase.
How to use Google Lighthouse
Don’t let the technical jargon scare you away. Google Lighthouse is actually very straightforward to use. You can install Lighthouse as a Chrome browser extension or use the Chrome DevTools workflow. Or use Lighthouse from the command line with shell scripts, as a Node module, or from a web UI. From there, you’ll pull a Lighthouse report to understand the results.
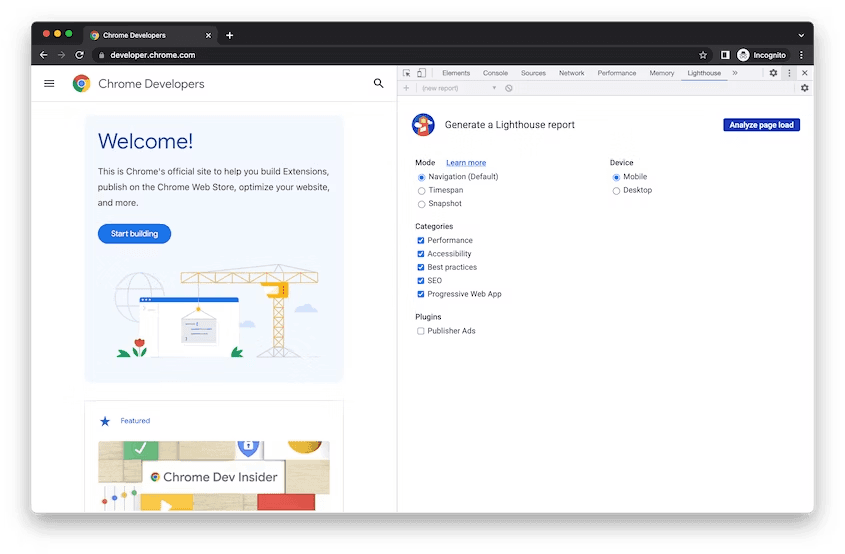
Chrome DevTools
Google recommends using Lighthouse with Chrome DevTools rather than using the Lighthouse browser extension.
This allows you to test local sites and authenticated pages. Here are the steps you’ll need to take:
Download Google Chrome for Desktop.
Open the Chrome browser and go to the URL you want to audit.
Open Chrome DevTools and click the Lighthouse panel.
Click Analyze Page Load.
Click Run Audit.
In 30-60 seconds, you’ll receive a report on the page that includes an overall performance score as well as each relevant metric broken down.
Using Lighthouse With Chrome extension
If you do decide to use the browser extension for Google Lighthouse, here’s how to do it (you’ll obviously need to have the Chrome browser installed):
Install the Lighthouse Chrome Extension from the Chrome web store.
Open the Chrome browser and go to the URL you want to audit.
Click the small red lighthouse icon next to the address bar (this can also be found in the Chrome extension menu).
Click Generate Report.
The results will open in a new tab.
PageSpeed Insights
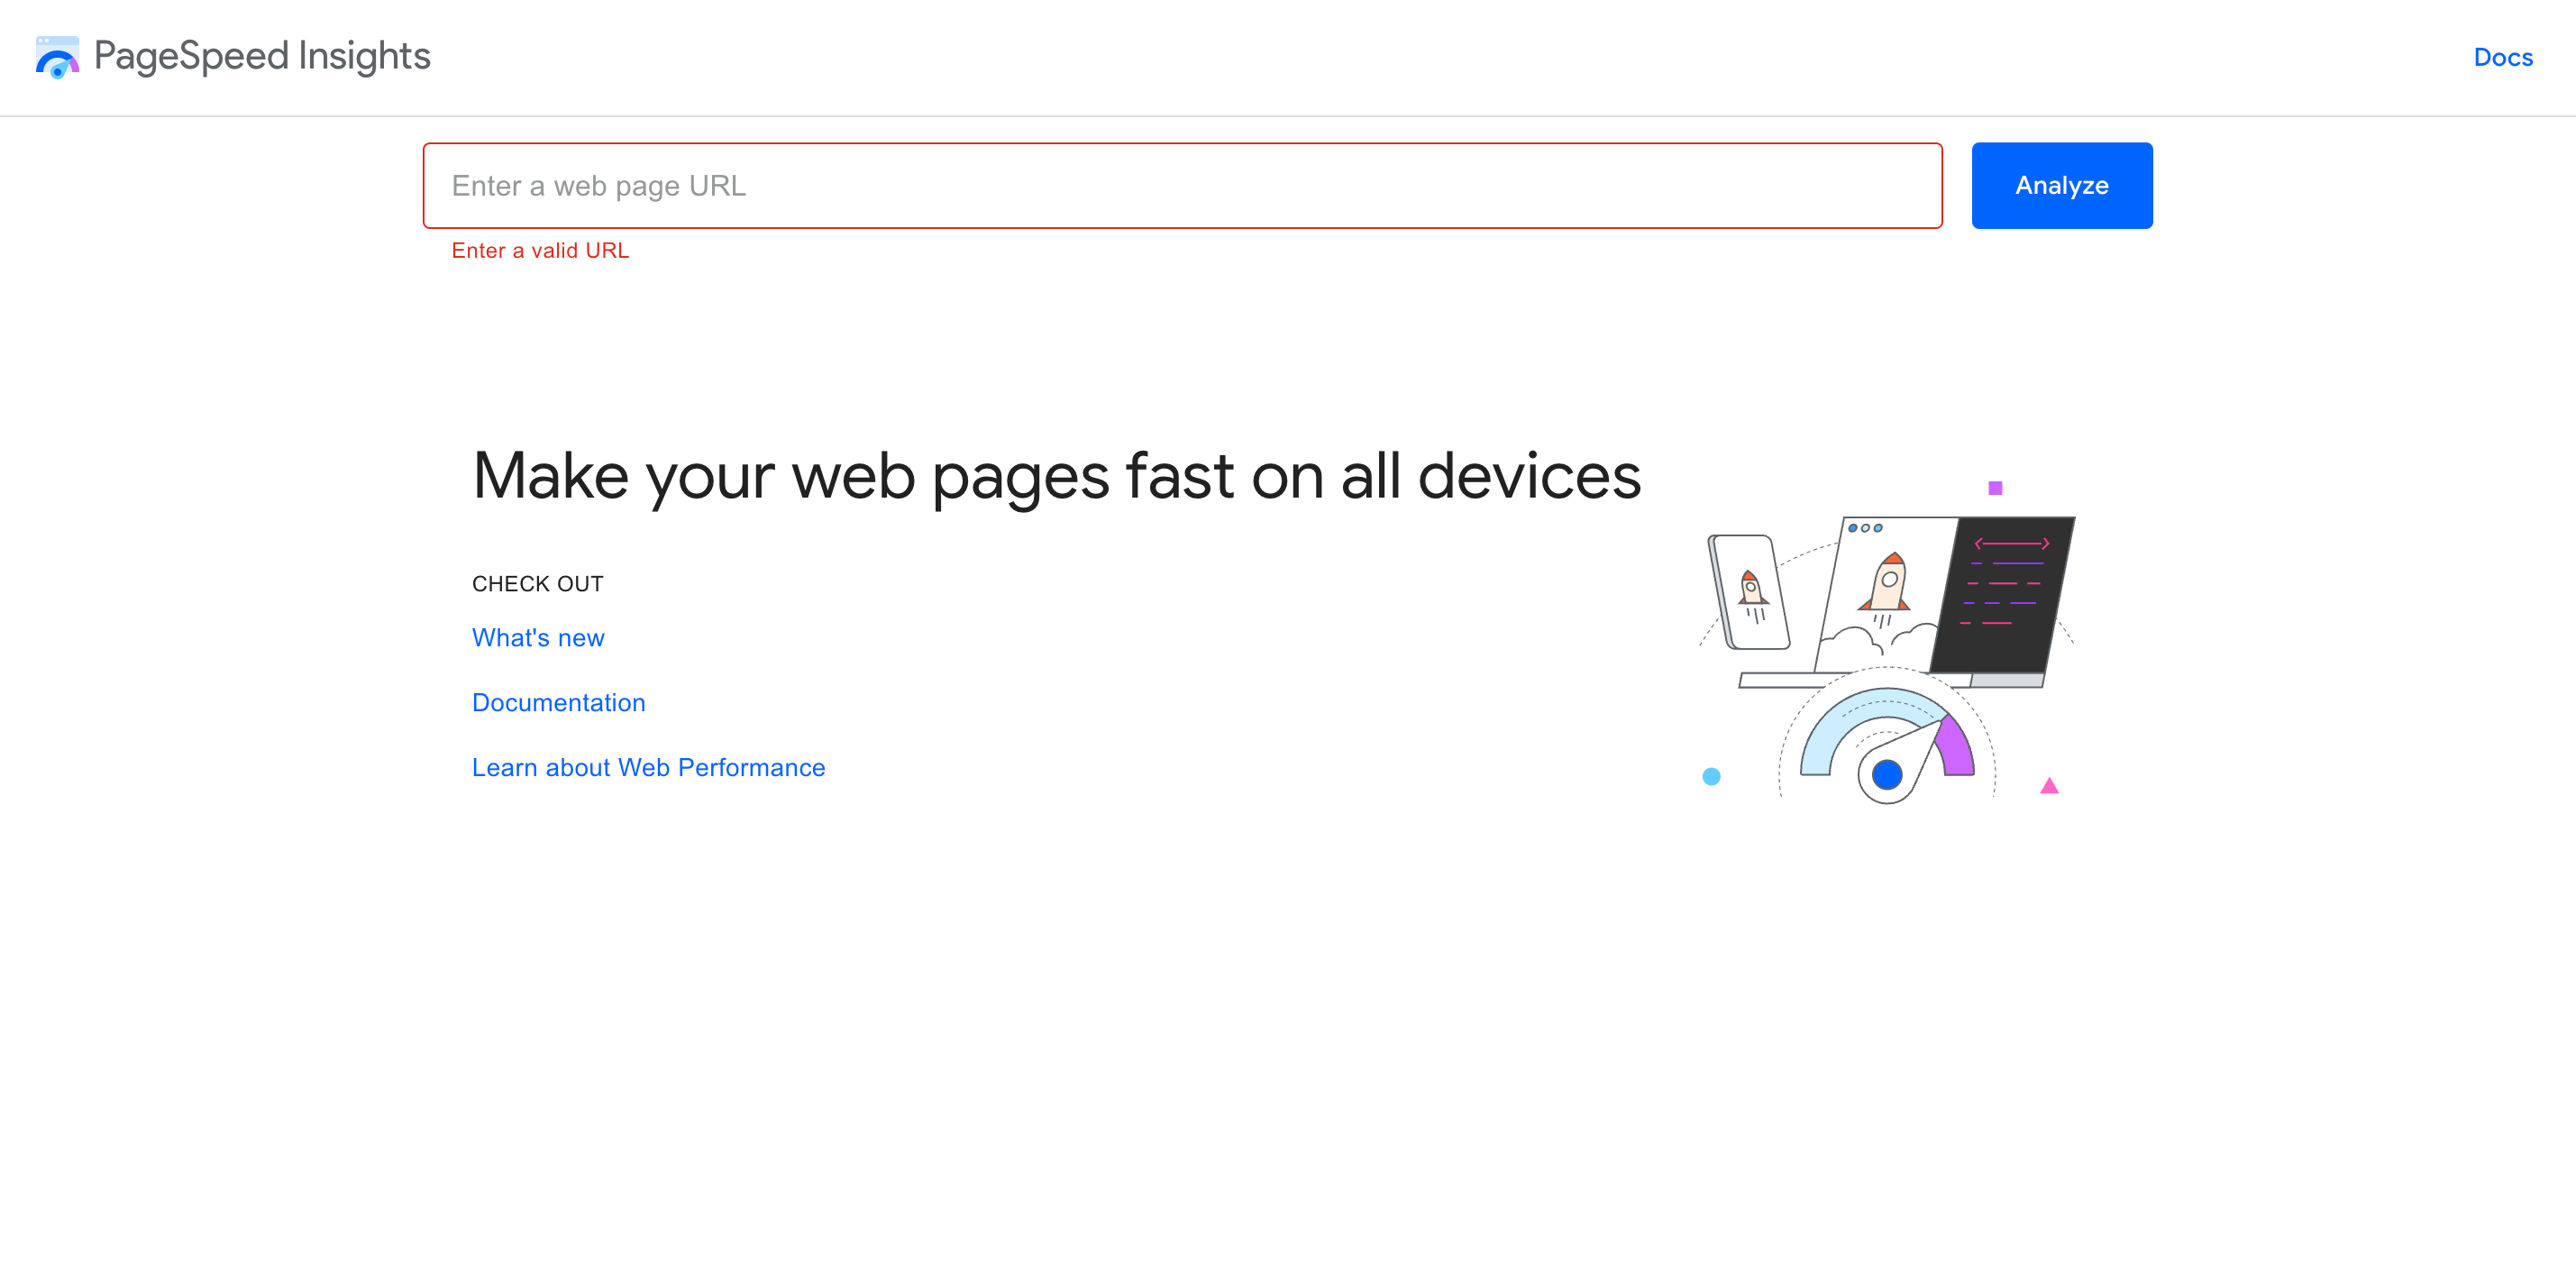
You can also use Google Lighthouse via the Google tool PageSpeed Insights.
To get started:
Go to PageSpeed Insights.
Type or paste a URL.
Click Analyze.
It's also handy to use a separate PageSpeed integration to view this data alongside other marketing metrics.
GTmetrix
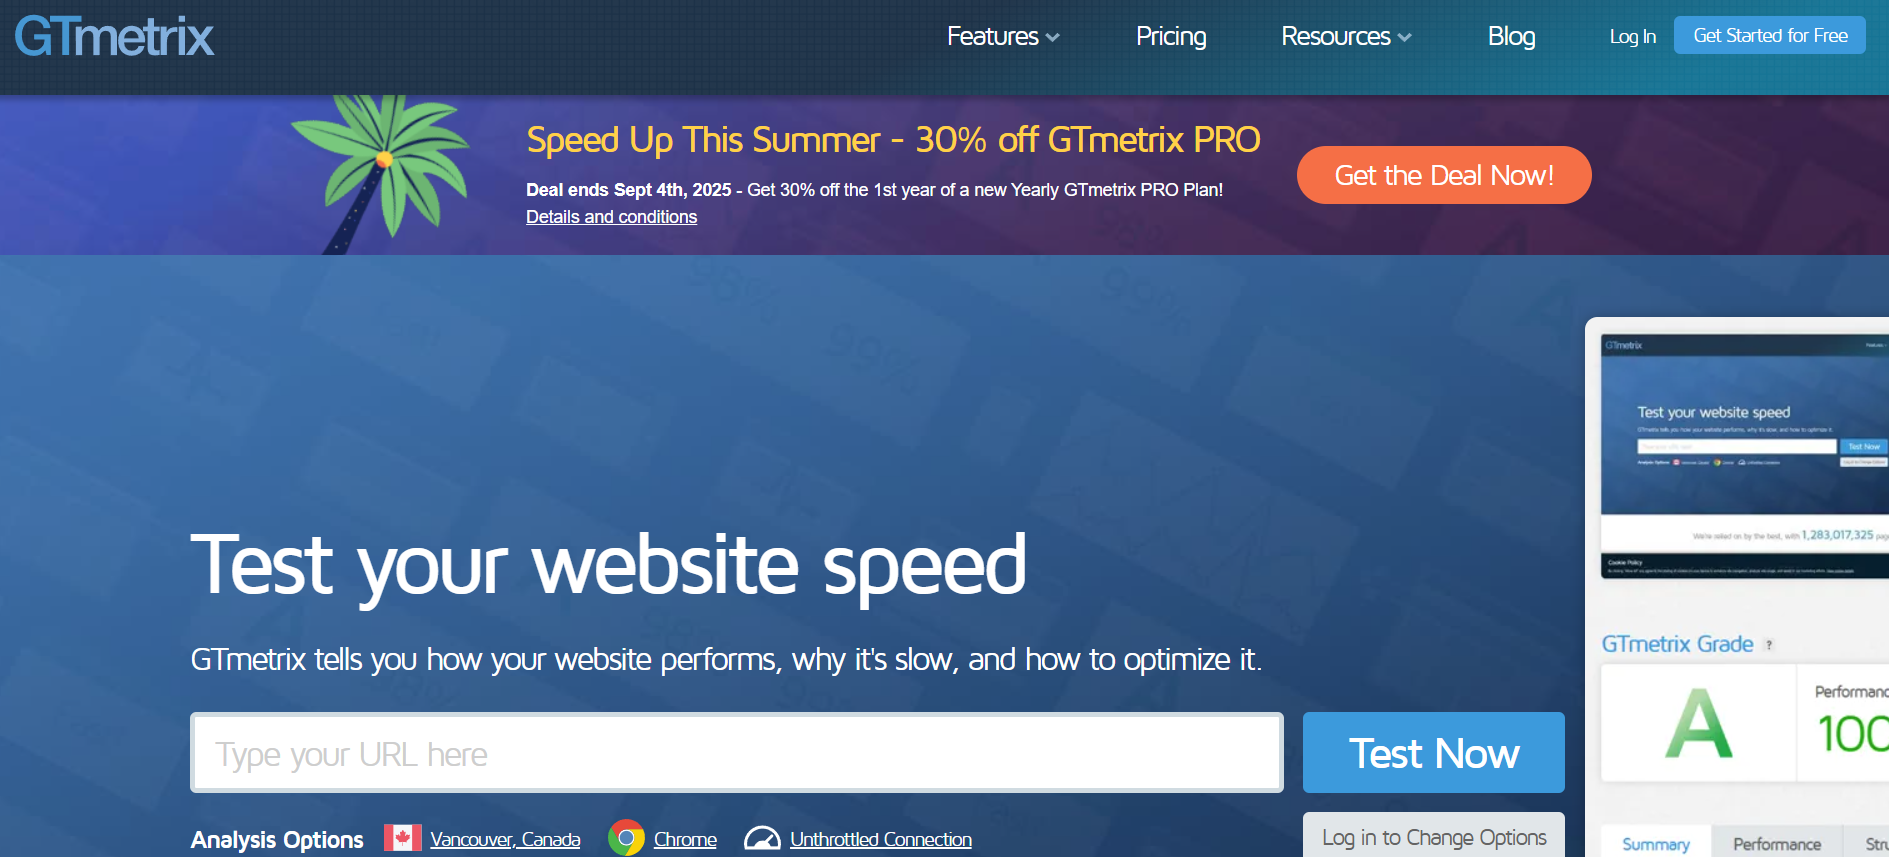
GTmetrix is another free, popular performance tool that uses the Google Lighthouse performance score to help analyze a website’s performance. Also, use this tool to test a site from different locations—helping you figure out, for example, how quickly a website loads for a user in Vancouver, Canada vs. Paris, France.
Here’s how:
In GTmetrix, type or paste the URL you want to test and click "Test Your Site."
GTMetrix will give you a performance grade that includes Core Web Vitals.
Click through different tabs to see details like the full Lighthouse metrics in a Lighthouse report, or how well a site has performed over time.
AgencyAnalytics
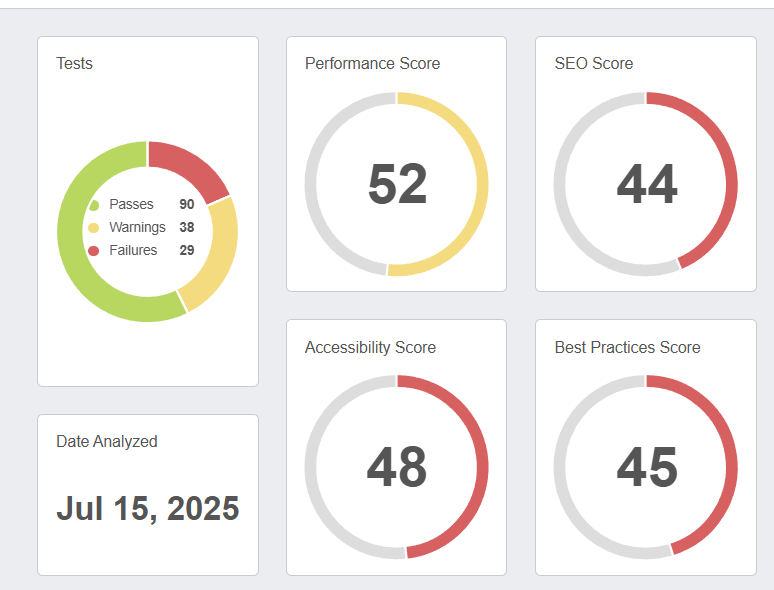
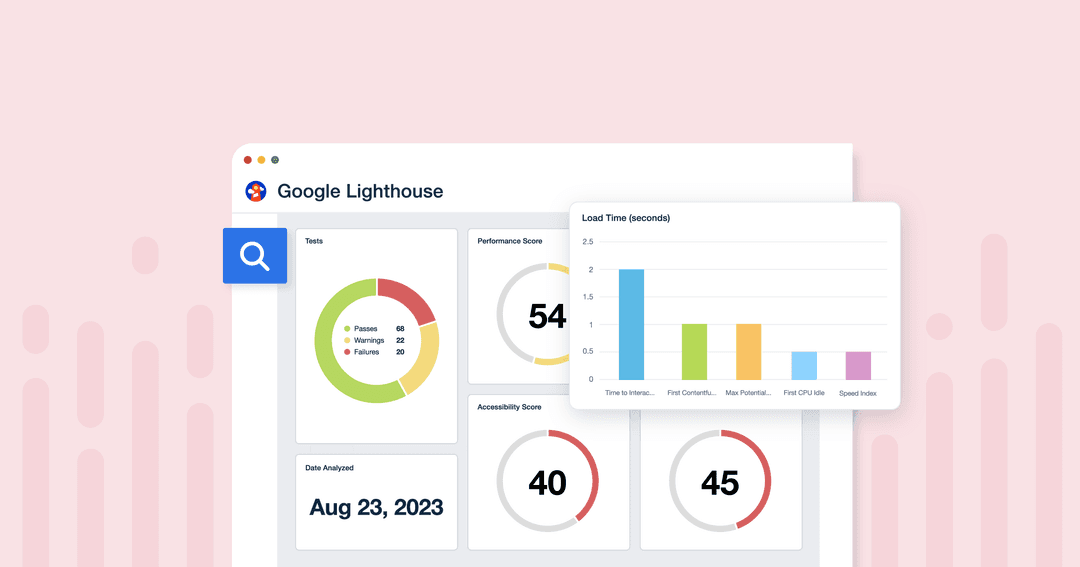
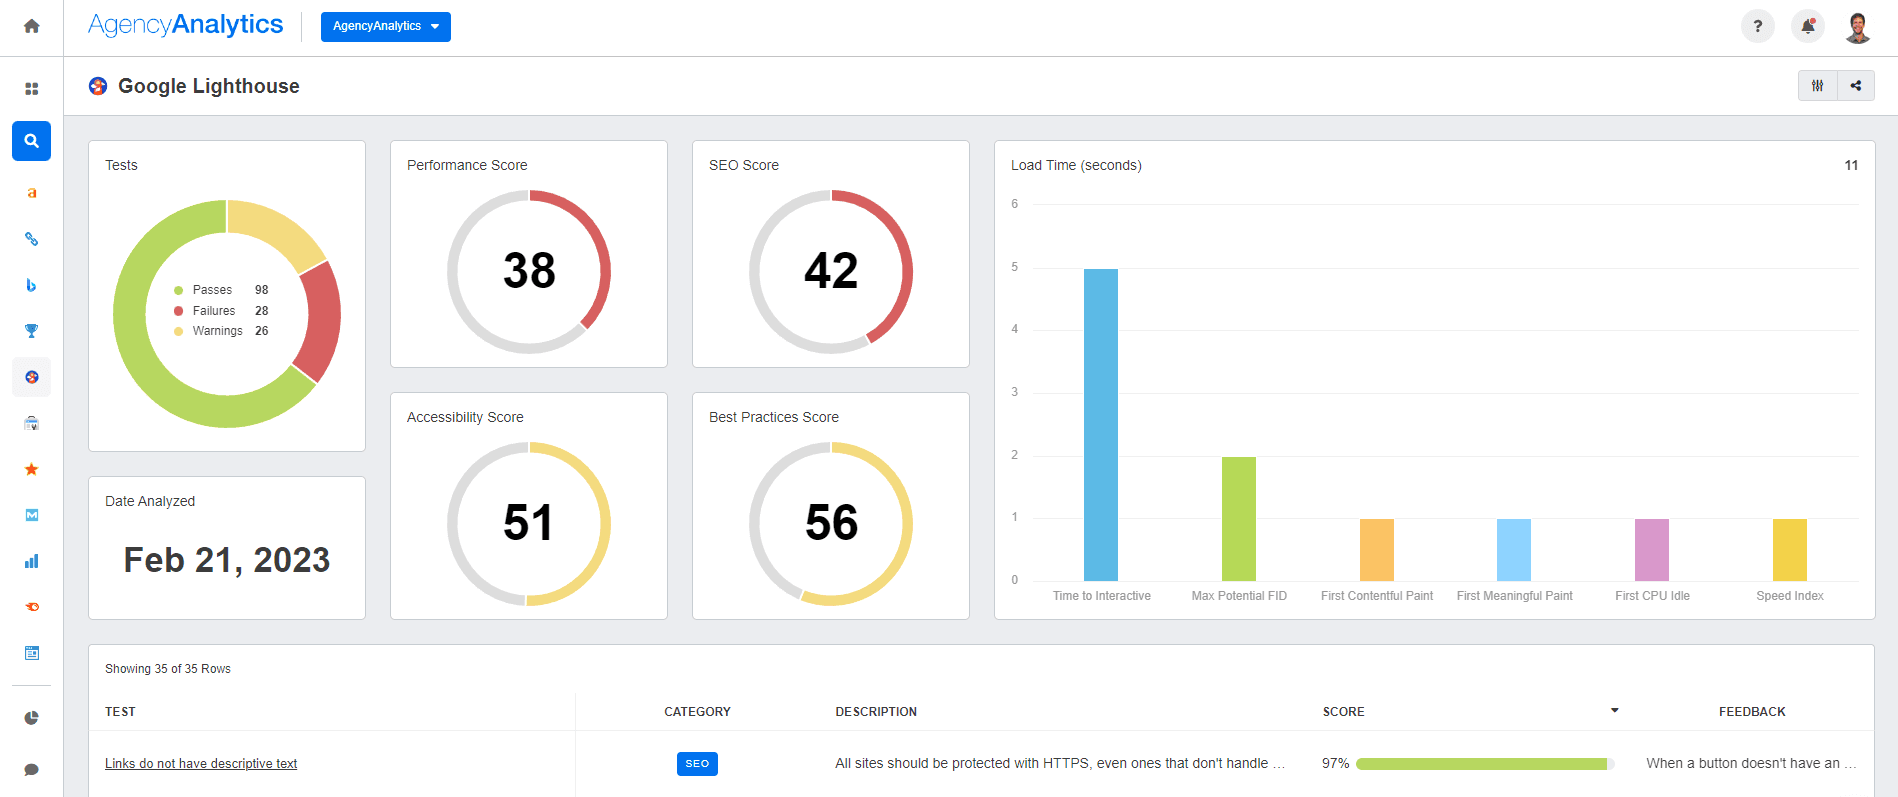
AgencyAnalytics allows you to generate Lighthouse audits and reports directly from a campaign. By using the AgencyAnalytics platform to create this report, easily share custom white labeled reports directly with your client. Use visuals to make the data easier to digest and to see the most important information at a glance. Add personalized annotations and trackable goals to each report.
We found our clients needed a nice visual report to look at where they could clearly see the improvements in both traffic and keyword rankings each month. AgencyAnalytics offered the best solution in terms of an easy-to-understand report.
Guy Hudson, Founder, Bespoke Marketing Plans
Here’s how:
Open the client's account.
Click "Data Sources" on the left-hand menu
Search Google Lighthouse and connect the integration.
AgencyAnalytics will automatically scan the campaign’s URL
Re-scan the URL anytime using the blue Perform Audit button on the Google Lighthouse dashboard to run further Google Lighthouse audits.
Start sharing critical web page performance insights with your clients, alongside data from more than 80 marketing integrations. Start your free 14-day trial with AgencyAnalytics today.
How to analyze the Lighthouse performance report
Once you’ve generated Lighthouse reports, the next step is to analyze the information you’ve received.
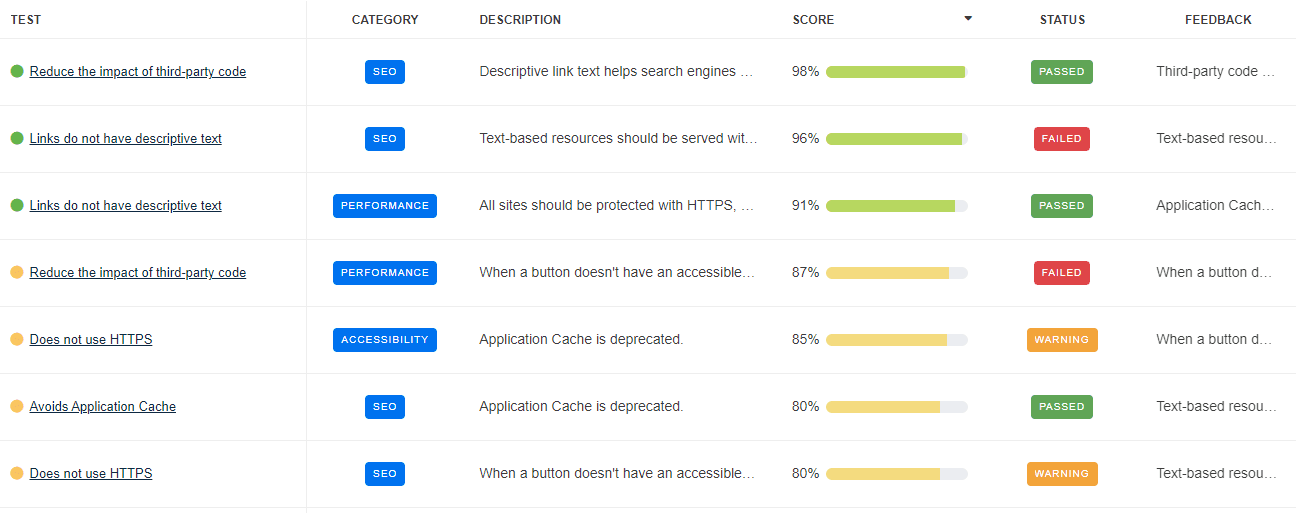
When you conduct a Google Lighthouse audit through AgencyAnalytics, you’ll see the results broken down into three key sections:
Passed audits (90 or above — meeting the Google Lighthouse standard).
Audits to improve (50-89).
Failed audits (below 50).
Read through the results carefully to understand the actions necessary to improve the website performance score. For example, if your client’s website has a poor First Contentful Paint score, improve this by removing unused CSS and JavaScript or eliminating render-blocking resources. A Total Blocking Time that’s too high might call for reducing the impact of third-party code and JavaScript execution time.
Next, create a dashboard or report for your client using AgencyAnalytics to present an overview of their website performance.
The SEO Audit Report clearly shows prospects which areas of their website are lacking, and I can articulate how I would go about correcting any issues.
Adam Allen, CEO, LeaseMyMarketing
Join more than 7,000 marketing agency customers and create in-depth, white labeled marketing reports in just a few clicks. Start your free 14-day trial with AgencyAnalytics today.
Takeaway
Great digital agencies know that while a gorgeous website design is a critical component in enhancing user experience online, it only achieves results if the site loads quickly and makes it easy for visitors to find what they’re looking for. In this sense, Google Lighthouse is an invaluable tool to improve SEO on your clients’ websites.
The simplest way to access and analyze Lighthouse metrics? AgencyAnalytics. Generate a full Lighthouse performance report in just a few clicks, visualizing the data in a format that your clients will understand.

Written by
Hailey is a full-time writer and content marketer based in Atlanta who specializes in providing unique insights into the worlds of wellness and digital marketing. A storyteller at heart, she is a self-admitted nerd about all things digital.
Read more posts by Hailey HudsonSee how 7,000+ marketing agencies help clients win
Free 14-day trial. No credit card required.


