Performance Score
Speed Check
Uses this Lighthouse Score to measure how fast a page loads.
SEO Review
Evaluate whether a page is correctly set up for visibility on search engines.
User Friendliness
Assess whether the site is easy to navigate, especially on mobile devices.
Spot Fixes
Identify what needs to be improved to boost the overall Performance Score.
Why Performance Score Is Important
This Google Lighthouse score shows how well a website works and how it may influence a user’s perception. Consider it a health assessment for websites–it pinpoints both strengths and areas for improvement.
Notably, this score uses lab data and insights from real users to gauge website performance. Lab data offers a controlled environment for identifying issues. Real user data, however, reflects the experience of visitors under varying conditions. This highlights specific performance issues that lab data might overlook.
A site’s Performance Score is a way to guide website optimization efforts in the right direction. It also helps boost search visibility, increase website traffic, and encourage user engagement.

Stop Wasting Time on Manual Reports... Get SEO Insights Faster With AgencyAnalytics
How Performance Score Relates To Other KPIs
Many data points contribute to this Lighthouse score. For example, improvements in Google’s Core Web Vitals often result in higher Performance Scores and search rankings.
These vitals include First Input Delay (FID), which measures the time a site takes to respond to a user's first interaction. Secondly, Cumulative Layout Shift (CLS) gauges the stability of a page as it loads, ensuring elements don't move unexpectedly. Lastly, First Contentful Paint (FCP) tracks the time until the first text or image is visible, which gives an early indicator of load speed.
In addition, Performance Score incorporates the Speed Index–a measure of how quickly content is visibly populated on a page. Together, these performance metrics offer a rounded view of a site's functionality, speed, and online visibility.

Key Factors That Impact the Lighthouse Performance Score
This Lighthouse score is affected by many factors. For example, page elements that are too large or improperly optimized slow down a site. On the other hand, efficiently designed elements contribute to a sleek and fast-loading page.
One practical approach is to streamline page elements. This means optimizing images, minimizing heavy scripts, and ensuring that only essential elements are on the page. Also, consider the test infrastructure itself. For example, a slow internet connection may result in a lack of functionality. Additionally, render-blocking resources are elements that must load before a web page shows up fully.

Running Lighthouse Audits
For a clear picture of performance, Google Lighthouse audits should be run in clean browser environments free from extensions that could skew results. This ensures the data reflects actual performance, not how a website operates under specific, potentially unique conditions.
Understanding these nuances is a way to create more accurate Google Lighthouse reports and achieve better web performance.
Professional reports help communicate the results of marketing campaigns, website performance, and other key metrics to stakeholders such as clients, management, and investors. This helps demonstrate the value of the work being done and provides a clear picture of progress towards goals and objectives.
How To Calculate Performance Score
Calculating this metric is a complex process automatically done through Google Lighthouse tests. It considers different metrics that reflect loading and interactivity, including Google’s Core Web Vitals, Speed Index, and SEO Performance.
Lighthouse runs a series of audits and assigns scores to each metric based on performance. Then, these numbers are weighted and aggregated into a single metric score. As a reference, Google Lighthouse scoring distribution ranges from 0 to 100.
What Is a Good Performance Score?
A Performance Score between 90 and 100 is outstanding, which indicates that a site loads quickly and provides a smooth user experience. It also suggests adherence to best practices, such as compressed images and efficient script usage.
Optimize website elements and run a regular Google Lighthouse audit to maintain a good score. It’s also a good practice to gather insights from real users and identify any unnoticed issues.
What Is a Bad Performance Score?
A bad Performance Score is typically below 50. This range suggests a slow page speed, delayed interactivity, or unstable page elements. In turn, this may hurt the user experience and search rankings.
To address this, implement lazy loading for lower-priority files (e.g., a background image), minimize the impact of third-party scripts, and optimize codes (e.g., CSS, Javascript).
How To Set Performance Score Benchmarks and Goals
To set effective benchmarks and goals, start by running a baseline test to see where the website stands. Evaluate a historical Google Lighthouse performance scoring, if available. If the current score is below 50, aim to reach the "needs improvement" range (50-89) as a short-term goal. Then, set a long-term goal of achieving a "good" score (90-100).
Identify specific areas for optimization, such as image compression, script minimization, and improving server response times. Establish milestones–like increasing the score by 10 points within three months–to keep the ball rolling. Regularly review and adjust goals as those targets are achieved. This structured approach systematically enhances site performance and a more favorable Google Lighthouse report.
Why Performance Score Matters to Clients
For clients, Performance Score directly impacts the user experience and search engine visibility. A high score means a better chance of showing up on the SERPs and increased traffic. It also helps to achieve more tangible website-related outcomes (e.g., more Clicks or online sales).
It’s also a way to demonstrate professionalism, develop a positive brand image, and gain a competitive advantage. In doing so, clients are more likely to hit their goals, improve user perception, and have a well-functioning website.

Why Performance Score Matters to Agencies
For agencies, Performance Score is a tangible measure of a website's overall health and effectiveness. It’s a way to help clients achieve their objectives, like driving more traffic, improving user engagement, and boosting revenue.
Additionally, Performance Score is a way to quickly fix any issues, like an input delay or a slow page load on specific web pages. In doing so, agencies show due diligence and their ability to quickly address website issues.

Spend Time Crafting Winning Strategies, Not Just Reporting Them.
Best Practices When Analyzing and Reporting on Performance Score
Tracking this Google Lighthouse score is a way to improve website performance and enhance the user experience. Here are some reporting best practices to convey this information effectively.
Ensure Data Accuracy
Confirm that the testing environment and parameters for Lighthouse scores remain consistent.
Analyze Over Time
Track Google Lighthouse Performance Scores over time to identify improvements or regressions.
Put in Context
Benchmark this score against industry standards and competitor performance. Report on related metrics like First Input Delay and First Contentful Paint.
Align to Client Goals
Clearly articulate how improvements in Google Lighthouse scores contribute to client objectives (e.g., increased traffic).
Visualize Performance
Where possible, use appropriate graphs and charts to enable easier data comprehension.
Include Actionable Recommendations
Offer practical suggestions to improve Lighthouse scores over time (e.g., optimizing images for a slow website).
When you use KPIs to clearly demonstrate your client’s ROI from your efforts month over month, it increases your retention rate and keeps clients paying you month after month.
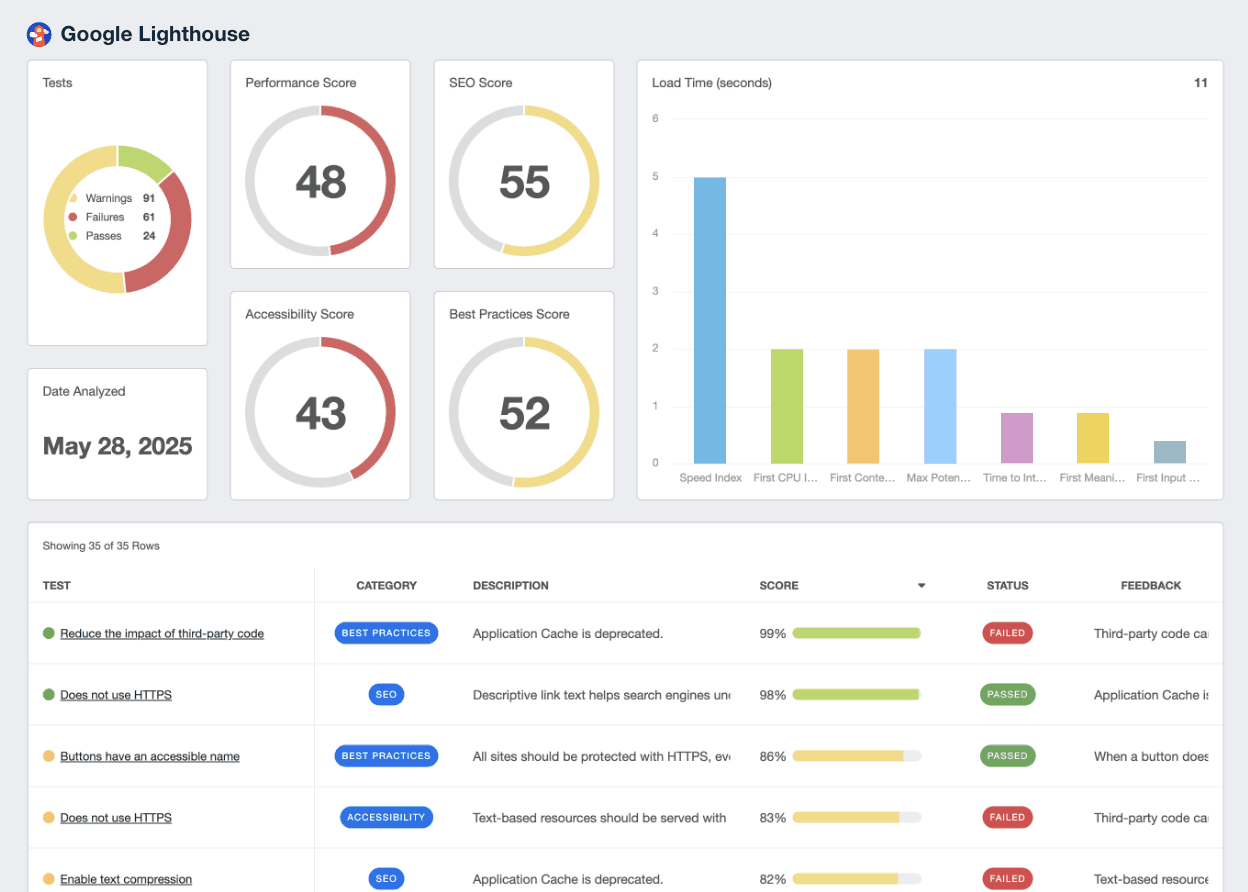
Google Lighthouse Dashboard Example
Related Integrations
How To Improve Performance Score
Improving this Google Lighthouse score is a way to increase page speed and ensure an optimal user experience. Here are some actionable ways to improve this metric.
Optimize Media
Resize media for faster loading times. Choose appropriate compressions to avoid sacrificing quality.
Eliminate Render-Blocking Resources
Remove unnecessary third-party scripts or defer their loading to improve site speed.
Implement Browser Caching
Configure caching headers, set expiration times, and utilize CDNs for efficient content loading.
Related Blog Posts
See how 7,000+ marketing agencies help clients win
Free 14-day trial. No credit card required.


