Website Page Views
Identify Popular Content
Page Views helps marketers identify high-performing pages for further optimization.
Conversion Funnel
Quickly map out the user journey by examining Page Views on critical funnel stages, such as the pricing page.
Client Reports
Showcase increased Page Views in general or for a particular page as proof of agency-generated engagement.
Seasonal Trends
Analyze Page Views to identify cyclical or seasonal consumer behavior.
Why Tracking Page Views Is Important
Page Views are a fundamental metric for gauging website engagement. High counts signal that a website effectively attracts visitors, an essential first step in any conversion process.
When used properly–and in context–the Page View metric offers actionable insights, revealing whether a website's content or marketing strategies are drawing attention.
In addition, Page View data is crucial for trend analysis and optimization. An uptick in views of the same page could signify successful marketing campaigns or effective SEO efforts.
On the other hand, a downtick is an early warning sign, prompting quick action to tweak strategies or content.
Stop Wasting Time on Manual Reports... Get Insights Faster With AgencyAnalytics
How Page Views Interact With Other KPIs
Page Views is part of a wider ecosystem of web analytics that tell the story of acquisition and engagement. For example, high Page Views offer broader opportunities for conversions, although this not guaranteed. Without a healthy Conversion Rate, that traffic may lack quality or relevance. Optimizing page performance metrics using analytics tools is crucial for increasing the quality and quantity of visitors to a single page based on whether or not they take the desired action once they’ve reached the page.
Time on Page and Engagement Rate also share an informative relationship with Page Views. Increased engagement on high-traffic pages suggests that the content effectively reaches and engages the target audience. On the flip side, a high Bounce Rate and other engagement-based session metrics could indicate that the content is attracting–but not retaining–visitors.
Page Views are typically considered a means to an end, not the ultimate goal. Make sure you connect the dots between this metric and what the client wants to achieve with their campaign. Putting this data in context helps convert what some consider a vanity metric into actionable insights.
No two clients are alike. Some clients want to see rankings, others want to see Page Views, and others want to see the number of calls from Google My Business. The fact that we can create a dashboard and report template that’s unique to our clients is invaluable.
How To Set Page View Benchmarks and Goals
To establish robust Page View benchmarks, agencies often turn to historical data. Reviewing past performance for specific pages, analyzing trends, and identifying patterns in Google Analytics or Google Search Console gives agencies a nuanced understanding of what constitutes a "good" or "bad" number of Page Views for a particular website, page, or campaign.
Data such as the total number of Page Views, the number of unique Page Views, and the number of pages viewed during user visits offer invaluable context.
To align with business objectives, back-calculate the required Page Views on priority pages by utilizing conversion rate and revenue per page. For example, if an eCommerce website has a set revenue target and budget, use the existing conversion rate to determine the number of Page Views needed to hit those revenue goals.
Page View Target Formula Example
Digging Deeper Into Page View Data
For a more granular look at Page Views, dig into metrics like user visit duration, referral sources, and the number of unique Page Views per source. Google Analytics records and reveals insights such as which channels drive the most Page Views or how different user segments engage with the website.
Assessing Page Views in tandem with these associated metrics paints a more complete picture of campaign performance.
Why Page Views Matter to Clients
Page Views serve as a barometer for interest in a client’s content and offers. A high number of Page Views shows that a website is effectively drawing in the target audience, whether through organic search, advertising, or other means.
This metric offers a clear and concise snapshot of website traffic, pointing to increased reach and engagement. Clients often tie Page Views directly to ROI. For example, a blog post with high Page Views may lead to greater brand awareness, more sign-ups, and increased sales.
Google Analytics data lets clients see the total number of Page Views and evaluate the page's performance. This data influences content creation, product offerings, and user experience design.

Why Page Views Matter to Agencies
Agencies dissect the Page View data to understand user pathways. For example, if the number of Page Views spikes after implementing a new advertising campaign, that's an indicator of its effectiveness. In the same session, agencies also analyze the source and flow of those Page Views to optimize future efforts.
For agencies, Page Views represent a data layer indicating how well specific content or a digital campaign performs. A comprehensive analysis includes a blend of the number of unique Page Views, Total Page Views, and the specifics of each page visit.

Save Time and Money By Automating Your Client Reporting
Best Practices for Analyzing and Reporting on Page Views
Effective digital marketing campaigns start with a thorough understanding of critical metrics like Page Views, and an in-depth analysis sets the stage for targeted improvements.
Prioritize Data Accuracy
Ensure data accuracy before deep-diving into Page Views in Google Analytics. Filters, correct tags, and domain settings are crucial in capturing the number of Page Views and unique Page Views.
Monitor Trends Over Time
Track the number of Page Views over different time frames. Weekly, monthly, and yearly views give unique insights into seasonality, helping to set realistic goals and adjust strategies.
Context is King
Though Page Views are important; they gain significance when juxtaposed with other metrics like conversion and engagement rates. Putting Page Views in a broader context provides a fuller picture of campaign health.
Align With Client Objectives
It's crucial to show how Page Views are not just numbers but contributors to achieving client-specific goals, whether it's increased brand awareness, sales, or lead generation.
Make it Actionable
End the analysis by providing actionable recommendations. These range from optimizing a landing page for better organic ranking and more page visits to retargeting specific visitor segments based on the pages they viewed.
Visualize the Story
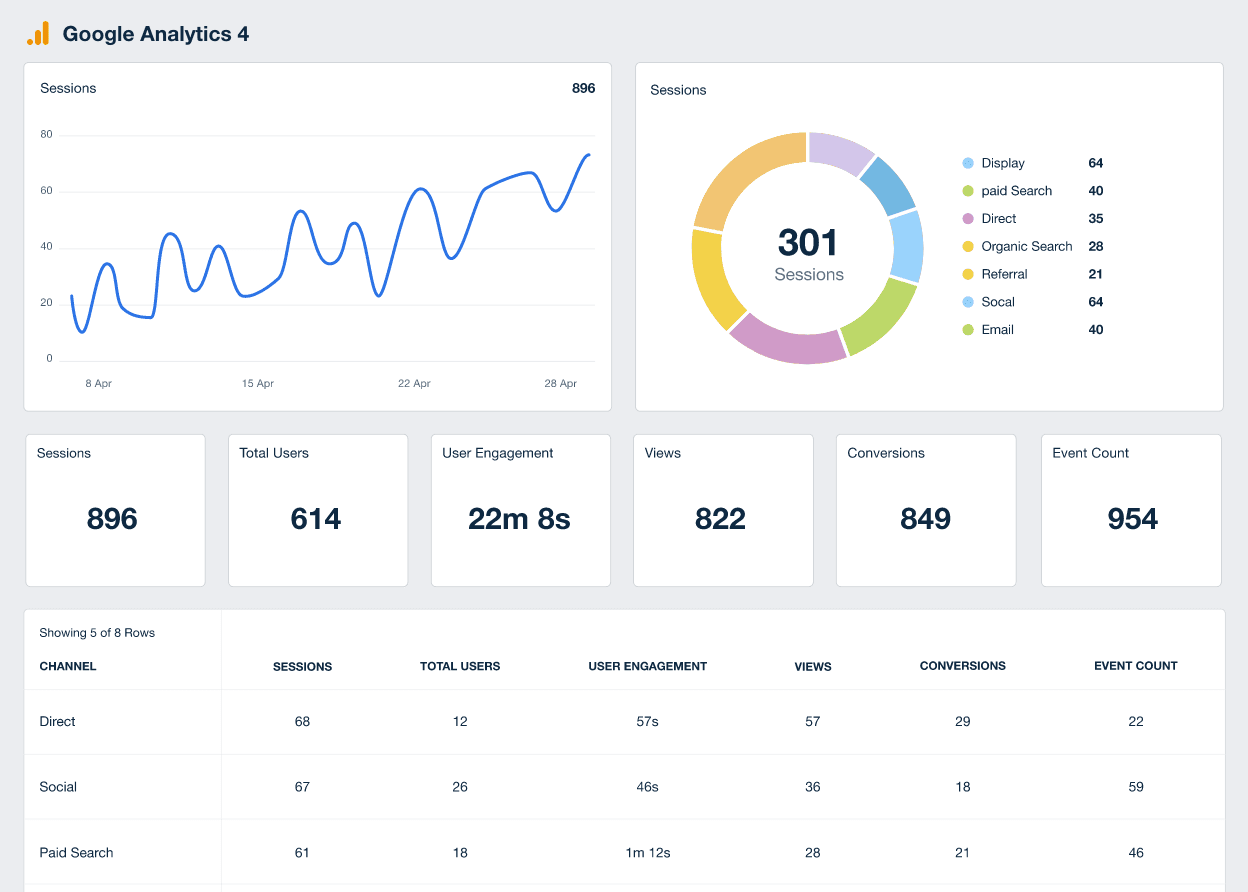
A well-crafted dashboard includes graphs and charts that make interpreting the total number of Page Views and Unique Page Views much easier. Visual data speeds up decision-making processes for agencies and their clients.
Many of our client relationships require customized reports because we’re managing multiple marketing channels for them at once to run cohesive, integrated marketing campaigns. They don’t want to see 7 reports, one per platform: Facebook Ads, Google Ads, Email Marketing, Website Analytics, etc. They want everything condensed into one, easy-to-read report, where they can view all of their most significant marketing data in one place. The customizable marketing reports allow us to do just that. The clients love them and we do too.
FAQs About Website Page Views
From understanding how pageview metrics are defined to distinguishing them from clicks, these FAQs help your agency explain important metrics clearly and make data-driven decisions for clients.
A page view occurs each time a visitor loads a page on a website. This is recorded by the analytics tool’s tracking code as a pageview hit, even if the page is refreshed multiple times within a single session. For reporting, views refer to the number of times the page is displayed, regardless of whether it’s the same visitor or a new visit.
A typical page view might occur when a visitor clicks from a search engine result to a client’s homepage. Each additional page the visitor views—such as a blog post or contact page—counts as its own page view, helping the website owner track which content is most engaging.
A visit (or session) refers to all the interactions a single user has during one browsing period, while page views track each instance that a page is loaded. One visit can include multiple page views if the visitor visits several pages during that session.
Page views are sometimes called “page impressions” in analytics tools, but the metric defined in web analytics specifically refers to a pageview hit recorded by the tracking code when a view occurs.
Link clicks measure the action of clicking (such as on an add, email, or SERP result), while landing page views confirm that the destination page actually loaded.
A single click might lead to multiple page views if the visitor navigates through additional pages or if the landing page is refreshed multiple times. Or a click could result in no page views if the user closes their browser before the page loads.
Analytics tools often use this distinction to ensure agencies are evaluating traffic and engagement, making it one of the most important metrics for campaign reporting.
A unique pageview combines all views of the same page by a single user within one session into only one unique pageview. This gives agencies a clearer picture of how many visitors viewed a page, rather than inflating counts when a page is refreshed multiple times in the same session. Comparing views vs. unique pageviews helps agencies make data-driven decisions and balance raw traffic with true user engagement.
Google Analytics 4 Reporting Dashboard
Related Integrations
How To Drive More Page Views
Getting more visitors to a client’s website is an ongoing effort, but the benefits are clear: higher user engagement and potential for conversions. Here are some actionable tips to improve Page View data.
Optimize Speed
Website load time makes or breaks user engagement. A faster site often leads to increased Page Views as users are more likely to browse website content. A slow site causes users to leave the site, even before the page tracking has kicked in.
Mobile Friendliness
Over 50% of global web traffic and more than 90% of internet users access the internet via mobile. Ensuring the site is mobile-friendly will lead to more Page Views and a better user experience.
Internal Linking
Adding relevant internal links guides the same visitor to more of a client’s content. This strategy helps in improving not only engagement but also Page Views. When the same people contribute multiple Page Views, it’s a win-win.
Related Blog Posts
See how 7,000+ marketing agencies help clients win
Free 14-day trial. No credit card required.


