Website Speed Index (SI)
Boost Engagement
Improve Speed Index score to enhance user engagement since faster loading pages retain interest.
Link to Conversions
Correlate Speed Index score with Conversion Rates to understand its effect on user actions.
Optimize Content
Identify which types of content slow down the website and use this to guide optimization efforts.
A/B Testing
Determine which designs result in a lower Speed Index score and better user engagement.
Why Website Speed Index Is Important
While other metrics like Page Load Time focus on the point when an entire page is fully loaded, a Speed Index measure considers the incremental display of content. This aligns with users' perception of speed, even if the page still needs to be fully loaded. A low Speed Index indicates that users see content sooner, leading to a better experience and increased user satisfaction.
Additionally, Speed Index directly reflects a site's technical health. A high Speed Index score indicates underlying issues, such as unoptimized images or bulky code. Speed Index is important because it directly impacts user experience, SEO rankings, and overall website performance.
Stop Wasting Time on Manual Reports... Get SEO Insights Faster With AgencyAnalytics
How the Speed Index Metric Relates To Other KPIs
Speed Index interplays with other performance metrics, forming a comprehensive view of a website's performance. For instance, faster loading times typically result in lower Bounce Rates, as visitors are less likely to leave prematurely.
A site’s Speed Index also indirectly influences SEO rankings since search engines prefer to display well-performing websites. This enhanced visibility may increase Organic Traffic, which is a key metric for gauging the effectiveness of SEO strategies. Additionally, Speed Index may affect Conversion Rates, since a fast-loading site encourages visitors to stay longer and interact with the website.
Key Elements Influencing Speed Index Score
Improving Speed Index (SI) means focusing on all elements that influence the loading speed of web pages.
Firstly, consider that the size and complexity of above the fold content significantly affects Speed Index. Web pages with heavy, complex content take longer to load, negatively impacting page Speed Index. To optimize for loading speed, focus on simplifying or compressing content (like videos and images).
Server response time is another factor that directly affects page Speed Index. Invest in reliable hosting solutions and optimize server configurations, which will lead to quicker server responses.
Caching mechanisms are also essential for page speed optimization. It works by reducing the load times for returning visitors through the storing of frequently accessed web page elements.
Minimizing HTTP requests is also a key strategy in page speed optimization. Each request adds to the load time, so reduce the number of requests by combining files and optimizing code where possible.
Lastly, implement techniques like asynchronous and lazy loading, especially for content that isn’t above the fold. This ensures that there’s no major effect on the overall performance score from slow-loading, render blocking resources.
KPIs are common metrics the client and our agency agree are valuable. This allows us to have beneficial conversations and move their business in the direction they want. We’re not wasting time or resources on anything the client doesn’t understand.
How To Calculate Speed Index
To calculate a page Speed Index score, a video capture of the webpage loading is analyzed frame by frame. The completeness of each frame during the page load is scored by comparing it to the fully loaded page.
The Speed Index metric is a weighted average based on how quickly each part of the page is displayed, emphasizing the content that appears first.
Tools like Google's Lighthouse or WebPageTest automate this process, providing a standardized and efficient way to measure the page Speed Index.
Speed Index Formula Example
What Is a Good Speed Index?
A good Speed Index score typically falls below 2000 milliseconds (2 seconds). Such websites load quickly, offering users a seamless experience.
A low Speed Index values correlate with reduced Bounce Rates, prolonged user engagement, and overall positive site perception. This performance score indicates an efficiently designed website that meets user expectations for quick accessibility.
What Is a Bad Speed Index?
A less-than-ideal average Speed Index generally exceeds 4000 milliseconds (4 seconds). Websites with such slow Speed Index values frustrate users, leading to higher Bounce Rates. Unsurprisingly, it may discourage return visits.
Unoptimized images, excessive use of large files, slow server response times, and inadequate use of browser caching can cause a high Speed Index.
How To Set Page Speed Optimization Benchmarks and Goals
To establish benchmarks and goals for Speed Index, begin by analyzing website performance using tools like Google Lighthouse. Compare these results with industry standards or similar websites to set a realistic baseline (e.g., aiming for a Speed Index metric under 3 seconds).
It's also important to tie Speed Index improvements to tangible business outcomes, such as increased conversions or revenue growth. Regularly revisit Speed Index performance goals and benchmarks, making optimizations as needed.
Why Speed Index Matters to Clients
For clients, the Speed Index directly impacts user experience, Engagement, and Conversions. A faster Speed Index leads to quicker page loads, which enhances user satisfaction and reduces Bounce Rates.
Having an improved user experience may significantly boost Conversion Rates, directly influencing the effectiveness of marketing campaigns. Moreover, fast-loading websites are favored by search engines, potentially improving SEO rankings and increasing organic traffic. This, in turn, may lead to higher customer retention and increased revenue for clients.

Why Speed Index Matters to Agencies
From an agency perspective, Speed Index offers a competitive edge. Agencies that prioritize Speed Index demonstrate a focus on delivering superior user experiences, impressing clients with improved ROI and Customer Retention.
When conducting client reporting, agencies illustrate how speed optimizations lead to more user actions, such as purchases or sign-ups. By improving website speed and demonstrating its impact on tangible outcomes, agencies justify their role as valuable partners in business growth.

Better, Faster & Easier Client Reports Are Just a Few Clicks Away
Best Practices When Analyzing and Reporting on Speed Index
The Speed Index metric is critical for strategic website decisions, ensuring a seamless user experience and better campaign outcomes. Here are reporting tips to communicate performance and recommendations effectively.
Include a Baseline Measurement
Start by reporting the initial Speed Index as a baseline for comparison and the impact of optimizations.
Ensure Data Accuracy
Stick to the same performance measurement tools (like Google Lighthouse or WebPageTest) for reporting consistency.
Analyze Trends and Anomalies
Report Speed Index regularly to track progress over time. Identify anomalies to gain insights into user behavior and potential issues.
Put Speed Index in Context
Contextualize Speed Index by considering industry benchmarks, competitor performance, and related metrics (e.g., Bounce Rate, Conversion Rate).
Use Data Visualizations
Include graphs or charts to visually depict changes in Speed Index. This makes data more digestible and easy to understand.
Include Actionable Recommendations
Provide the next steps to guide Speed Index optimization efforts (e.g., compressing images).
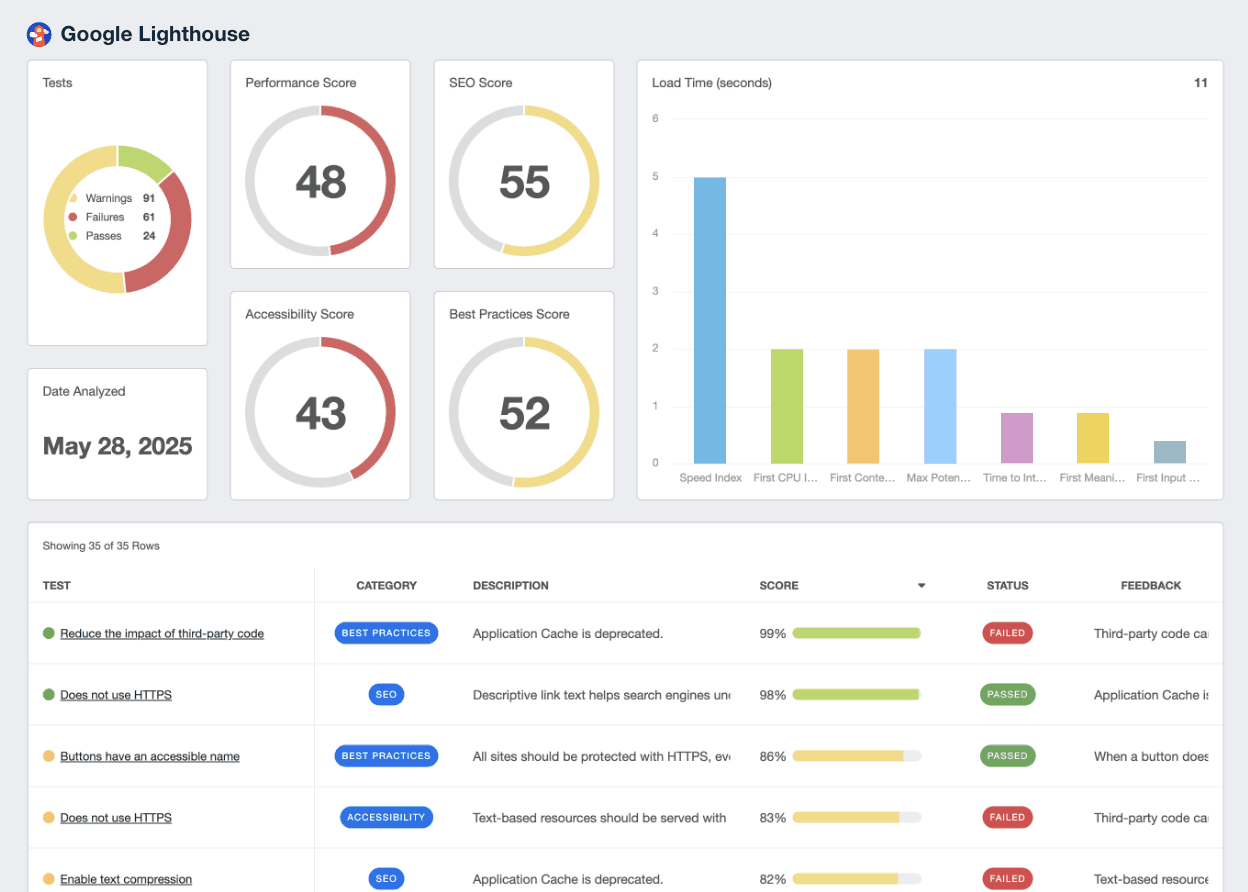
Google Lighthouse Dashboard Example
Related Integrations
How To Improve Speed Index Scoring
Improving the Speed Index of a website means enhancing its perceived performance and how quickly content is rendered–here are three ways to improve it.
Optimize Rendering
Prioritize the loading speed of above-the-fold content. This includes optimizing render-blocking resources like CSS and JavaScript.
Enable Compression
Use file compression tools for HTML, CSS, and JavaScript files. This step cuts down on size, making these elements quicker to download.
Leverage Browser Caching
Implement caching strategies to store frequently accessed resources in the user’s browser. This reduces load times on repeat visits.
Related Blog Posts
See how 7,000+ marketing agencies help clients win
Free 14-day trial. No credit card required.


