Largest Contentful Paint (LCP)
Performance Analysis
Assess the resource load time of all LCP elements and optimize accordingly.
User Experience
Identify any slow-loading LCP element that results in user exits.
SEO Strategy
Optimize content for a better LCP score, which contributes to SEO performance.
A/B Testing
Compare page designs to determine what works best for a fast load time.
Why Largest Contentful Paint Is Important
LCP score directly impacts user experience, reflecting how quickly the main content of a web page becomes visible. A swift LCP ensures visitors are not deterred by slow-loading pages, thereby reducing Bounce Rates and retaining Engagement.
That's why it's important to eliminate element render delay and ensure each LCP element is optimized. Look at when each LCP resource starts loading and decide whether further adjustments are needed (like reducing the size of CSS files).
Additionally, search engines favor websites with faster loading times, making LCP a critical factor in achieving higher search rankings. Improving an LCP time enhances content visibility, leading to more organic traffic and a user-friendly digital presence.
Stop Wasting Time on Reports. Get Marketing Insights Faster & Drive Results.
How Largest Contentful Paint Relates To Other KPIs
LCP is intrinsically linked with several other vital KPIs. For instance, a faster LCP often leads to a lower Bounce Rate and a longer Session Duration, indicating a positive user experience.
In addition, LCP also contributes to overall SEO score. Optimizing technical SEO elements on websites (such as large images or CSS) improves the user experience and will often be prioritized by search engines. Additionally, pages that load quickly are more likely to retain user interest and improve Conversion rates.
Finally, LCP is a part of Google’s Core Web Vitals, which also includes Cumulative Layout Shift (CLS) and First Input Delay (FID). CLS measures unexpected layout shifts in the website’s design during loading. Similarly, FID quantifies the delay between a user's interaction with a web page and the browser's response to that interaction.
Together, these Core Web Vitals impact the user experience and influence Google search rankings. As a best practice, run a Core Web Vitals assessment to see these metrics side by side and understand the bigger picture.
KPIs keep us accountable. KPIs provide the client transparency into what work we deliver. Most importantly, KPIs demonstrate that we are on track and achieving mutually agreed-upon goals. This is our agency’s true north–results for clients.
Factors Impacting Largest Contentful Paint
There isn’t just one LCP element to consider. The overall score is significantly influenced by technical and design factors. Take server efficiency, for example. Slow server response times or choosing an outdated Content Delivery Network increases LCP score. Similarly, render-blocking JavaScript and CSS impact content rendering, which negatively impacts LCP.
Another pivotal factor is file size since large media drastically slows down resource load times. Optimizing images and using render-blocking resources (or any other LCP element) will significantly improve the site’s performance. Also, consider lazy loading for any secondary non-interactive elements (e.g., a CSS background image or poster image).

How To Calculate LCP Score
To calculate LCP score, identify the largest content element visible in the viewport during the loading phase. This LCP element could be an image, video, or a block of text. Time measurement starts when the web page begins to load and stops when the largest element is fully visible.
LCP score is typically timed and automatically produced by web performance monitoring tools (such as Google Lighthouse). Be sure to monitor any changes in this Core Web Vitals metric and make any necessary improvements.
Largest Contentful Paint Formula Example
What Is a Good LCP Score?
A good LCP score is generally under 2.5 seconds. Achieving this range means a website is performing well speed-wise. This positively impacts the user experience and SEO rankings.
A website with an LCP score within this range is likely to hold users' attention and encourage browsing. As a result, there may be lower Bounce Rates, along with higher Engagement and Conversion Rates. Keep a watchful eye on when an LCP resource finishes loading and optimize when needed.
What Is a Bad LCP Score?
A poor LCP score exceeds 4.0 seconds. This slow loading time may lead to a negative user experience, higher Bounce Rates, and diminished SEO performance.
To fix a low LCP score, identify what’s causing delays–often the result of an unoptimized LCP element. This may include oversized images (e.g., a background image loaded in 10 seconds), inefficient resource loading, lengthy block-level elements, and slow server response times. Analyze other Google Core Web Vitals metrics for additional insights.
How To Set Largest Contentful Paint Benchmarks and Goals
Begin by measuring LCP performance in its raw state and setting a baseline without optimizations. Identify the top-priority web pages, such as landing and checkout pages.
To establish performance benchmarks, consider a mix of industry standards, competitor LCP scores, and historical performance. Tools like Google Analytics are also useful for gathering user data and setting realistic LCP goals.
After making optimizations, revisit LCP benchmarks and goals to monitor performance over time. Periodically adjust these targets in the event of technology updates or evolving user expectations.
Why Largest Contentful Paint Matters to Clients
From a client's perspective, optimizing LCP is important as it directly impacts the user experience on their website. A swift LCP means visitors encounter less frustration with loading delays, leading to a more positive interaction with their brand.
A favorable LCP value is also a direct element of Google’s Core Web Vitals report, which demonstrates adherence to best practices. Moreover, faster loading content often correlates with lower Bounce Rates and longer Engagement times. In the long run, it sets the stage for achieving Conversions and driving tangible business goals.

Why Largest Contentful Paint Matters to Agencies
For marketing agencies, LCP is a critical performance benchmark. It offers a quantifiable measure of website optimization efforts, reflecting an agency's expertise in delivering fast, efficient digital experiences.
Delivering a favorable LCP time also demonstrates an agency’s competence in handling technical SEO issues. It validates the effectiveness of optimization strategies and their ability to enhance web performance, including the real and perceived load speed, over time. Aside from current client work, consistently achieving excellent LCP scores is also a pitching point to prospects.

Save Time and Money by Automating Your Client Reporting
Best Practices When Analyzing and Reporting on Largest Contentful Paint
Follow these reporting best practices to communicate the importance of LCP and how it enhances overall website performance.
Utilize Real User Data
Base reporting on user data collected from actual interactions with the website.
Segment LCP Data
Group LCP insights across user groups, devices, browsers, or locations to identify data-informed optimization opportunities.
Highlight LCP Impact
Showcase how LCP improvements directly impact user experience, SEO, and Conversion Rates to emphasize the importance of optimization.
Analyze Root Causes
Explain the reasons for web page underperformance and specify the unoptimized LCP element (e.g., slow loading of critical resources or large image sizes).
Track LCP Progress
Continuously report on LCP improvements to showcase the impact of optimization efforts and guide future refinements.
Offer Actionable Recommendations
Provide actionable suggestions based on data and analysis (e.g., eliminate render-blocking resources). Include a Core Web Vitals report for related website performance insights.
FAQs: Largest Contentful Paint (LCP)
Got additional questions about Largest Contentful Paint (LCP)? We’re here to help.
Largest Contentful Paint (LCP) measures the time it takes for the largest visible content element (e.g., an image or text block) to fully render during page load. This key performance metric reflects how quickly users see the main content, which directly impacts user satisfaction and search engine rankings.
LCP directly influences how fast users perceive a page to load. A fast LCP creates a smoother experience, reduces frustration, and keeps visitors engaged. A slow LCP can increase bounce rates and make users abandon the site before the content fully loads.
Common causes of a poor LCP score include unoptimized images, slow server response times, render-blocking JavaScript or CSS, and oversized files. Any delay in loading the largest content element increases the LCP and negatively impacts performance.
To optimize LCP, compress large images, implement lazy loading for non-critical assets, use efficient server infrastructure, and defer render-blocking resources. Focus on ensuring the main content loads quickly and is immediately visible to users.
An ideal LCP score is 2.5 seconds or faster. Staying within this range ensures the site loads quickly enough to satisfy users and meet Google’s performance standards, helping boost both engagement and SEO results.
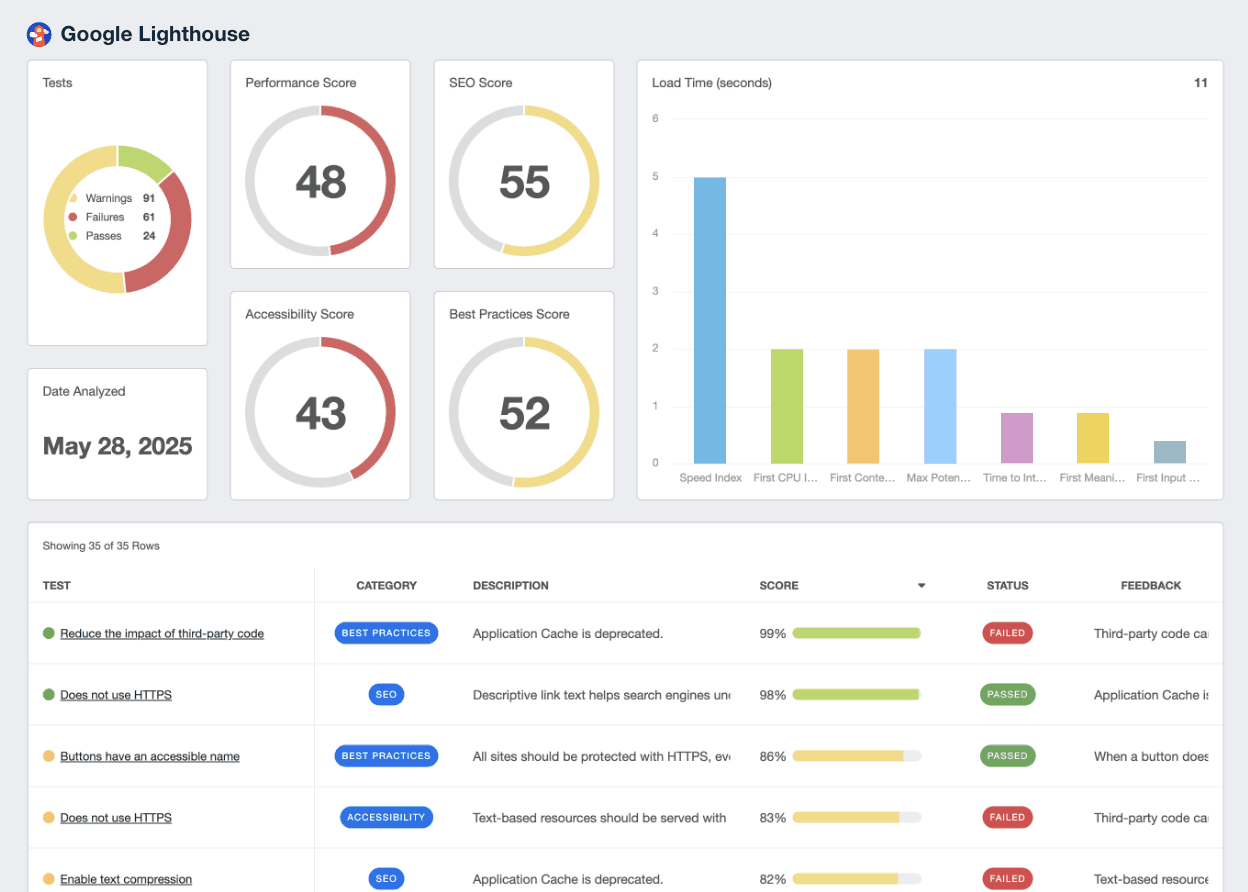
Google Lighthouse Dashboard Example
Related Integrations
How To Improve Largest Contentful Paint
Improving LCP score is critical for boosting site performance and user experience. Here are a few strategic ways to improve this score.
Optimize Media
Identify large media files including the page’s featured image and use tools to optimize image sizes without compromising the quality.
Prioritize Loading
Implement lazy loading for non-critical resources. This ensures that key content loads first.
Reduce Render-Blocking Resources
Defer render-blocking JavaScript or load CSS asynchronously to prevent slow resource load times.
Related Blog Posts
See how 7,000+ marketing agencies help clients win
Free 14-day trial. No credit card required.


