Exit Rate
Page Optimization
Identify high Exit Rate pages for targeted improvements.
Navigation Improvement
Streamline site navigation to reduce Exit Rates.
Conversion Insights
Analyze successful pages for insights on lowering Exit Rates.
Client Reports
Demonstrate marketing impact in client reports using Exit Rate changes.
Why Exit Rate Is Important
Exit Rate is a key metric for understanding visitor behavior on a website. It offers insights into which pages are the final interaction points for users, signaling potential issues or opportunities on those specific pages. A high Exit Rate could indicate problems with content, layout, or user experience, prompting a need for optimization.
Tracking Exit Rate is vital for evaluating the effectiveness of individual pages in keeping users engaged. It helps marketers pinpoint areas where visitors might lose interest, enabling targeted improvements. By understanding and addressing the reasons behind high Exit Rates, a website significantly enhances user experience, potentially increasing overall session time and improving the path towards conversion.

Stop Wasting Time on Manual Reports... Get Insights Faster With AgencyAnalytics
How Exit Rate Relates To Other KPIs
Exit Rate, while a significant metric on its own, gains greater relevance when analyzed in conjunction with other key performance indicators (KPIs). For instance, when paired with Bounce Rate, it provides a more holistic view of user engagement.
Integrating Exit Rate with Conversion Rate also reveals valuable insights. Pages with high Exit Rates might be barriers to conversion, identifying areas needing refinement. Conversely, a low Exit Rate on certain pages could indicate successful engagement leading to conversions. This interplay helps in pinpointing what works and what doesn’t in the conversion funnel.
Lastly, coupling Exit Rate with Pageviews and Time on Page helps agencies and clients understand the depth of engagement on specific pages. This trio of metrics paints a comprehensive picture of how content and design influence user behavior, guiding data-driven decisions for website optimization.

Exit Rate vs. Bounce Rate
While Bounce Rate reveals the percentage of single-page sessions, Exit Rate offers insights into which pages frequently end user journeys, even after multiple interactions. A bounce occurs when a visitor lands on a web page and leaves without any further interaction, typically reflecting a short, single-page session. For example, one-page visits that were under 10 seconds are typically considered bounced visitors, but if site visitors navigate to at least two pages during a single session, it is not considered a Bounce.
Conversely, Exit Rate tracks the frequency at which visitors exit from a specific page, regardless of how many other pages they have viewed in a session. Not all exits are bounces, but every bounce is counted in the page's Exit Rate.

During the strategy phase, we identify our KPIs and what our goals are. This guides us in identifying our most valuable metrics. This is followed up with identifying key metrics that play a valuable role in the conversion path. The next step is to map out these metrics from action to activation and identify the key steps.
How To Calculate Exit Rate
To calculate Exit Rate, start by dividing the total number of exits from a specific page by the total number of visits to that page. This metric is often provided in digital analytics tools, but understanding its calculation helps in deeper analysis.
Exit Rate Formula Example
What Is a Good Exit Rate?
A good average Exit Rate typically falls below 40-50%. This range suggests that the majority of users are engaging with multiple pages before exiting, indicating effective content and user experience.
Lower rates are especially favorable for key pages in the conversion path, as they imply that users are progressing towards a desired action or outcome.
What Is a Bad Exit Rate?
An average Exit Rate exceeding 50-60% is generally considered unfavorable. This high percentage implies that a significant number of users are leaving the site after viewing a certain page.
High Exit Rates could be a sign of irrelevant content, poor user experience, or technical issues on the page.
How To Set Exit Rate Benchmarks and Goals
When industry standards aren’t available, analyze historical data and past performance to identify patterns and establish a baseline for what constitutes a ‘good’ or ‘bad’ Exit Rate for the specific context. It’s also possible to back-calculate the desired Exit Rate to meet specific revenue or conversion goals. This approach involves determining the required user engagement level on key pages to achieve these targets and setting the Exit Rate accordingly.
Granular Analysis of Exit Rate
To gain deeper insights, segment Exit Rate data by various factors such as traffic source, user demographics, device type, and page type. This segmentation allows for more nuanced understanding and identification of specific areas for improvement.
For example, a high Exit Rate from mobile users might indicate mobile optimization issues, while differences in Exit Rate by traffic source reveals the quality and relevance of various marketing channels. This granular approach enables targeted strategies to optimize user experience and conversion paths.
Why Exit Rate Matters to Clients
For clients, understanding Exit Rate is important as it directly impacts their website's effectiveness in retaining visitors. A lower Exit Rate indicates that the website is successful in engaging users, keeping them interested, and potentially guiding them towards making a purchase or inquiry.
Clients use this metric to gauge the success of content, layout, and overall user experience. High Exit Rates are often seen as red flags, signaling content mismatches or navigation issues that need addressing.
By monitoring Exit Rate, clients gain insights into user behavior, helping them optimize their site to better align with customer needs and preferences, ultimately driving higher conversion rates and customer satisfaction.

Why Exit Rate Matters to Agencies
For agencies, Exit Rate is an important metric that informs the effectiveness of their marketing strategies. It helps identify which pages are not performing well and why, enabling targeted interventions.
A high Exit Rate on key landing pages could suggest that the marketing messages are not resonating with the audience or that the call-to-action is not compelling enough. Agencies analyze Exit Rate to refine their marketing campaigns, ensuring that each element of the user journey is optimized for maximum engagement.
Demonstrating improvements in Exit Rate is a tangible way for agencies to show clients the value of their work, reinforcing the agency’s expertise in enhancing user experience and boosting website performance.

Save Time and Money by Automating Your Client Reporting
Best Practices When Analyzing and Reporting on Exit Rate
By examining Exit Rate from multiple angles, marketers gain valuable insights into user behavior and webpage performance. This in-depth analysis allows for targeted improvements, ensuring that each aspect of the campaign aligns with the audience’s needs and preferences, enhancing overall campaign efficiency and effectiveness.
Ensure Data Accuracy
Regular audits of tracking tools and methodologies are essential to maintain data integrity and ensure that Exit Rate measurements accurately reflect user behavior.
Analyze Exit Rate Over Time
Monitor Exit Rate trends over time to identify the long-term impact of website changes or marketing strategies on user engagement and site performance.
Measure Exit Rate by Campaign
Measuring Exit Rate across different campaigns reveals which strategies are most successful in keeping users engaged, so strategies may be further refined.
Put Exit Rate in Context
Putting Exit Rate in context is crucial for accurate interpretation. Consider factors like page type, user intent, and industry benchmarks to fully understand the implications of the Exit Rate data.
Align Exit Rate to Client Goals
Ensure that Exit Rate analysis aligns with client goals. Understanding client objectives helps in tailoring the analysis to demonstrate how Exit Rate impacts broader business targets.
Include Actionable Recommendations
Include actionable recommendations based on Exit Rate findings. Suggest specific strategies for improvement to transform insights into tangible results.
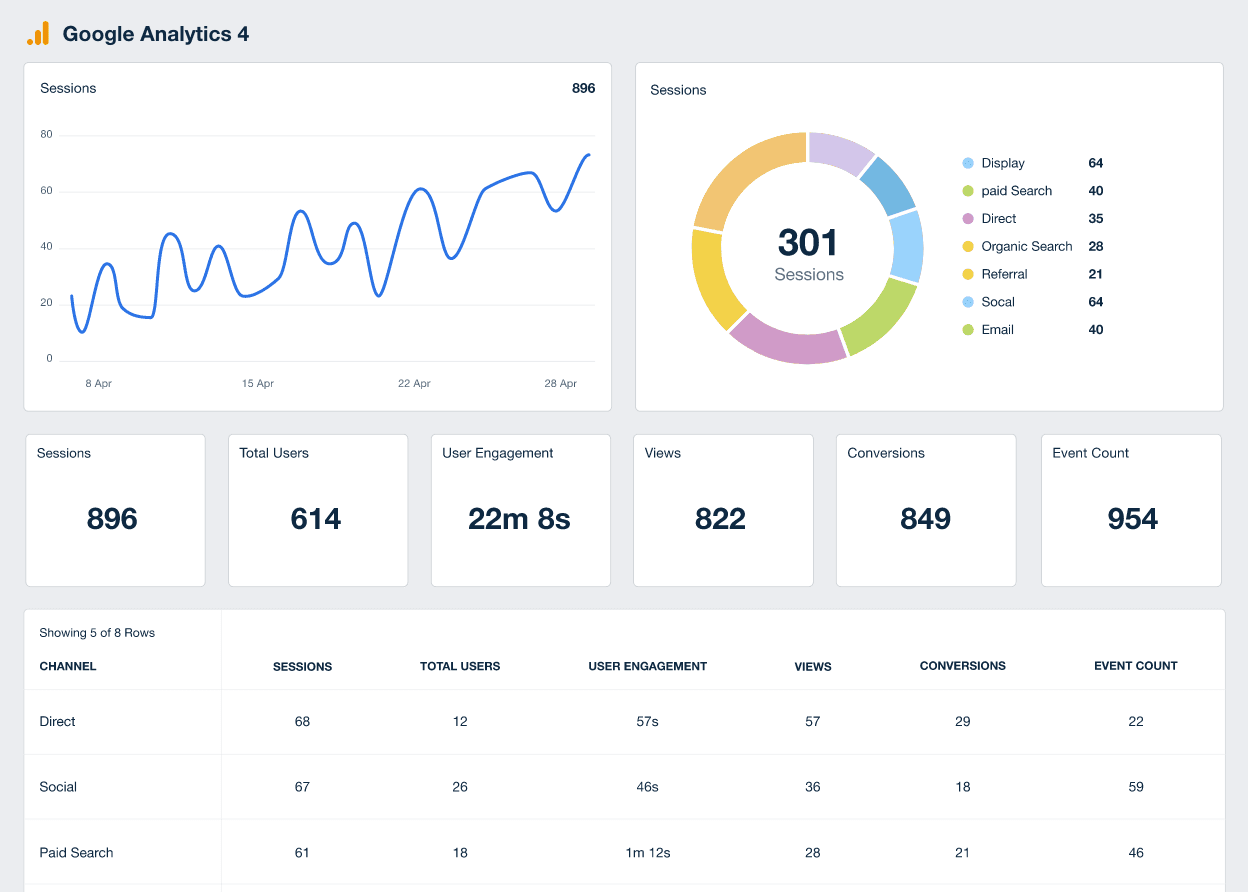
Google Analytics 4 Dashboard Example
Related Integrations
How To Improve Exit Rate
Improving Exit Rate involves strategic changes to website design and content to keep visitors engaged longer. Consider implementing some of the following tips to reduce the Exit Rate and enhance overall website effectiveness.
Speed Up Load Time
A slow-loading page is a major deterrent for visitors. Focus on optimizing images, leveraging browser caching, and minimizing redirects. Faster pages provide a smoother user experience, encouraging visitors to stay longer and explore more.
Mobile Optimization
With the increasing prevalence of mobile browsing, a responsive design that adapts to various screen sizes improves the user experience on mobile devices, drastically reducing Exit Rates.
Simplify Navigation
A complex or confusing navigation frustrates visitors, leading to higher Exit Rates. Streamlining the site's navigation with a clear, intuitive design helps visitors find what they need quickly, increasing their likelihood of staying on the site.
Related Blog Posts
See how 7,000+ marketing agencies help clients win
Free 14-day trial. No credit card required.


