Time to First Byte (TTFB)
Optimal Response
Monitor TTFB to ensure websites begin loading quickly.
SEO Impact
A lower TTFB contributes to better search rankings.
User Experience
Improve TTFB to enhance the user browsing journey.
Content Delivery
Optimize content delivery networks to enhance speed.
Why Time to First Byte Is Important
TTFB measures how fast a server delivers data after receiving a request. A fast TTFB means a website gets going quickly, which is excellent for keeping visitors engaged.
Speed is a big deal on the internet. When websites load quickly, users are more satisfied. Waiting for a slow website to load is frustrating, especially when many other alternatives exist.
Search engines like Google also pay attention to speed. They prefer faster websites, which often give them better spots in search results. Therefore, reducing server response times and prioritizing page speed is essential. It’s one way to ensure a better website experience and drive more web traffic from search engines.

Stop Wasting Time on Reports. Get Marketing Insights Faster & Drive Results.
How Time to First Byte Relates To Other KPIs
TTFB doesn't stand alone–it’s part of a bigger picture that affects how well a website performs.
For example, a quicker TTFB may contribute to a faster overall Page Load Time, which is vital for keeping users engaged and reducing Bounce Rates.
TTFB also impacts users' perception of a site's speed, often influenced by the client’s internet speed. A slow TTFB may lead to a poor user experience, as the website may appear sluggish or unresponsive. Websites with faster TTFB tend to have higher conversion rates, because users are more likely to complete transactions if the site is perceived as fast and responsive.
TTFB is indirectly related to Google's Core Web Vitals, which focus on user experience metrics like Largest Contentful Paint (LCP), First Input Delay (FID), and Cumulative Layout Shift (CLS).
While TTFB itself is not a Core Web Vital, it significantly influences the initial loading performance of a website, which affects LCP. A lower TTFB means the browser receives and renders content sooner, potentially leading to a quicker LCP. A fast-loading site also boosts other key metrics like Web Page Views and Time on Site.

Key Factors That Impact Time to First Byte
There are many moving parts that affect TTFB. For starters, look at what affects server overhead (i.e., how quickly a server processes requests). For example, network latency is the delay during data transmission over an internet connection. The distance between the server and the user and the quality of the network may influence this.
A content delivery network helps to reduce latency. That’s because a CDN consists of a network of servers distributed across different geographical locations, each capable of delivering content to users in its proximity. A shorter distance results in faster delivery of the first byte of data to a user's browser.
A user's internet connection is another vital factor. Faster speeds mitigate the effects of network latency, so choosing a fast host server is crucial. This impacts the quality of the server's hardware, the efficiency of its network infrastructure, and the response time to an HTTP request.
In short, TTFB is affected by the hosting provider, web server configuration, network latency, and internet speed. Improving these factors will lead to a more favorable TTFB and an enhanced user experience.

A website is often the first point of contact between a business and its potential customers, which is why we prioritize good design and user experience.
How To Calculate Time to First Byte
To measure TTFB, look at how long it takes from when a request is made to a website until the browser receives the first piece of data.
Note that there isn't a straightforward formula since TTFB is a measurement taken directly from performance testing or developer tools (e.g., Google Lighthouse, PageSpeed Insights, or Google Chrome DevTools).
What Is a Good TTFB?
A good TTFB score is typically below 200 milliseconds.
Achieving such speeds ensures that the site responds quickly to user requests, which leads to a smoother browsing experience.
This rapid response is crucial for keeping visitors engaged from the moment they arrive. It also plays a significant role in enhancing a website's search engine optimization (SEO) performance.
What Is a Bad TTFB?
A TTFB that’s over 600 milliseconds is a cause for concern. Slow loading times will result in a noticeable delay, which may prompt users to exit or visit other websites.
Additionally, search engines often penalize a website with a lagging TTFB, which could lead to lower rankings and decreased visibility. Therefore, it’s important to address a slow TTFB to ensure a website’s performance is optimal.
How To Set Time to First Byte Benchmarks and Goals
Start by measuring a website’s TTFB across different geographical locations and devices to establish a baseline. Use tools like Google's PageSpeed Insights for a comprehensive analysis.
Research industry benchmarks for similar websites or apps to set realistic goals. A TTFB under 200ms is considered good, but this will vary based on content type and user expectations.
Set specific goals (e.g., reducing server processing time) and measure TTFB at regular intervals to monitor progress and make improvements.
Why TTFB Matters to Clients
For clients, TTFB reflects the loading experience, site speed, and brand perception. A lower TTFB enhances user satisfaction by speeding up page loads, which is crucial for retaining visitors and reducing Bounce Rate.
Additionally, a quick-loading website is key to boosting Conversion Rates, which has the potential to affect the bottom line. A good TTFB also ensures a client’s website is accessible across all devices.

Why TTFB Matters to Agencies
For agencies, this metric is a way to showcase technical proficiency. A well-managed TTFB demonstrates an agency’s ability to enhance the user experience and SEO performance. By continuing to achieve a favorable TTFB, a client’s website may achieve higher search rankings, more visitors, and more Conversions.
As a result, TTFB becomes a selling point for agencies. It’s a way to demonstrate how their efforts translate into tangible, relevant results.

Spend Time Crafting Winning Strategies, Not Just Reporting Them.
Best Practices When Analyzing and Reporting on TTFB
To get the most from TTFB, it’s important to have the right approach. Here are a few best practices to report on this metric and optimize website performance.
Ensure Data Accuracy
Use reliable tools to measure TTFB. Do spot checks to understand how real users see the website and whether there are issues with the connection process.
Spot Trends and Anomalies
Stay alert to sudden changes in TTFB, as these may indicate issues with server health or the content management system (CMS).
Contextualize TTFB
Report on TTFB alongside related metrics, such as Bounce Rate and Time on Page. Explain their importance and how they’re related to each other.
Visualize Performance
Create visual representations of TTFB data to communicate findings effectively. Use charts and graphs to make information more accessible.
Align With Goals
Explain how TTFB aligns with a client’s broader business goals (e.g., increased website traffic and Conversions).
Actionable Recommendations
Provide any tactics to improve TTFB and overall website performance (e.g., switching to a more efficient CMS).
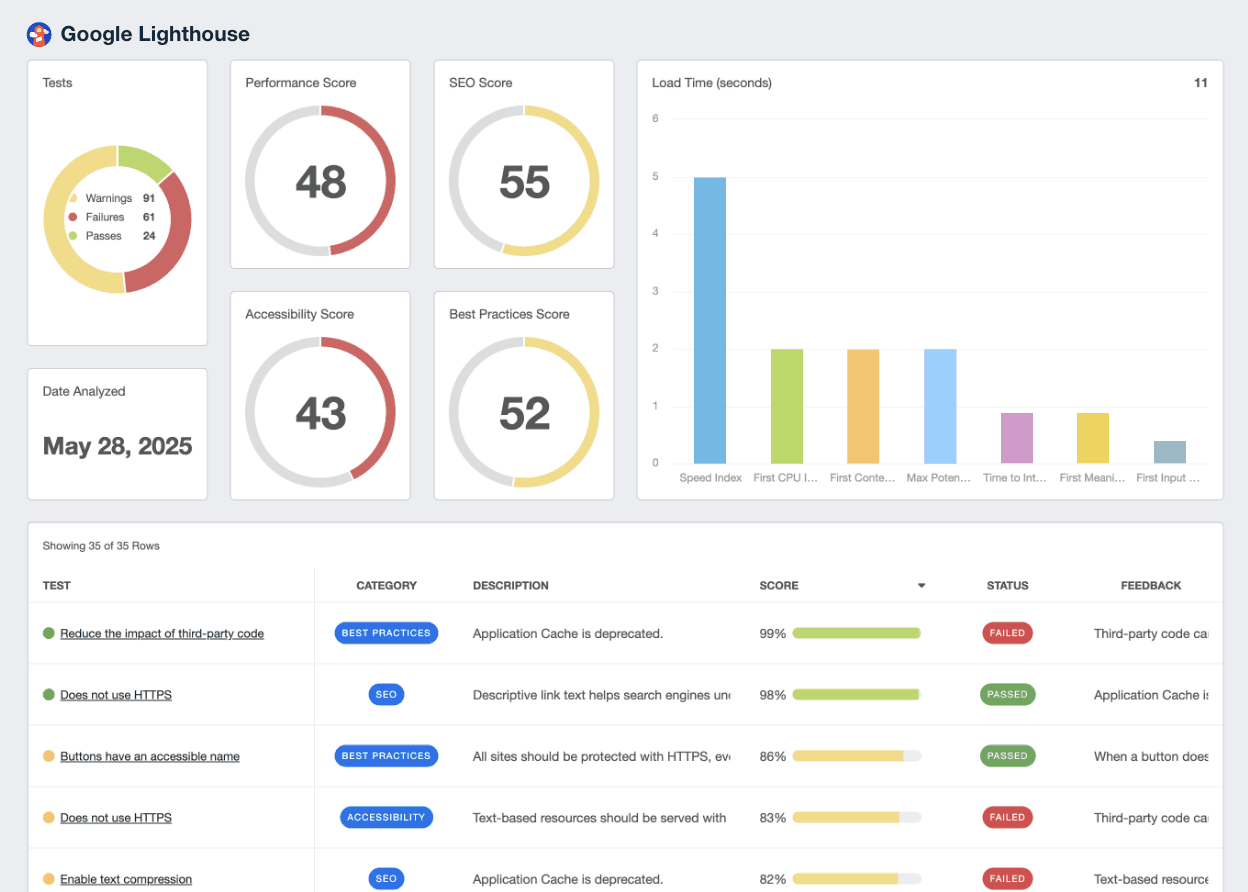
Google Lighthouse Dashboard Example
Related Integrations
How To Improve Time to First Byte
A good TTFB is essential for website performance, especially since it influences the user experience and SEO rankings. Here are three actionable strategies to enhance TTFB.
Faster Content Delivery
Implement a Content Delivery Network (CDN) to store cached content and reduce TTFB.
Reduce Server Load
Minimize the number of HTTP requests needed for a page to load and compress files where possible.
Use Efficient Code
Optimize databases and ensure any CMS or ecommerce platform is running efficiently.
Related Blog Posts
See how 7,000+ marketing agencies help clients win
Free 14-day trial. No credit card required.


