Table of Contents
QUICK SUMMARY:
A data pipeline streamlines the transition of raw data to actionable insights by automating the collection, processing, and refinement stages. This automation is important for agencies managing data across multiple marketing platforms, ensuring inaccuracies are reduced and reporting remains efficient. This guide highlights the significant role of data pipelines in enhancing client reports with deeper analysis and insights, helping agencies make strategic decisions.
These days, everything is driven by data, from the number of views, likes, comments, and subscribers to the analytics, metrics, and rankings.
If you're like most agencies, you rely on client reports to track your progress and measure your success. But what if there was a way to automate the process of creating these reports so that you could spend less time on data extraction and transformation, and more time analyzing and acting on the results?
A data pipeline can provide just that–a reliable, efficient way to get data from various sources into the format you need for reporting. In this blog post, we'll explore the benefits of using a data pipeline for client reporting and show how it can help your agency achieve its goals.
What we’ll cover:
What Is a Data Pipeline?
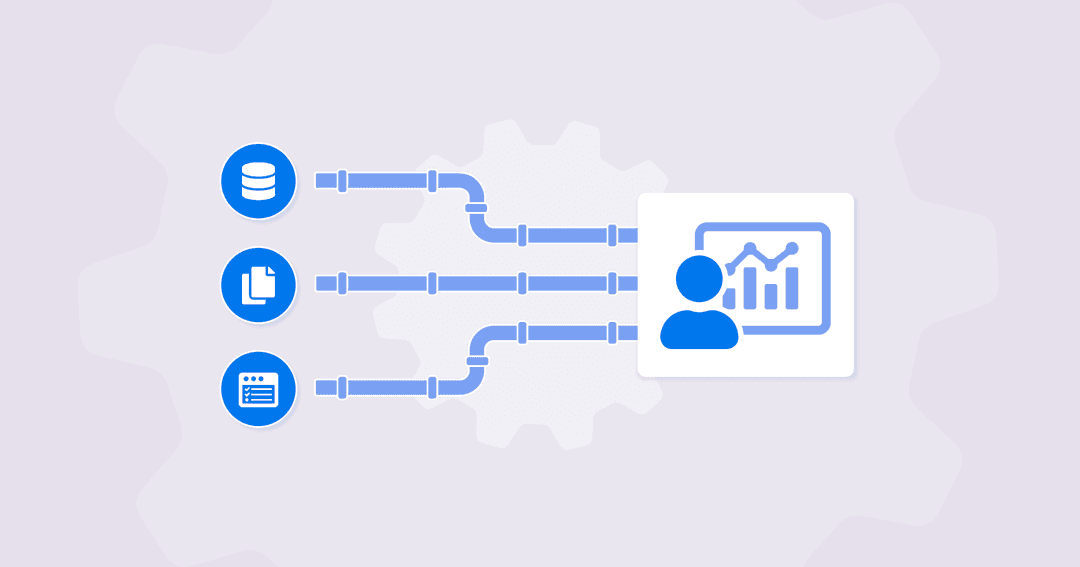
Essentially, a data pipeline moves raw data from a source to a destination through a series of steps that collect, process, and refine the data. By building a data pipeline, you will get your data flowing so you can gather it and analyze it for better context, insights, and business decisions.
Think about a Google Ads account. There are thousands of discrete and continuous data points across campaigns, ad groups, ads, keywords, demographics, conversions, and more. If you simply downloaded all of that raw data and sent it over to a client, they would be overwhelmed by numbers and underwhelmed by insights.
Before data pipelines existed, this transformation from raw data to actionable insights was handled manually–but cutting and pasting the relevant bits from one source into another.
Now, extrapolate that to a modern agency/client relationship that includes multiple marketing platforms such as paid search, SEO, social media marketing, email marketing, video marketing, and more. That much cutting and pasting takes up far too much time and opens up far too many opportunities for simple data errors.
For marketing agencies, a few of the most common examples of data sources include:
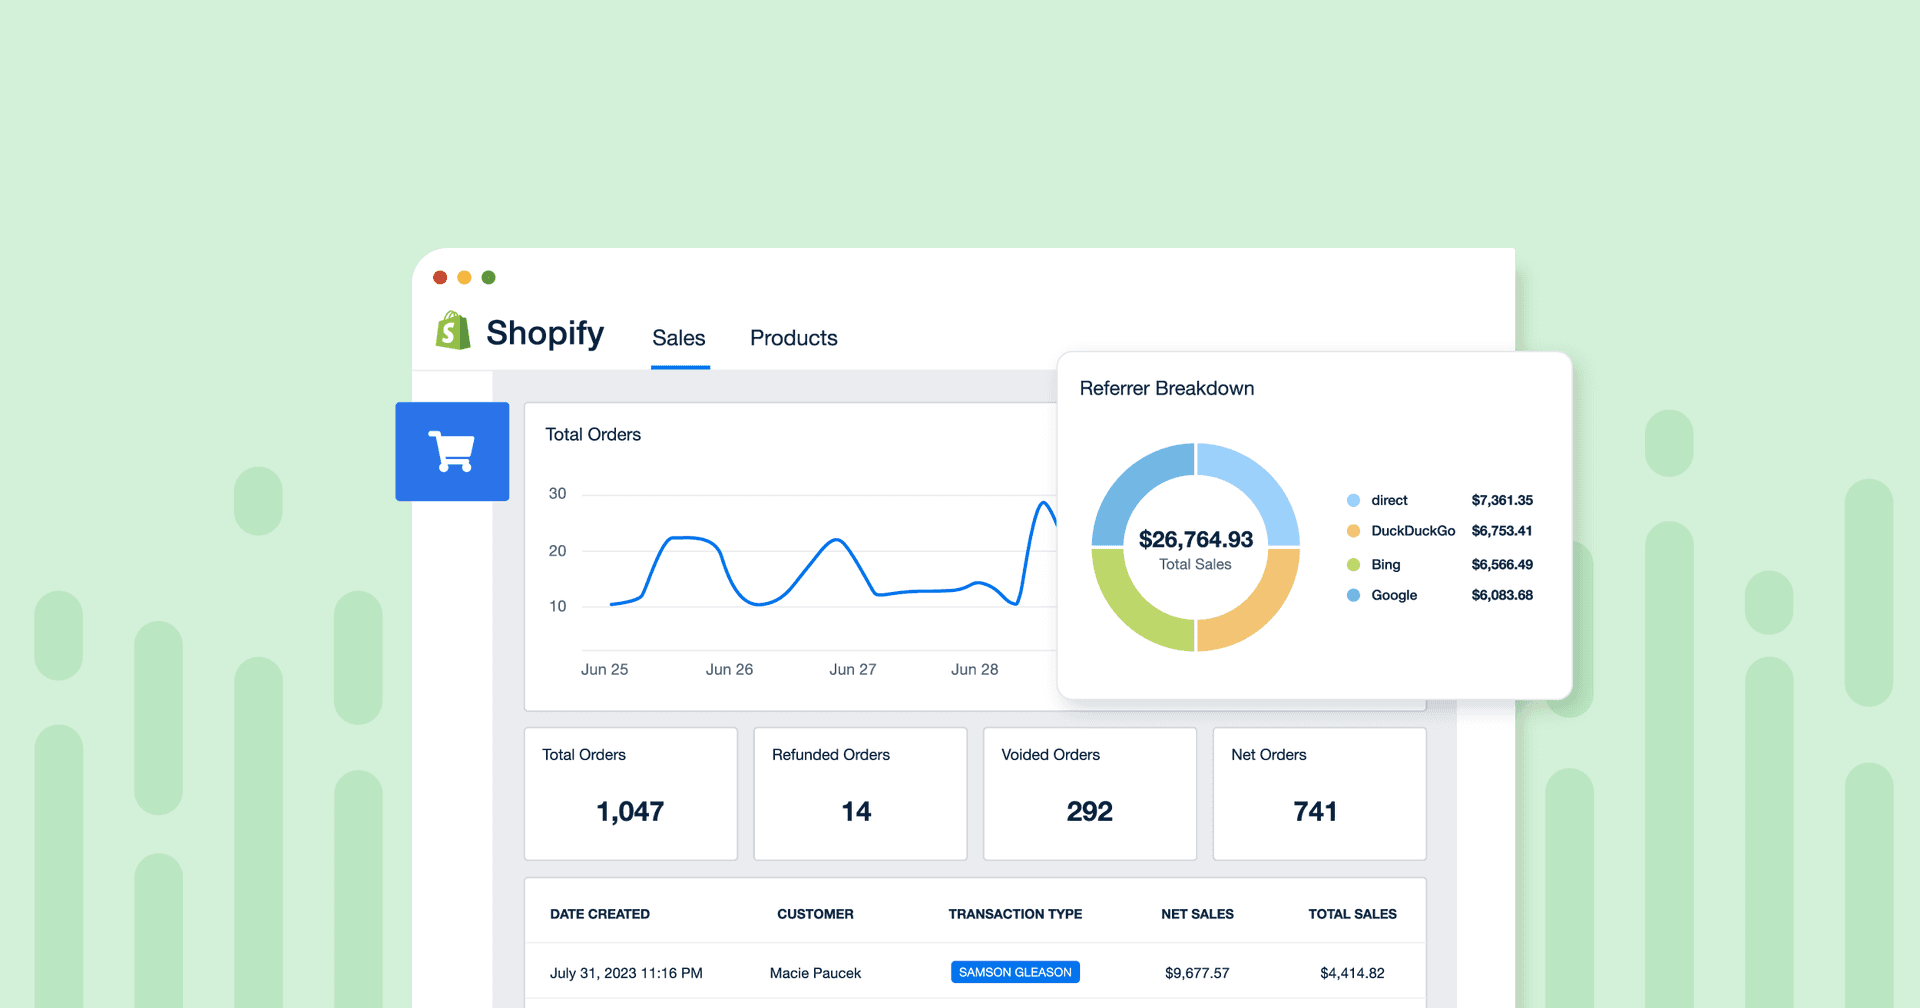
eCommerce data (such as Shopify orders or Stripe payments)
Ad platforms (think Google Ads, Spotify Ads, StackAdapt, and more)
Social media (including post reach, Instagram likes, or Facebook comments)
Web Analytics (most commonly Google Analytics)
Marketing email & automation platforms (from basic email campaigns to complex multi-touch automation)
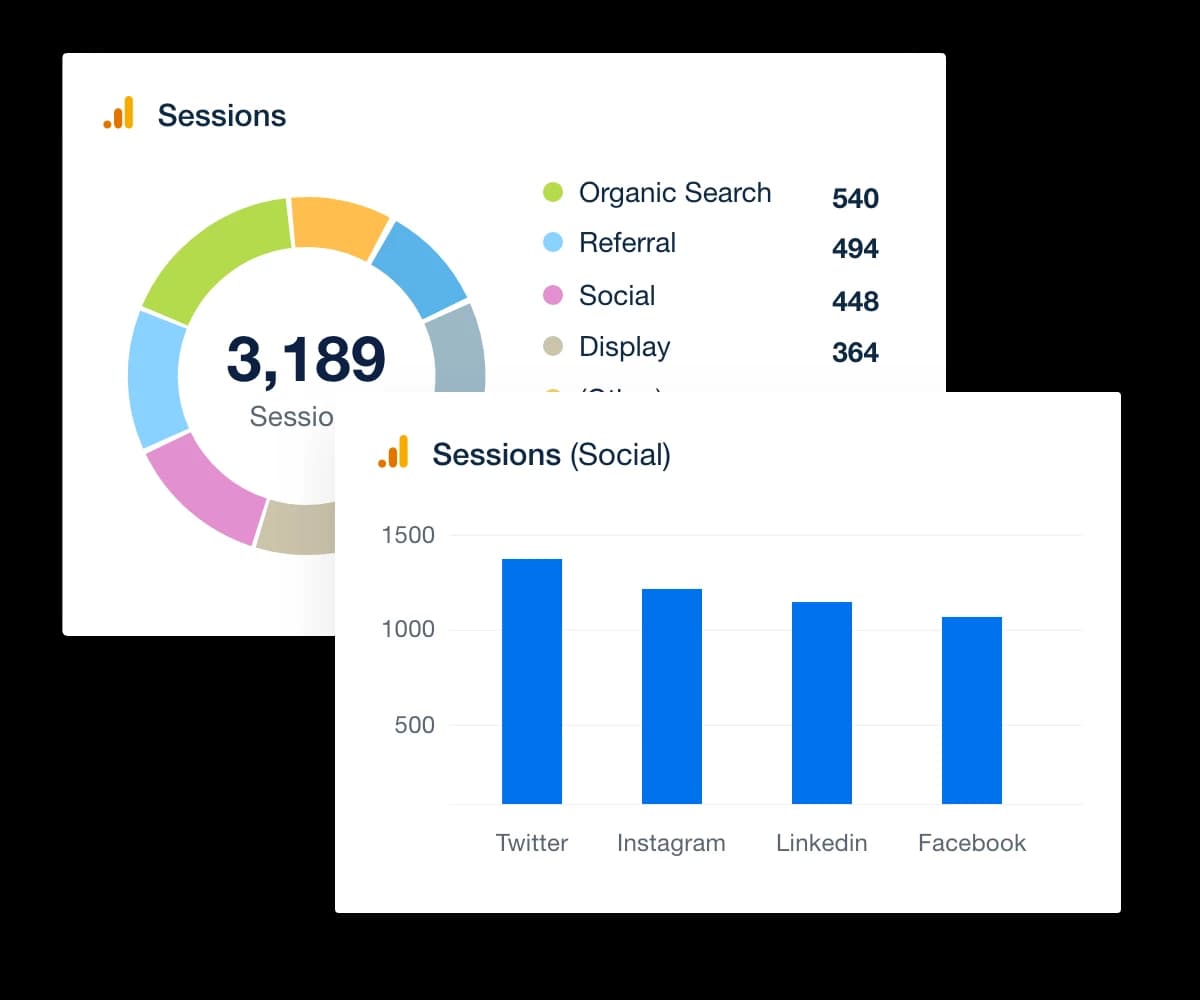
A data pipeline filters and refines the raw data from these sources, like Google Analytics—
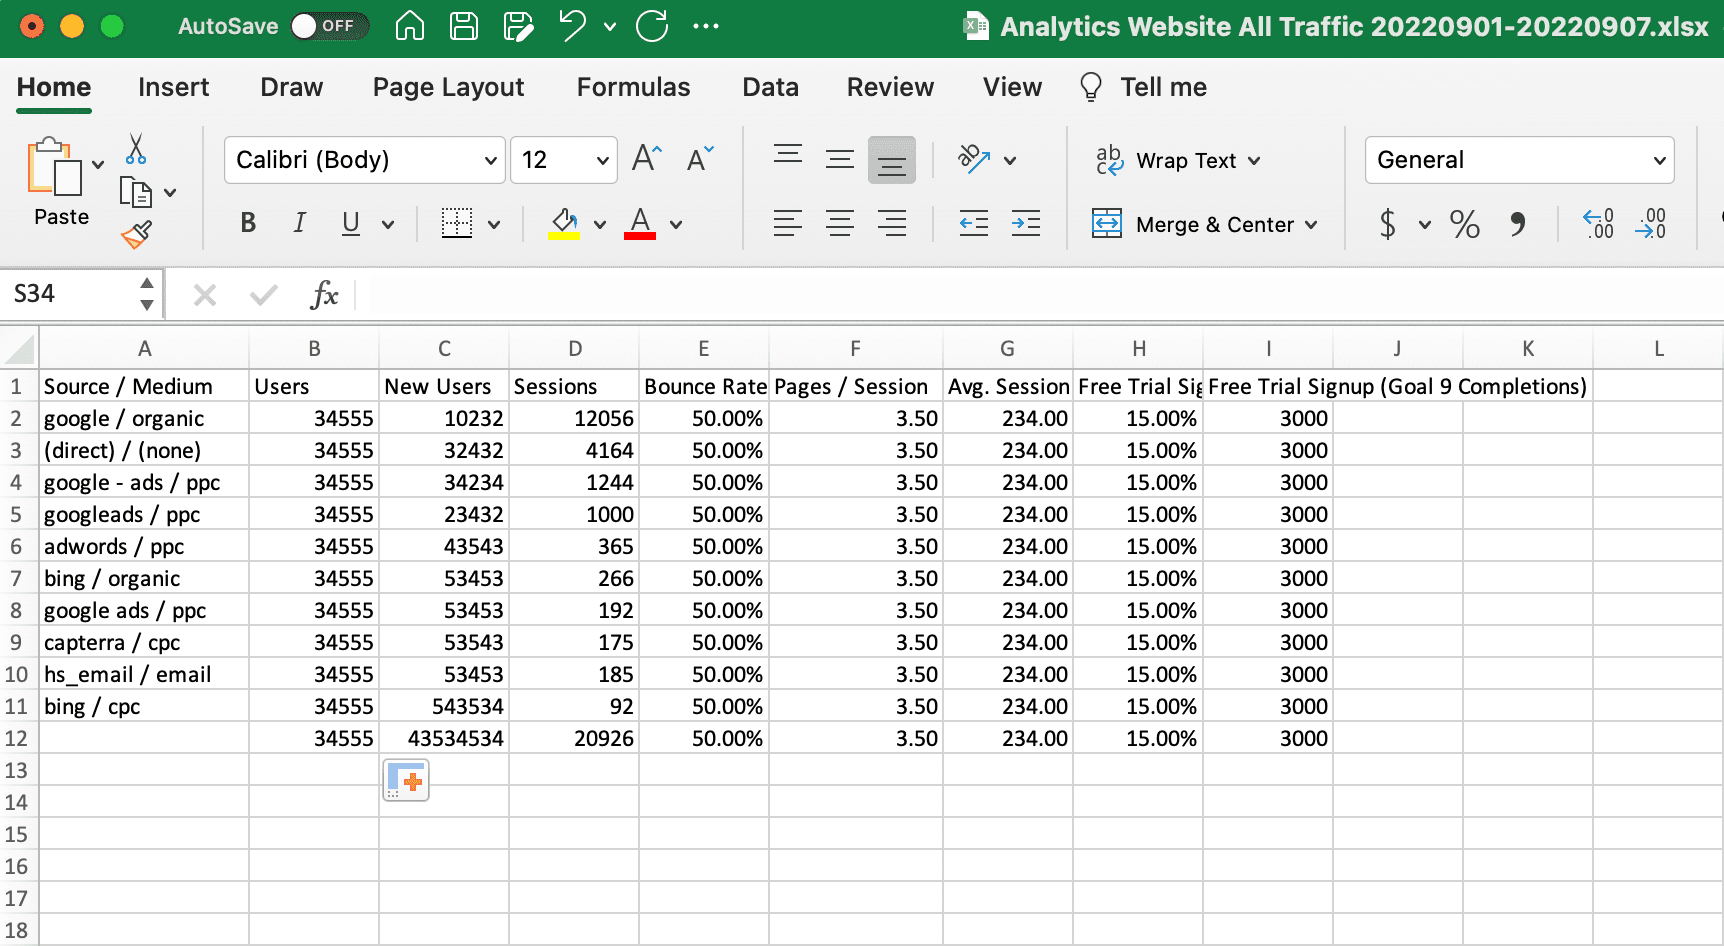
before transporting it to its destination (aka your agency and clients) in new packaging.
Why You Need a Data Pipeline
A typical full-service marketing agency uses over a dozen marketing agency tools and platforms, all of which generate a ton of data for every client. Even a niche agency will typically include multiple platforms for Social Media, SEO, or PPC. According to our internal data from over 7,000 agencies around the world, the average digital marketing agency pulls data from over 22 different sources each and every month.
That data is not only scattered; oftentimes, it’s entirely inaccessible to everyone at your agency except for a single person or department. For example, the paid search person might have the login for a client's Google Ads account while the SEO person owns the login for Semrush. When this happens, it’s called a ‘data silo.’
Many agencies have their client’s data languishing in data silos that not only block the sharing of information but also kill any chance of collaboration as data silos make it difficult (and sometimes impossible) for different teams at your agency to access the data they need.
Rather than sharing the username and password details for 22 (or more) different platforms across an entire agency, a data pipeline architecture can be set up once to work behind the scenes to pull the required data into a place where everyone, agency staff, and clients, can put it to use.
4 Benefits of a Data Pipeline
Aside from helping agencies overcome data silos, there are many more benefits to building a data pipeline for client reporting.
Not only does it allow your agency to extract data from various sources, but it also transforms the data into a format that’s easier to analyze while simultaneously helping you automate repetitive tasks.
So if you’re used to the hassle of manual spreadsheet reporting, data processing will feel like a godsend.
The 4 main benefits of a data pipeline are:
1. It Saves Time and Effort
A data pipeline saves time by automating the process of extracting, transforming, and loading data into a reporting tool. It also automates repetitive tasks, such as extracting data from multiple sources and transforming it into a standardized format that can more readily be analyzed.
This frees up your agency's time so your team can focus on more important tasks, such as analyzing the data and optimizing campaigns based on these metrics.
2. It’s Iterative
Through repetition, it helps you find patterns and identify trends over time.
For example, if one step consistently slows down your data flow, it should be a clue to explore why that’s happening and if there’s any way to optimize it.
Constantly searching for a particular data point? Add it as a widget! Pulling out the calculator to figure out a particular KPI? Create a custom metric.
The iterative nature of data pipelines also helps standardize your data architecture, which means your pipeline can be easily repurposed or reused instead of having to build an entirely new data process from scratch every time.
2. More Efficiency and Faster Integration
As data pipelines help streamline and standardize the data collecting process, it is easier for your agency to integrate new data sources into the system.
Launching a new Spotify Ads campaign for a client? Add it as in integration. Onboarding a new client? Add them to the same platform your team is used to.
A data pipeline will also boost productivity as the data is easy to access throughout your agency and reduces the need to always double-check the data because it ensures that all of your data is accurately stored in one place.
3. Consistent Data Quality
As the data flows through the pipeline, it gets cleaned and refined, making it more useful and meaningful to end users.
Because a data pipeline standardizes your reporting process, it ensures that all of your data is collected and processed consistently. This way, the data in your reports are accurate and reliable. No more copy and paste errors, inconsistent date ranges for metrics or Excel formula errors that throw off your agency’s KPIs.
4. Easy to Build and Scale
As your agency and client base grows and your needs change, you can easily modify or add to your data pipeline. This flexibility makes it a good choice for agencies of all sizes.
You can build and scale your data pipeline as needed. From a simple pipeline–with only a couple of clients and a handful of integrations–to a complex network, your pipelines will grow with your business.
How Data Pipelines Influence Decision-Making
It’s no secret that most business decisions these days are data-driven, and it’s especially true in marketing. Whether it’s using data to create new strategies or analyzing a campaign’s metrics to determine its effectiveness, marketing initiatives live and die by the numbers and data produced.
As data pipelines increase data flows while bringing all the information from your data lake in one place, it makes it easier for you to drill down on that data. And since it also cleans up that data for increased accuracy and reliability, this inevitably leads to better insights and better business decisions.
At the end of the day, the quality of your decisions is based not only on the quality of the data but also on the quality of the analysis itself.
Key Data Pipeline Components
Although what goes on behind the scenes can be much more complex, there are five main components of a data pipeline. Each component is important to make sure that the data that travels from the original source to the final destination is intact, accurate, and actionable.
Origin
This is the entry point. The raw data is extracted using a variety of tools such as APIs or web scraping. For example, AgencyAnalytics can automatically pull data from over 80 different marketing platforms.
Dataflow
As the name implies, ‘data flow’ refers to the movement of data through the pipeline from the origin to the destination. This may seem relatively simple, but maintaining a flow of data is much like monitoring traffic on the I-95.
If you are creating your own data pipeline, resources need to be allocated to monitor the flow of data to ensure there are no traffic jams or pileups along the way.
Processing
Also referred to as Data Transformation, processing can be a single step or a series of steps; it just depends on the data source and destination.
While processing is related to data flow, the main difference between the two is data flow is all about moving data itself. Processing, on the other hand, is focused on how the unstructured data moves and how it is converted into a format for analysis.
Destination
This is the endpoint of the pipeline, and the destination varies. Sometimes the destination is an analytical database, and other times it’s a storage system. It all depends on the data source and where it’s going.
For a reporting data pipeline, the destination often includes the end recipient, whether that be the PPC specialist on your team who needs to see the Google Ads trends or the client who wants a monthly marketing report to track the performance of their overall program.
Storage
Nobody wants all of their valuable data to disappear, so data storage is an important component of any data pipeline. Often, pipelines utilize different storage options at different stages of the pipelines, and the most common storage options include data lakes and data warehouses.
Data Pipeline Infrastructure
A helpful way to picture the infrastructure of data pipelines is to compare them to the pipelines that bring us our drinking water.
Our water comes from lakes, oceans, and rivers, but it’s not safe to drink yet. It still has to be transported by pipelines from those sources to a destination such as a water treatment facility. After the water is treated at the facility and made safe to drink, it’s again transported in pipelines to places where we need it for drinking, cleaning, and agriculture.
Data pipelines work similarly to water pipelines, except the data sources include data lakes, databases, SaaS applications, and data stream. But much the same way as our water example, the raw data needs to be refined and cleaned before it can be used.
4 Common Data Pipeline Infrastructures
Most businesses utilize one of the following four designs for their data pipeline architecture.
1. ETL - Extract, Transform, Load
ETL stands for “extract, transform, load,” and it's the most widely used form of data pipeline infrastructure.
As the name suggests, it extracts data from a source (or multiple sources), and transforms it (such as applying calculations or converting it into a single, standard format) before loading it into a target system or destination.
If we go back to our example using water pipelines, the ETL process would extract the water from a lake, river or ocean, transform the water by making it safe for us to drink in a water treatment facility, and then load the water into the drinking fountain for us to enjoy.
ETL pipelines are often used to move data from an outdated system to a new data warehouse or to combine data from different sources in a single place for analysis.
2. ELT - Extract, Load, Transform
ELT is similar to ETL, except the order is slightly different, as ELT stands for “extract, load, transform.” So instead of extracting the data and processing it right away like in ETL, the data is first loaded into a data warehouse or lake before being transformed.
This infrastructure is useful when you don’t know what to do with the data or if you’re dealing with a huge amount of data.
Going back to the water example, the ELT process would extract the water from its source, load it in a massive water reservoir, and transform it through a purification process.
3. Batch Processing
Batch processing occurs on a regular schedule and is the basis for traditional analytics where decisions are made based on historical data. The data is extracted, transformed, and loaded in batches (hence the name).
Batch processing can be time-consuming (it depends on batch size), and it’s often run during off-hours to avoid overloading the source system. It’s a popular pipeline that helps process data, but if time is of the essence, you’re better off using a streaming data pipeline for fast, real-time analysis and results.
4. Streaming (AKA Real-Time) Processing
Streaming data pipelines is about real-time analytics with a constant stream of data flowing through them.
Whereas batch processing happens on a regular schedule, streaming data pipelines process the data as soon as it’s created while providing continual updates. A streaming infrastructure is most effective when the timing is everything, such as with fleet management businesses.
Keep in mind that these four systems are not necessarily mutually exclusive. For example, a data pipeline can batch its ETL processing once a day. Or a streaming infrastructure can run an ELT process in real-time.
Data Pipeline Examples
Here are a few examples of data pipelines you’ll find in the real world.
Spotify: Finding the Music You Like
Spotify is renowned for Discover Weekly, a personal recommendations playlist that updates every Monday. But Spotify has to sort through a ton of data to make Discover Weekly happen, so they built a data pipeline to deal with the enormous amounts of data its platform generates every day.

Spotify Tracks Over 100 Billion Data Points Every Day
Erin Palmer, a senior data engineer at Spotify, said, “the unique challenge here in terms of the data pipeline is that we need to be able to process the whole catalog for every single user.”
For an idea about the numbers we’re working with, Spotify’s catalog has over 70 million songs. It has 182 million paid subscribers and 442 million monthly listeners, creating more than 100 billion points of data every single day.
The Processing Power of Data Pipelines
When it comes to processing data in these huge quantities, you need a data pipeline to help process all of it. Especially because those billions of data points are coming in from multiple sources as Spotify tracks users as they switch between their smartphones, desktops, laptops, and tablets.
As we talked about before, data pipelines clean and refine the data in addition to transporting it to its destination, making it more useful and meaningful to end users (such as marketers) in the process. And it certainly sounds like Spotify’s data pipelines are effective as its advertising materials say, “these real-time, personal insights go beyond demographics and device IDs alone to reveal our audience’s moods, mindsets, tastes, and behaviors.”
Macy’s: Streaming Pipelines for a Unified Shopping Experience
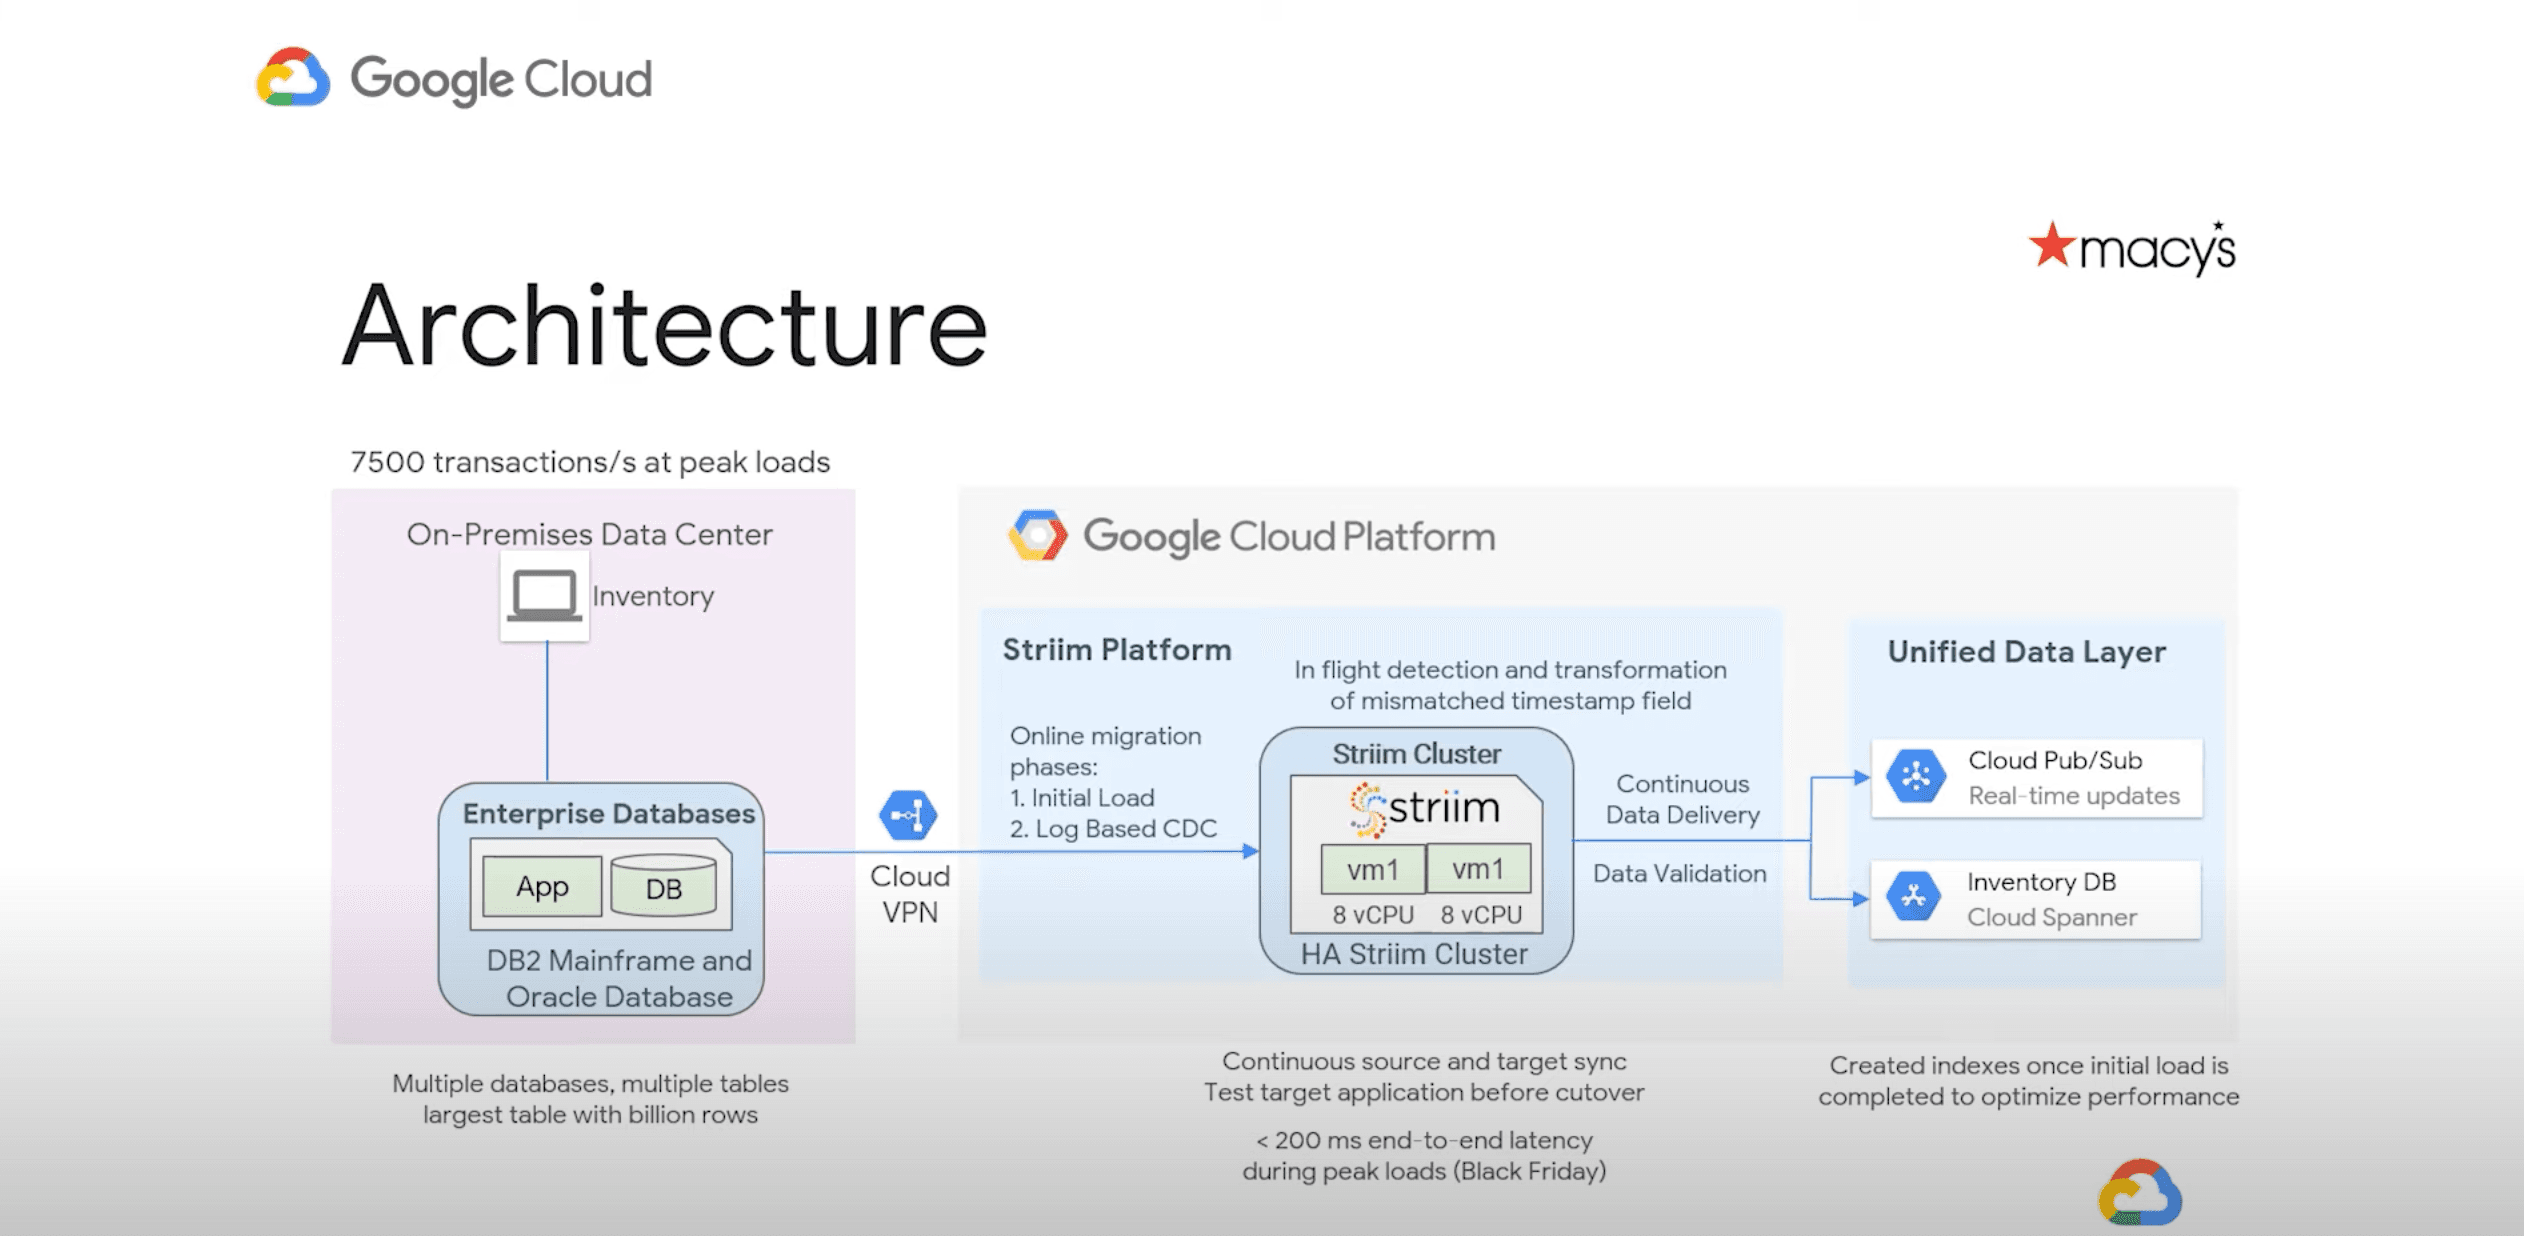
Macy’s is a large department store chain that operates over 500 locations across the USA. It collects customer data based on a range of interests and preferences, including demographics, seasonality, location, price range, and more.
When it came time to modernize its platform, one of Macy’s main goals was streamlining its order and inventory management systems to improve the customer experience.
Macy’s also needed a streaming (aka real-time) data pipeline so they could track inventory levels and orders to prevent out-of-stock items or surplus inventory, which is critically important during the holidays and huge sales like Black Friday.
At the same time it was building its data pipeline, Macy’s also transitioned to a cloud data warehouse using Google Cloud database services.
By building a new, real-time, modern data pipeline in a hybrid data environment, Macy’s could provide a unified customer experience regardless of whether you were shopping online or in-store.
AgencyAnalytics: Combining 80+ Marketing Platforms in a Single Platform
Reporting on client accounts used to take hours upon hours of tedious work to copy and paste data and screenshots from various platforms for each and every client.
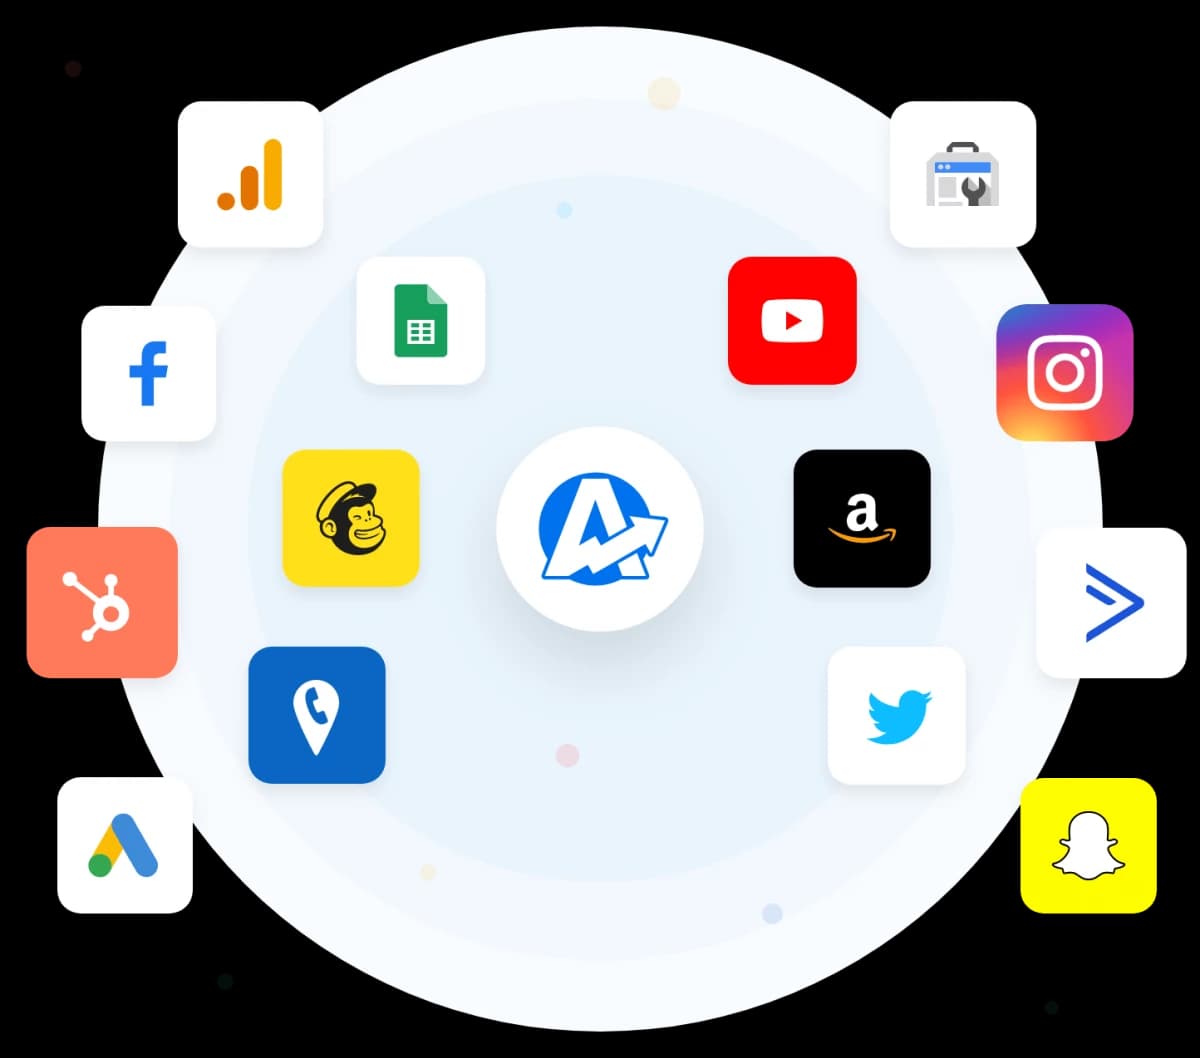
From Facebook Ads spend to Google Analytics traffic data to Google Ads conversions, comparing and contrasting performance was a challenge for even the most experienced agencies.
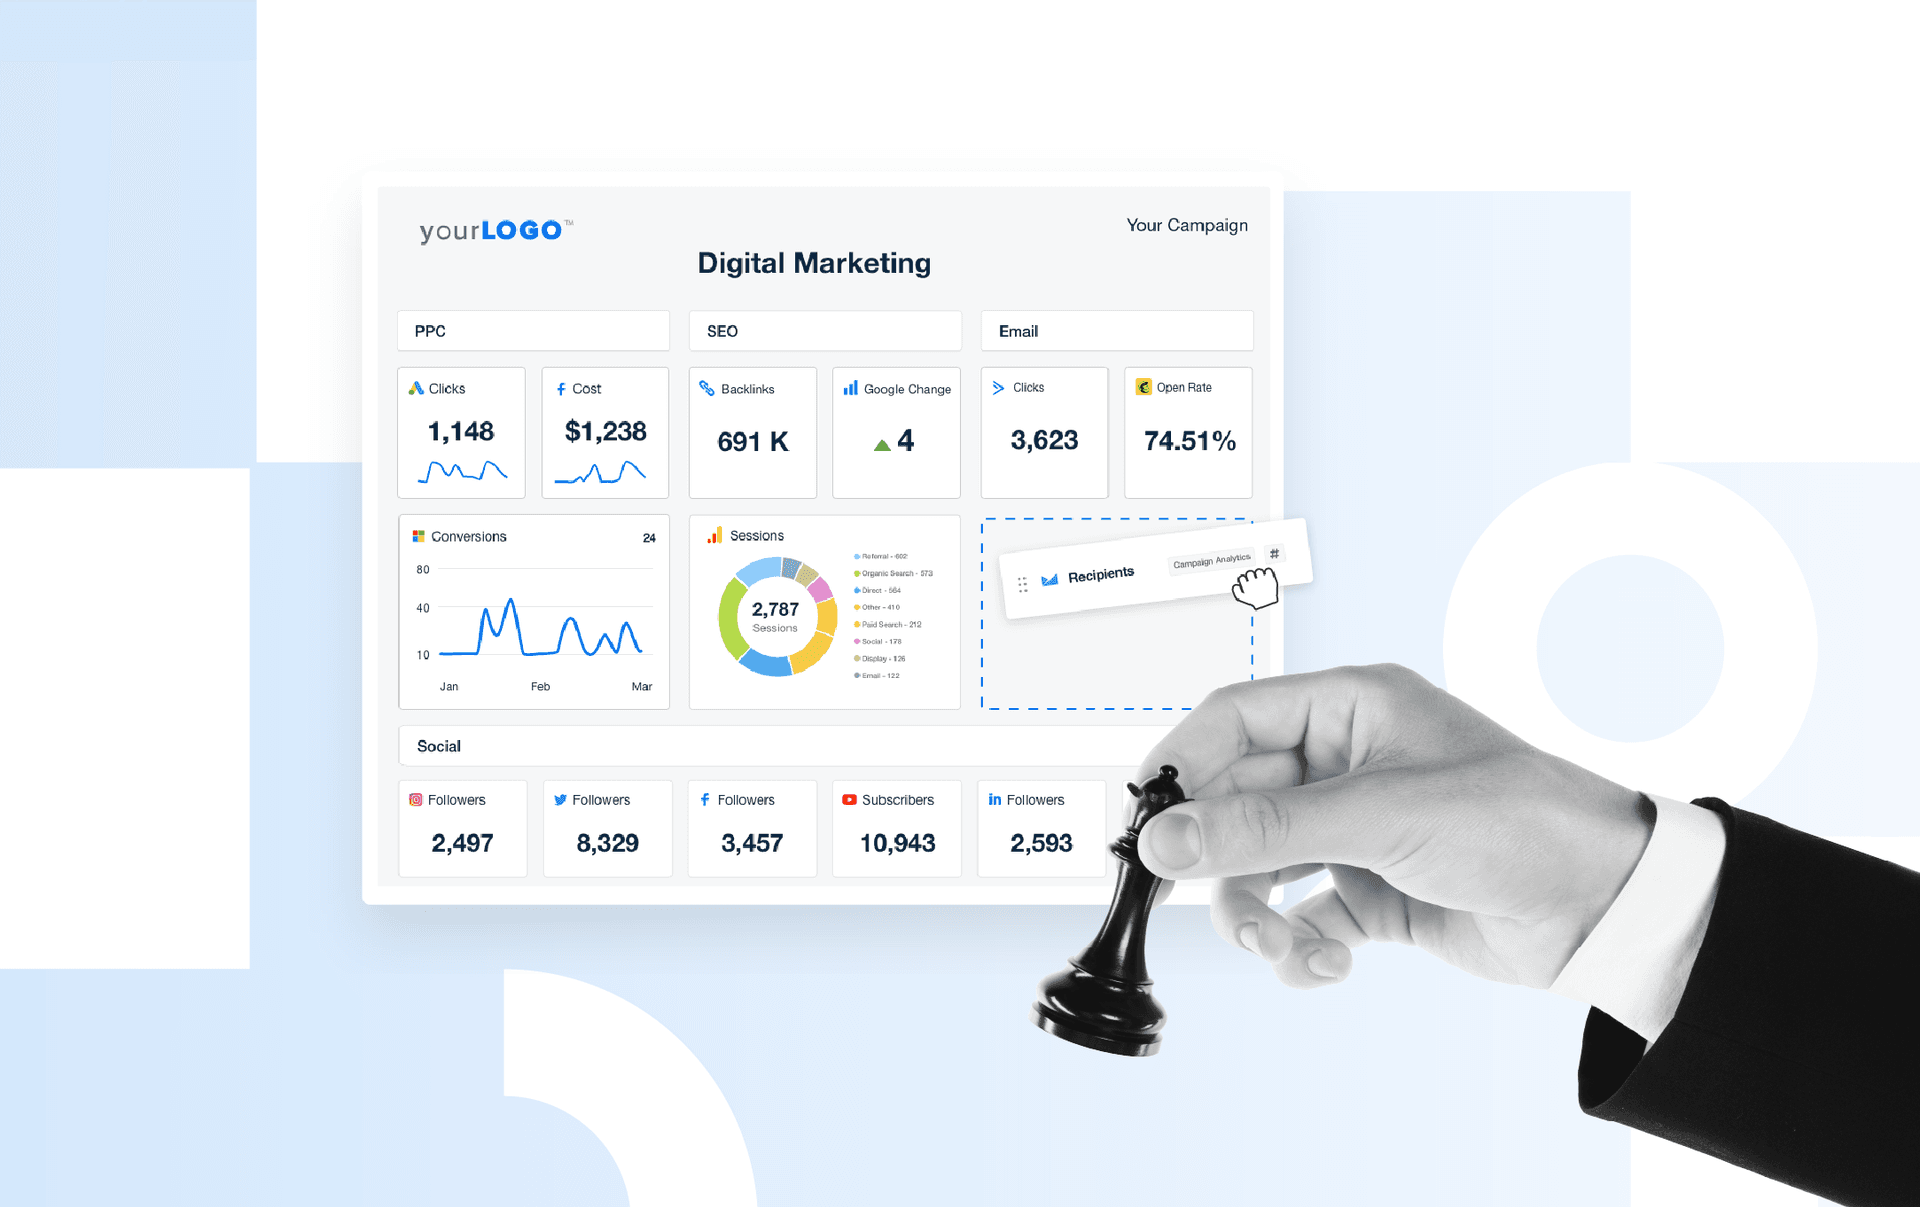
With the streamlined marketing data pipeline from AgencyAnalytics, all of that data is available in a single source. Agencies create dashboards and reports to highlight the successes from specific platforms as well as custom metrics to compare data points across multiple programs, all with just a few clicks.
Facebook: A Single Source Feeds Multiple Pipelines
Sometimes, a single data source can feed multiple data pipelines, like in this example from Facebook.

A single Facebook comment could feed a real-time report that monitors engagement. At the same time, that comment could also feed an opinion mining app that analyses the comment’s sentiment. In addition, the comment could even be feeding another app that tracks where in the world the comments are coming from.
How to Build a Data Pipeline
Usually, building a data pipeline falls on the shoulders of data engineers and data scientists.
To create your own data pipeline, you’re going to need access to the original data sources, processing steps, and a destination. However, that is too much heavy lifting for most agencies. Why build your own when you can use one that’s built for you? Instead, turn to systems that already create these data pipelines for you, such as the AgencyAnalytics reporting platform.
AgencyAnalytics collects data from 80+ integrations and pulls them into their own marketing dashboard. This way, key metrics are configured into widgets and visual representations that are easy to analyze and report on. The dashboards are fully-customizable for you to strategically drag and drop the widgets into place with the right audience in mind.
Use all of this data to craft a story for clients to quickly and easily understand what is happening with their campaigns. After all, Data storytelling is one of the best ways to communicate the insights gained from the data.
Each and every data point tells a story, but it’s up to your agency to analyze and interpret it, much like how we connect the dots in a picturebook to see the bigger picture. Data storytelling helps connect the dots through the use of a narrative and data visualization, which runs the gamut of graphs, charts, and maps we use to make data easier to process and understand.
Key Takeaways
A data pipeline extracts data from multiple sources, including web analytics tools, CRM systems, and marketing platforms. Once the data is extracted, it is transformed into a format that is suitable for reporting.
For example, the data might be aggregated, filtered, or organized into a specific order. The transformed data can then be loaded into a reporting tool, such as AgencyAnalytics so that it can be easily analyzed and acted upon.
Automate Your Client Reporting
Using a tool to consolidate all your data integration can help streamline your data processing automation, especially when it comes to client reporting. The difference between manual and fully automated reporting is like night and day.
AgencyAnalytics is a fully automated reporting platform that features seamless integrations with over 80 leading marketing platforms to free up your team so they can focus on what they do best–whether it’s helping you get more clients or dazzling the ones you already have.
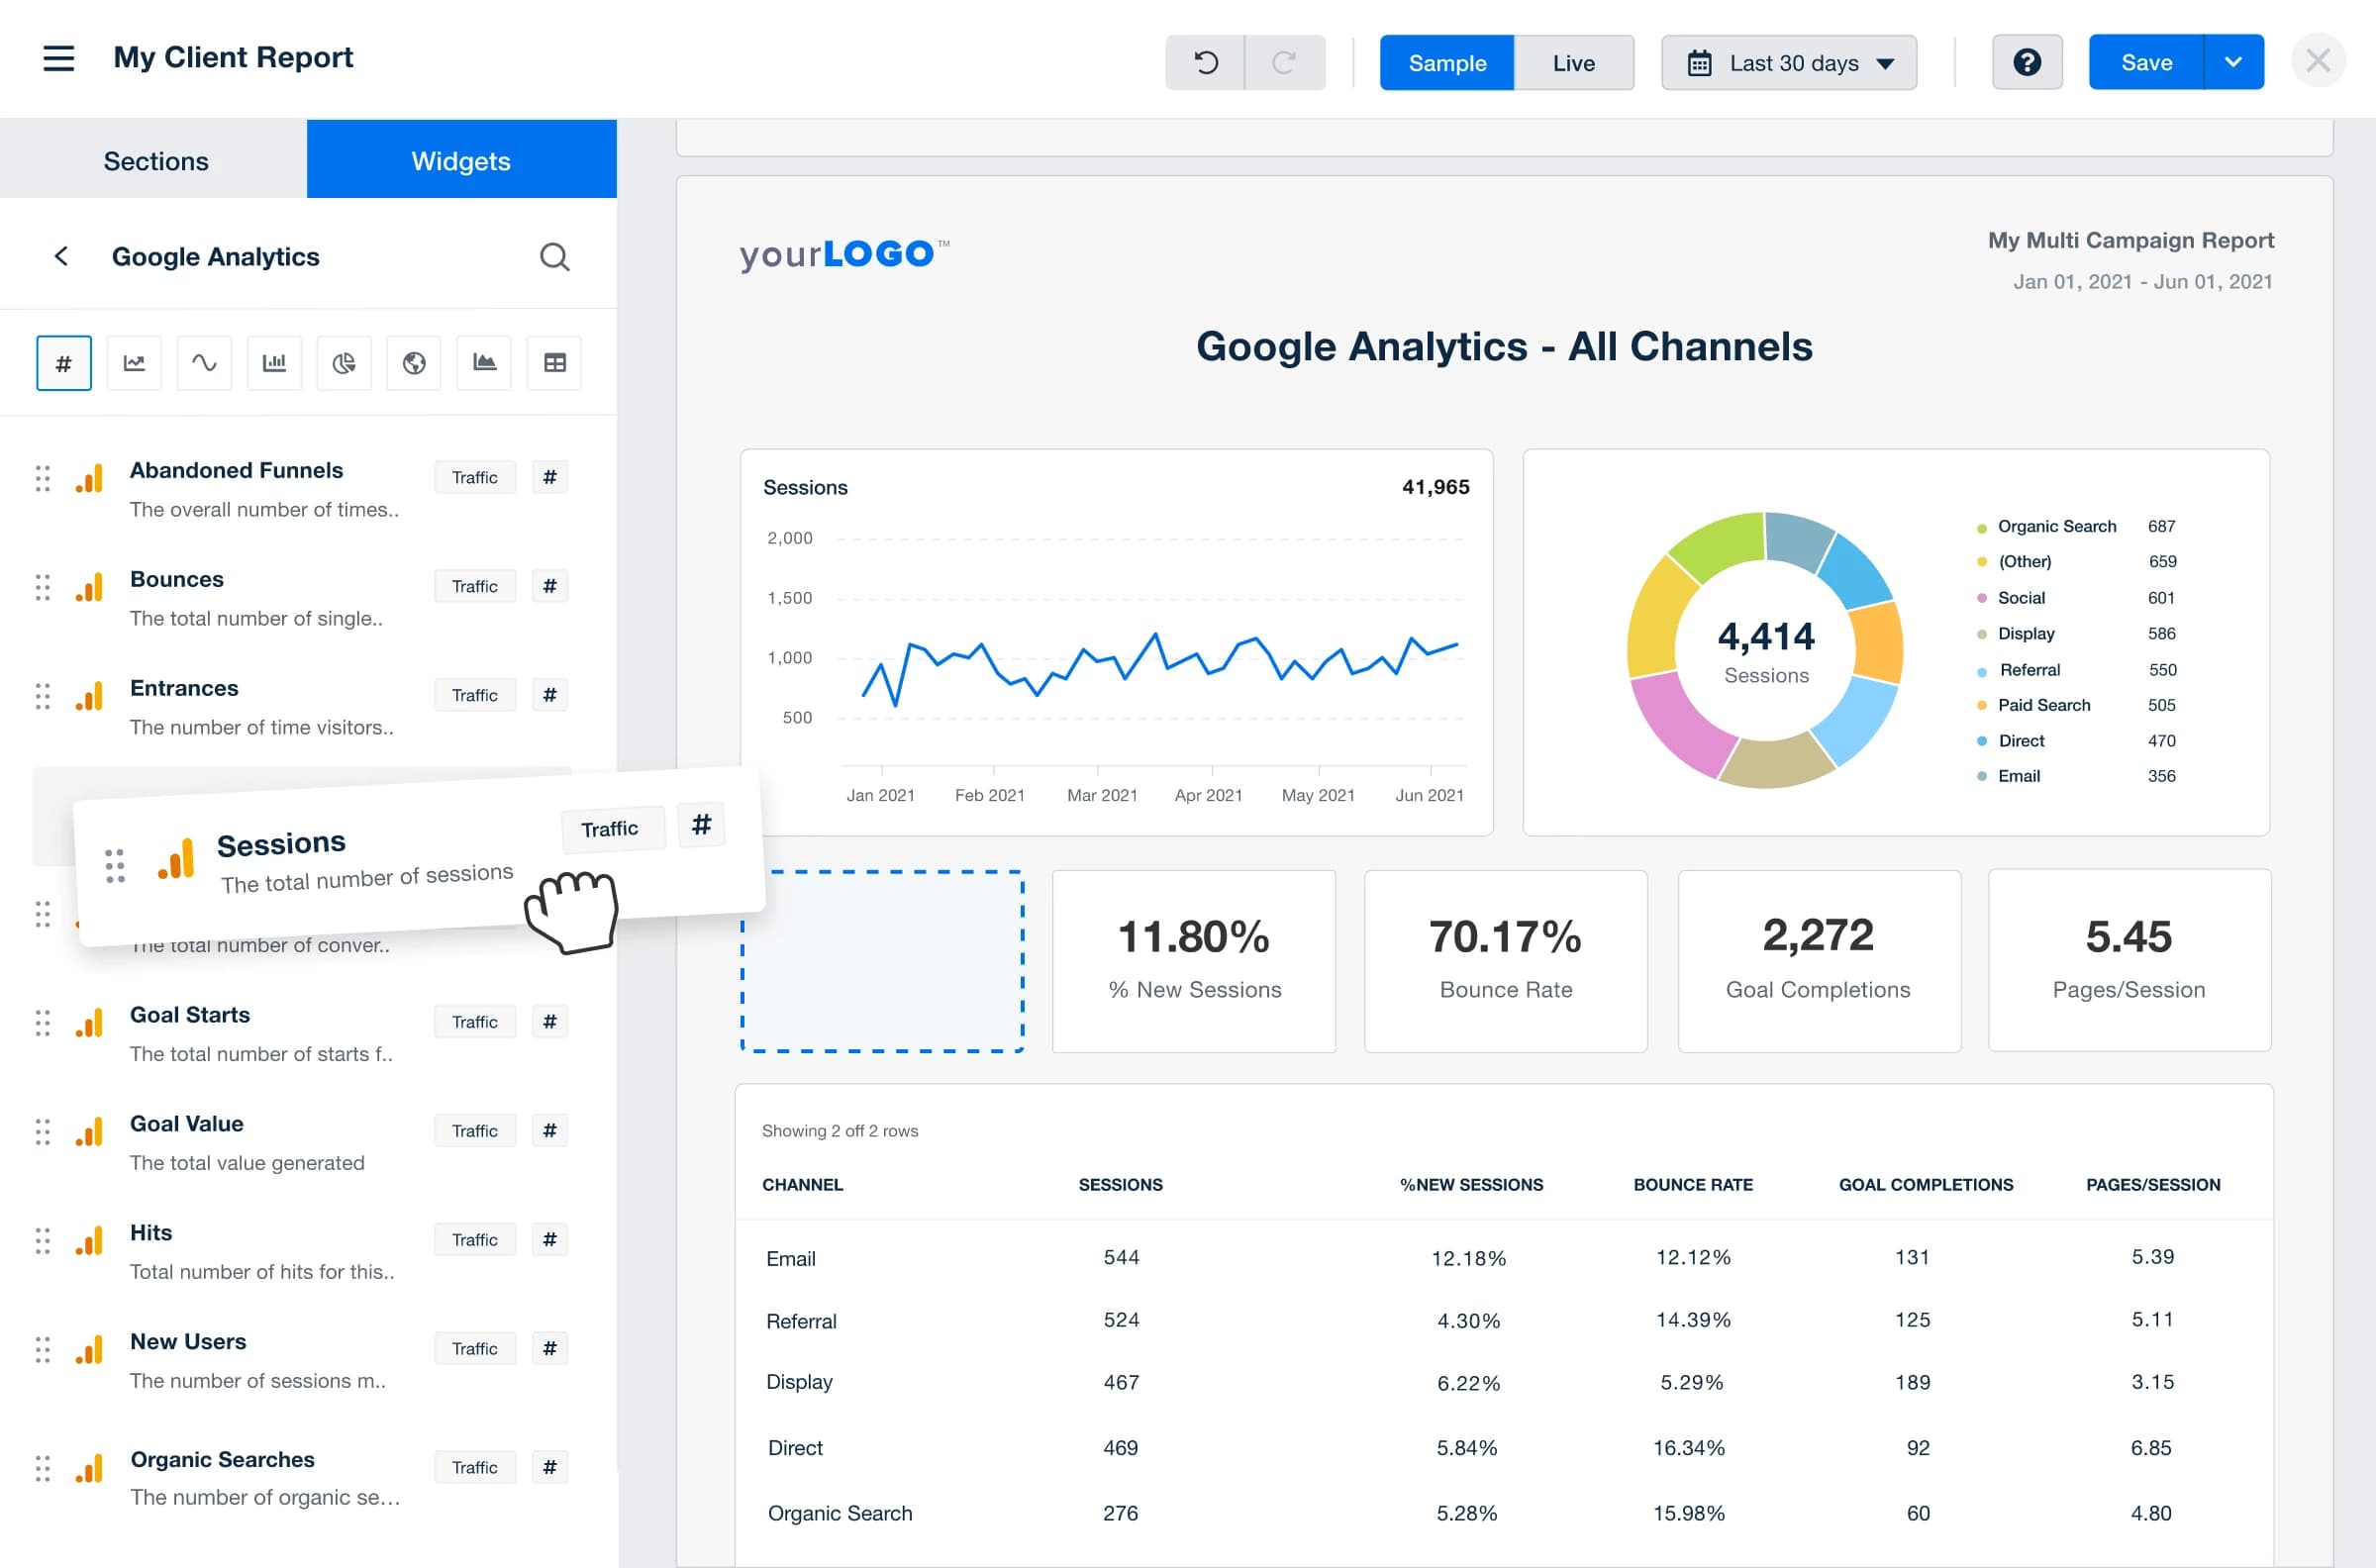
If you’re particular about how your reports look, don’t worry. With AgencyAnalytics’ custom marketing dashboards, you have full control over the layout with customizable widgets and a drag-and-drop editor.
The cherry on top? It’s all white label reporting, which means you can add your agency’s branding to all of your client reports because the goal is to make your agency look good.
Start your free 14-day trial today to streamline your agency’s dataflow workflow.

Written by
Michael is a Vancouver-based writer with over a decades’ experience in digital marketing. He specializes in distilling complex topics into relatable and engaging content.
Read more posts by Michael OkadaSee how 7,000+ marketing agencies help clients win
Free 14-day trial. No credit card required.


