LinkedIn Ads Reporting Tool & Analytics Dashboard

Bring LinkedIn Ads data into focus
Go beyond default LinkedIn Ads reports. The LinkedIn Ads reporting tool transforms raw campaign metrics into beautiful, client-friendly analytics dashboards that reveal what’s working, what needs optimizing, and where your ad budget delivers the best results.
PPC Metrics
Track CPC, ad impressions, clicks, and more in a holistic marketing dashboard
Monitor Conversions
Conversions are king! Highlight your agency's deep impact on your clients' bottom line
Audience Insights
Analyze industry, job position, and location of your target audience
Analyze Performance
Compare performance across multiple PPC networks in a single, intuitive report
Easily Monitor Campaign Performance
Manage multiple clients across a variety of platforms? Staying up-to-speed with all as a campaign manager can be a struggle! Make it easy to monitor campaign performance for every client with a single, powerful client reporting platform.
Identify and track performance metrics and reduce the number of times your agency has to log in and out of client platforms to gather campaign metrics.

Explore All Available LinkedIn Ads Metrics
- Action Clicks
- Ad Unit Clicks
- Clicks
- Contact Info Shares
- Conversion Rate
- Conversion Value
- Conversion Value Currency
- Conversions
- Cost
- Cost Currency
- Cost Per Conversion
- Cost Per Conversion Currency
- Cost Per Lead
- Cost Per Lead Currency
- CPC
- CPC Currency
- CPM
- CPM Currency
- CTR
- Date
- Engagement Rate
- Follows
- Impressions
- Lead Form Completion Rate
- Lead Form Opens
- Leads
- Likes
- Open Rate
- Opens
- Sends
- Shares
- Total Engagements
- Video Complete Views
- Video Midpoint
- Video Views
- Viral Lead Form Opens
- Viral Leads

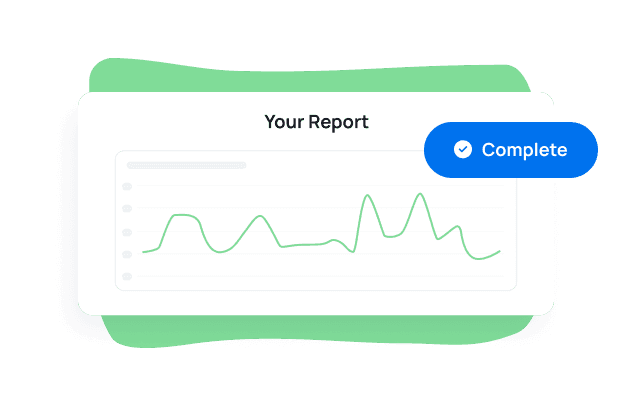
Intuitive Bottom Line Analysis
Track & Visualize Ad Performance With Clarity
Monitor every key metric—clicks, conversions, CTR, and cost—across all client accounts in one dashboard. The LinkedIn Ads analytics tool provides your agency with a comprehensive, at-a-glance view of ad performance, eliminating the need to switch between platforms or export reports.
Quickly identify top-performing ad creatives, track engagement trends, and optimize for higher ROI using clear data visualizations your clients will actually understand.

Actionable Audience Insights
Understand Who’s Engaging and Why It Matters
Go beyond clicks to understand audience quality. Analyze LinkedIn Ads demographics by industry, job function, seniority, and company size to ensure your campaigns reach the right professionals.
Use these detailed performance metrics to refine targeting, allocate ad spend strategically, and deliver high-intent leads that align with your clients’ business goals.

Custom Dashboards, Up-to-Date Results
Show Clients Their Campaign Performance Live
With live dashboards, agencies and clients access up-to-date data on impressions, conversions, and spend anytime—without logging into multiple platforms.
Track video ads, lead generation forms, carousel image ads, and engagement metrics in one view. Deliver total transparency and eliminate confusion about campaign performance, all within a fully branded client experience.

Show Clients Their Post-Markup PPC Cost
Add PPC Markup to Client Reports
If you charge PPC clients a percentage of spend, best practice is to include that markup percentage in any cost/spend metrics that you report to clients. Analyzing how ads perform is key for evaluating the effectiveness of advertising campaigns, but the total cost (including your agency's markup) is what will impact their bottom line.
Easily add either a single margin % account wide, or to configure a custom margin for each individual customer.

Effortless Client Reporting
LinkedIn Ads Reporting, Simplified
Managing LinkedIn Ads campaigns is challenging enough without adding complicated reporting to the mix. With AgencyAnalytics, generating clear, insightful LinkedIn Ads reports is as easy as a few clicks.
Automatically pull in campaign data, customize the layout to match your client’s needs, and present metrics that matter—all in one streamlined platform. Save time on every report while keeping your clients fully informed and confident in their campaign’s performance.

AI-Powered Optimization
Uncover LinkedIn Ads Campaign Trends Instantly With AI Insights
Skip manual analysis and let AI do the heavy lifting. With AgencyAnalytics’ AI suite, your agency automatically identifies underperforming campaigns, ad fatigue, or cost inefficiencies.
Ask AI surfaces actionable insights—from audience segments to keyword opportunities—while AI Summary transforms complex performance data into client-ready takeaways.
Spend less time crunching numbers and more time driving strategy.

Built for Marketing Agencies
Trusted by 7,000+ Agencies Worldwide
Join thousands of agencies using AgencyAnalytics to streamline LinkedIn Ads reporting and scale client communication.
From boutique teams to enterprise firms, marketers trust our white-label dashboards, AI-powered analytics, and cross-channel insights to deliver polished, shareable reports that prove ROI—and save hours every reporting cycle.

Discover the white label reporting tool trusted by 7,000+ marketing agencies.


FAQs About LinkedIn Ads Reporting for Marketing Agencies
B2B ad performance deserves clarity—not complexity. These FAQs help agencies pinpoint campaign ROI, sharpen audience strategy, deliver branded reporting, and scale across accounts.
LinkedIn Campaign Manager gives you in-platform analytics, but it’s not built for agencies managing multiple accounts.
AgencyAnalytics turns those native metrics into automated, branded dashboards that scale across clients. Track impressions, clicks, conversion rates, and ad spend in one platform—without logging in and out of different ad accounts.
Unlike other LinkedIn ads reporting tools, AgencyAnalytics makes it easy to combine organic LinkedIn analytics and ad performance metrics, add custom widgets and commentary, and generate white-labeled, shareable reports. It’s everything agencies need to monitor performance and prove ROI in one place.
It only takes a few minutes. Connect your clients’ LinkedIn Ads accounts once, and campaign data—impressions, clicks, conversions, and ad spend—syncs automatically.
From there, customize dashboards with drag-and-drop widgets, visualize trends with bar charts and line graphs, and schedule recurring reports for clients.
Once set up, all your LinkedIn Ads analytics update in real time—no CSV uploads, no manual work—so your agency focuses on strategy and results, not reporting time.
Monitor metrics that tie ad spend to lead generation and professional reach. Core metrics include Impressions, Clicks, CTR, Cost, Conversions, Conversion Rate, Cost Per Conversion, plus audience-level insights—job position, industry, and company size. These key LinkedIn ads analytics are easily surfaced in a live LinkedIn Ads dashboard or professional client report.
Launch with a LinkedIn Ads dashboard template or build a bespoke layout using drag‑and‑drop widgets. Rearrange metrics like Conversions, Cost Per Conversion, Impressions, CTR, and key demographic breakdowns (industry, job function) to focus on the most important data. Include annotated analysis to explain campaign adjustments or targeting shifts, so your reporting tells a clear B2B performance story.
Yes. Agencies schedule report delivery—daily, weekly, or monthly—so clients receive fresh LinkedIn performance data without manual effort. Data syncs automatically, ensuring metrics like Conversions and CTR stay current and reflect the latest campaign success.
Absolutely. With AgencyAnalytics, agencies connect each LinkedIn Ads account alongside other ad accounts—like Google Ads, Facebook Ads, and Twitter Ads—to create fully unified, cross-channel dashboards.
All campaign data—including impressions, clicks, click-through rate, conversion tracking, and conversion results—flows into a single report with detailed performance metrics that reveal how every channel contributes to your clients’ success.
Build your own fully customizable reports with drag-and-drop widgets, dropdown menus, and column views to filter by date range, job title, or specific audience segment.
Integrate even more data sources like the Google Sheets integration to layer in external performance data or monthly benchmarks.
Whether you’re tracking carousel image ads, video formats, or event registrations, the system automatically updates data to maintain accuracy and consistency across channels. Combine this with AI insights to instantly surface opportunities and highlight which platforms drive the most qualified leads and post-click conversions.
Bringing all your PPC reporting under one roof so you can focus on generating leads, not gathering data.
Apply agency branding—logo, colors, and custom domain—to live dashboards, client portals, and periodic reporting. Whether clients view a live dashboard link or receive a scheduled report, the entire experience reinforces the agency brand—not the underlying reporting tool.
Agencies scale reporting through two approaches: maintaining individual client dashboards focused on their campaign KPIs, and building roll‑up dashboards that spotlight core metrics—such as Total Spend, Conversions, and CTR—across the client portfolio. This enables strategic oversight without sacrificing account-level detail.
More integrations
Everything your agency needs
Automated Reports

White Label Dashboard
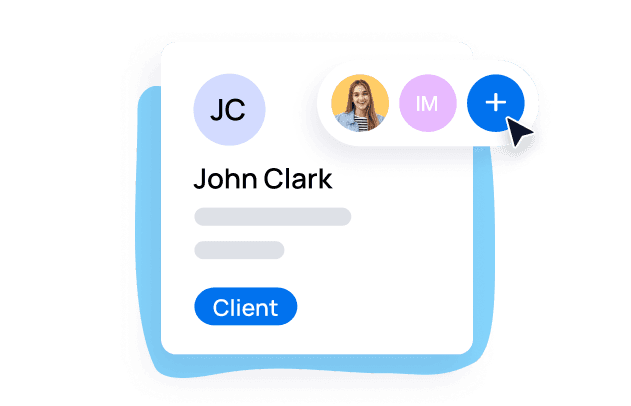
Client & Staff Access

Connect Your Data
AI Powered
