LinkedIn Ads Dashboard for B2B Campaign Tracking and Optimization
Custom LinkedIn Ads Dashboards as Unique as Your Agency
Customizable LinkedIn Ads Dashboard That Clarifies Ad Performance
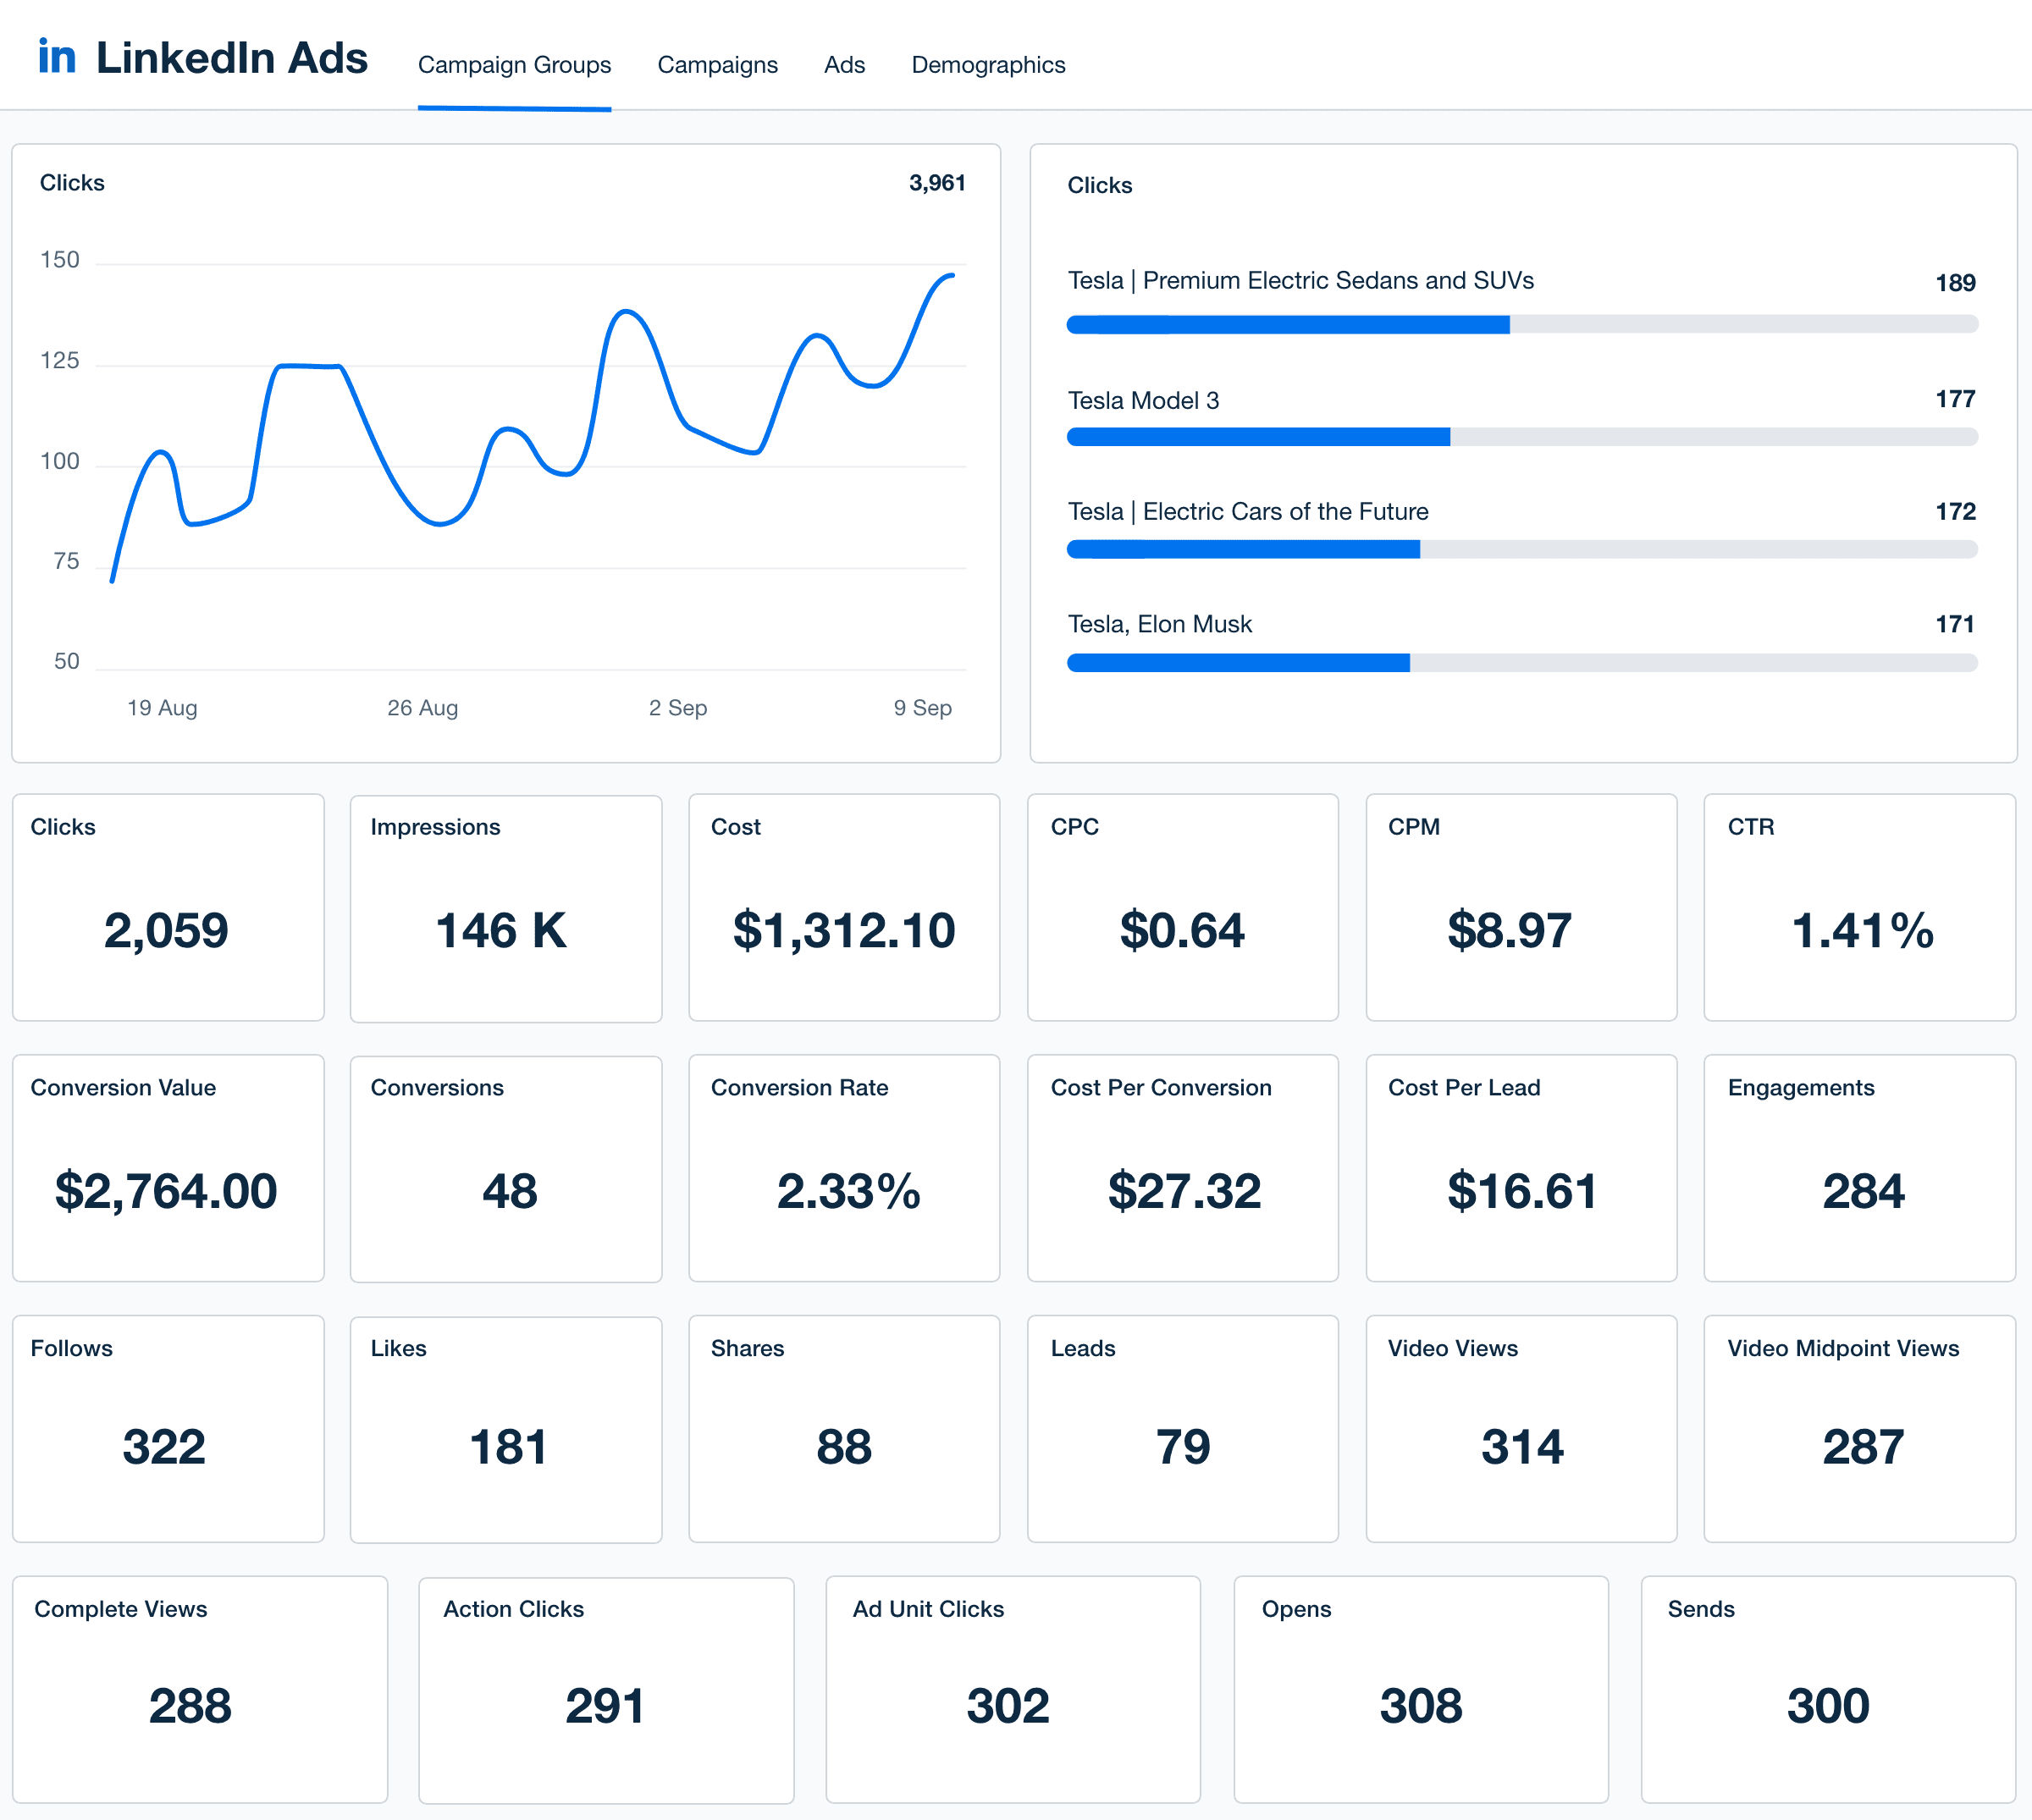
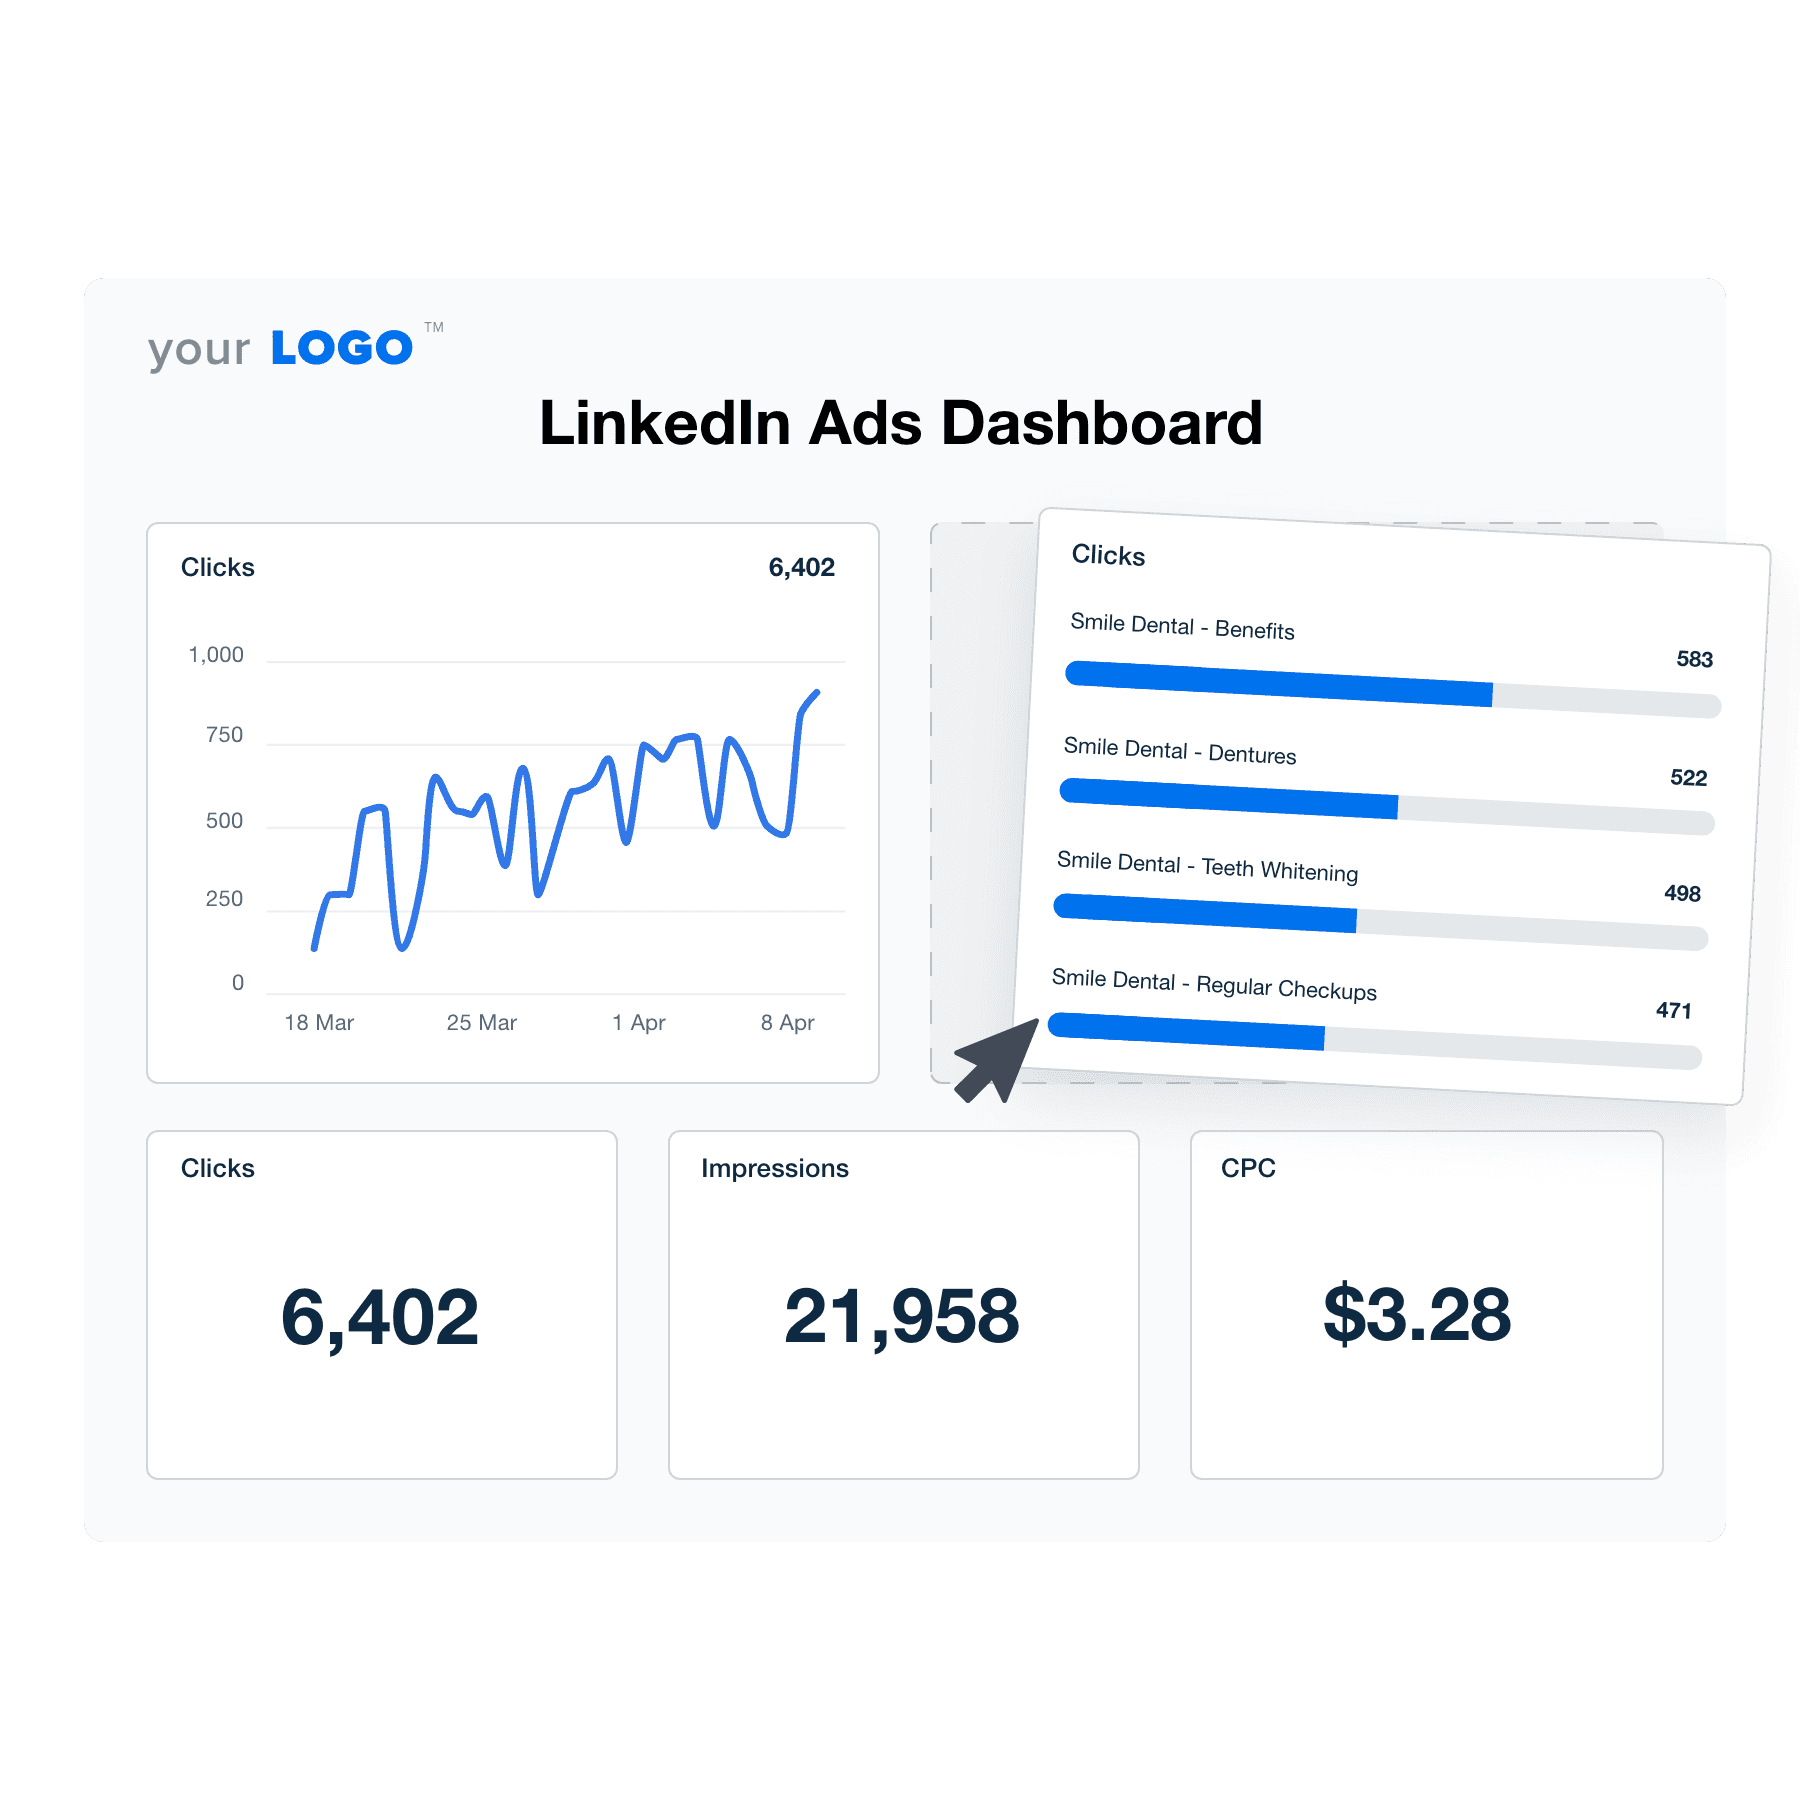
A branded LinkedIn Ads dashboard consolidates ad performance data, making it easier to track engagement, click-through rates, and cost efficiency. Customize the experience for each client with flexible layout options, white label branding, and campaign-level reporting.
Provide clients with a live, up-to-date view of their LinkedIn Ads campaigns while streamlining internal analysis. With automated reporting, agencies spend less time compiling data and more time refining ad strategies to improve performance.
Custom LinkedIn Ads Dashboards as Unique as Your Agency
Instantly Access All Your Clients’ Data From LinkedIn Ads
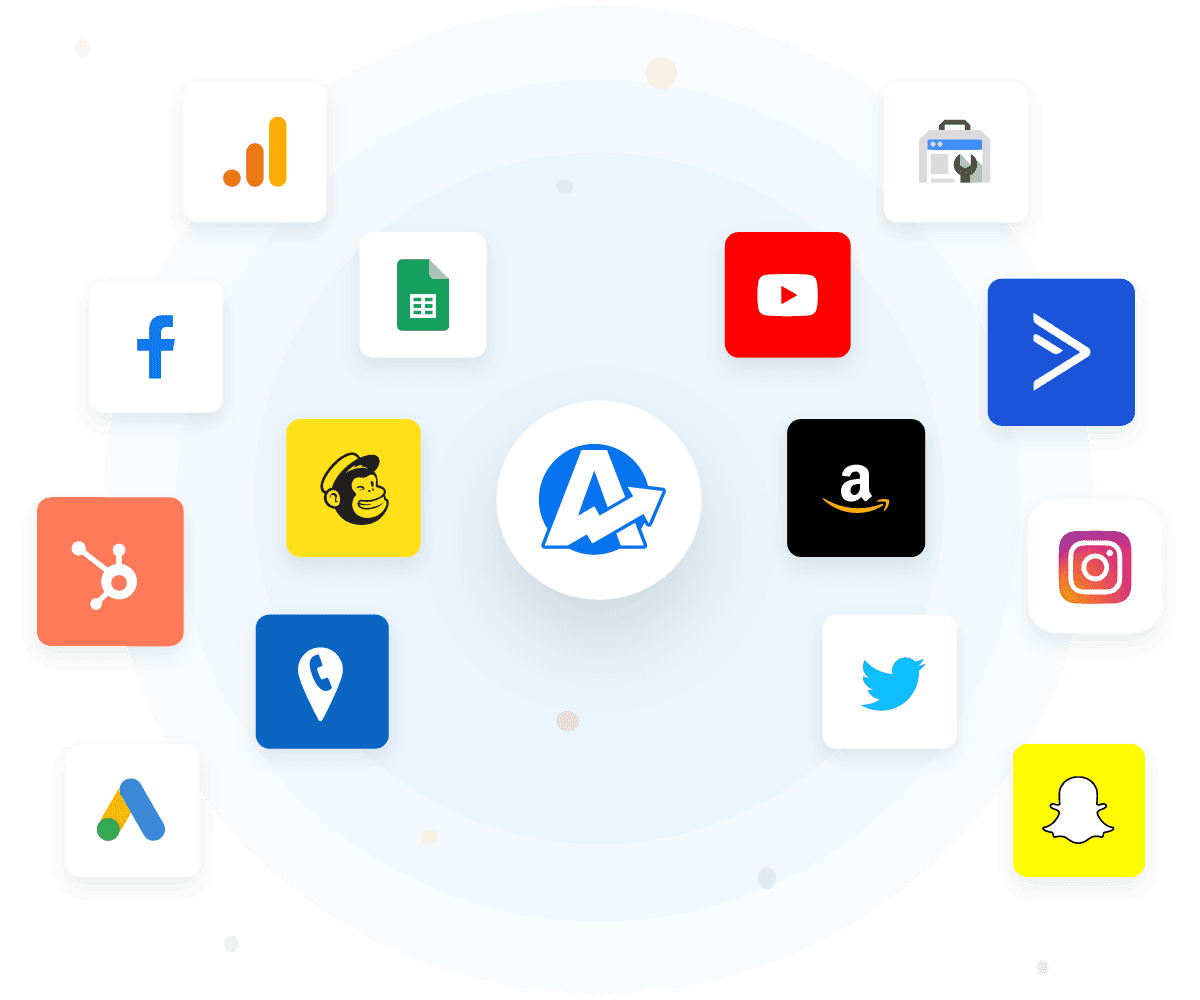
No more manual updates or piecing together metrics from various sources to report on advertising performance. Effortlessly pull in real-time data from LinkedIn Ads and 80+ platforms, including Google Ads, Facebook, Instagram, and more... all without having to sign into each client’s Campaign Manager account!
Spend more time strategizing and less time chasing data. Ensure clients receive actionable results that matter–all without breaking a sweat.
White Label Your LinkedIn Ads Dashboards
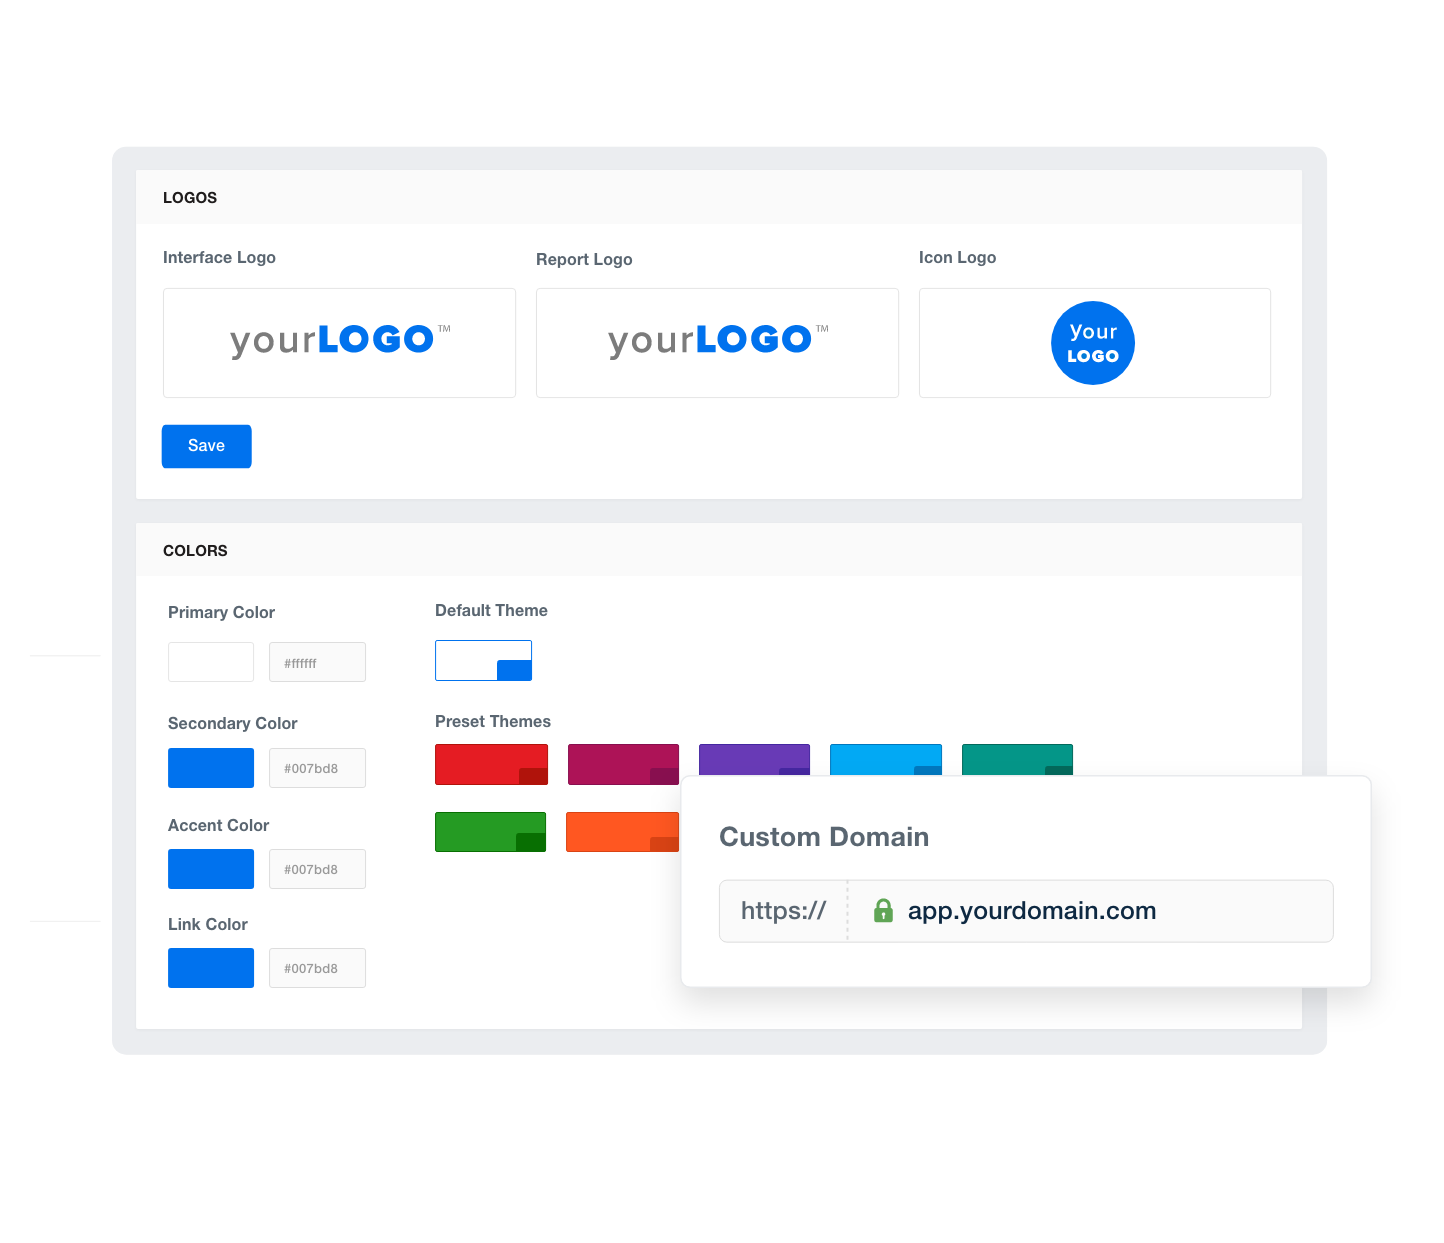
Create dashboards and reports that look like they were crafted in-house. Use white labeling to infuse your branding, reinforce professionalism, and enhance each client interaction.
Share data-driven insights while demonstrating your attention to detail. Present a polished image and inspire confidence in your ability to drive results.
Provide Granular Insights With Custom Metrics
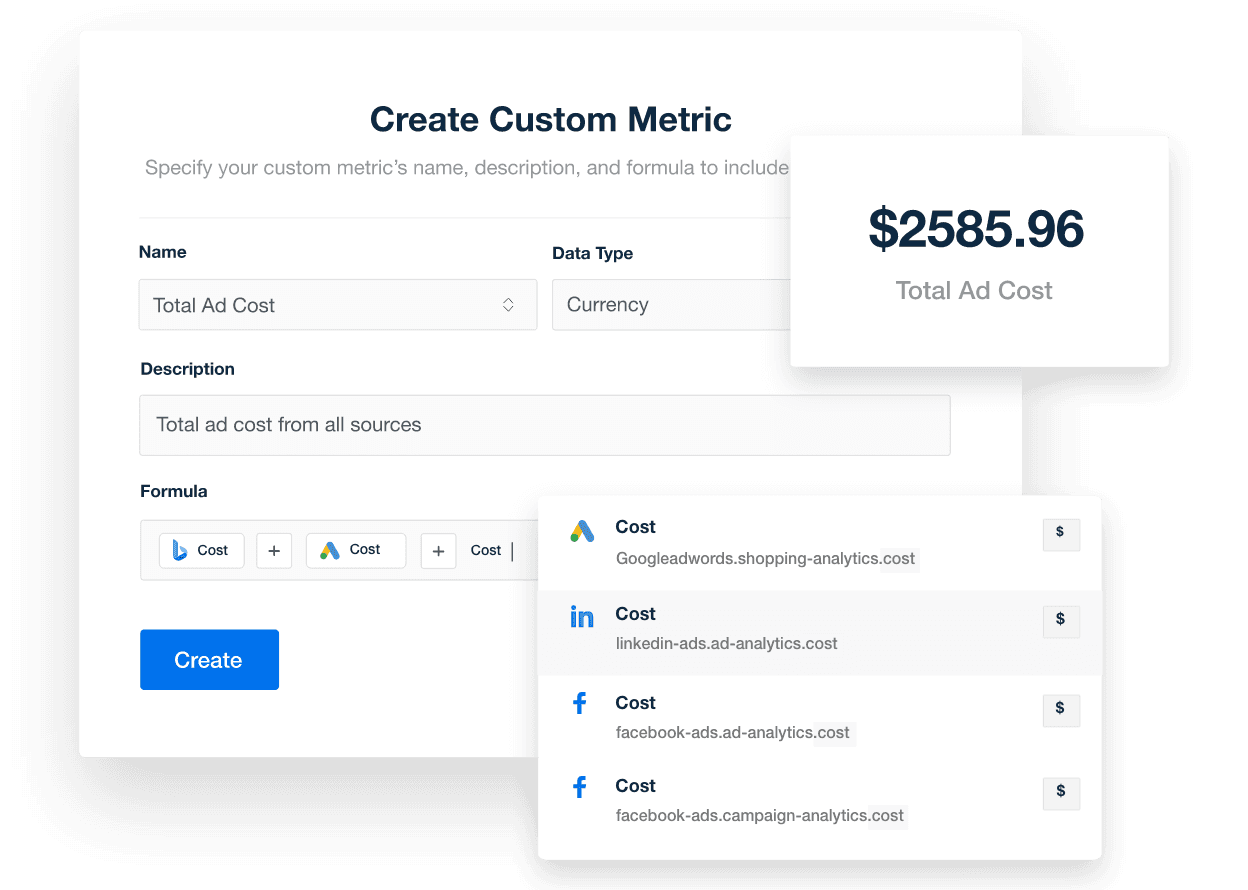
Success looks different across clients. With custom metrics, highlight the KPIs that matter most. Whether it’s tracking a unique conversion path or a broader lead gen goal, present data that aligns with business objectives.
Blend data points and create unique formulas, all with minimal hassle. Show clients you’re invested in their success.
Monitor All of Your Clients at a Glance
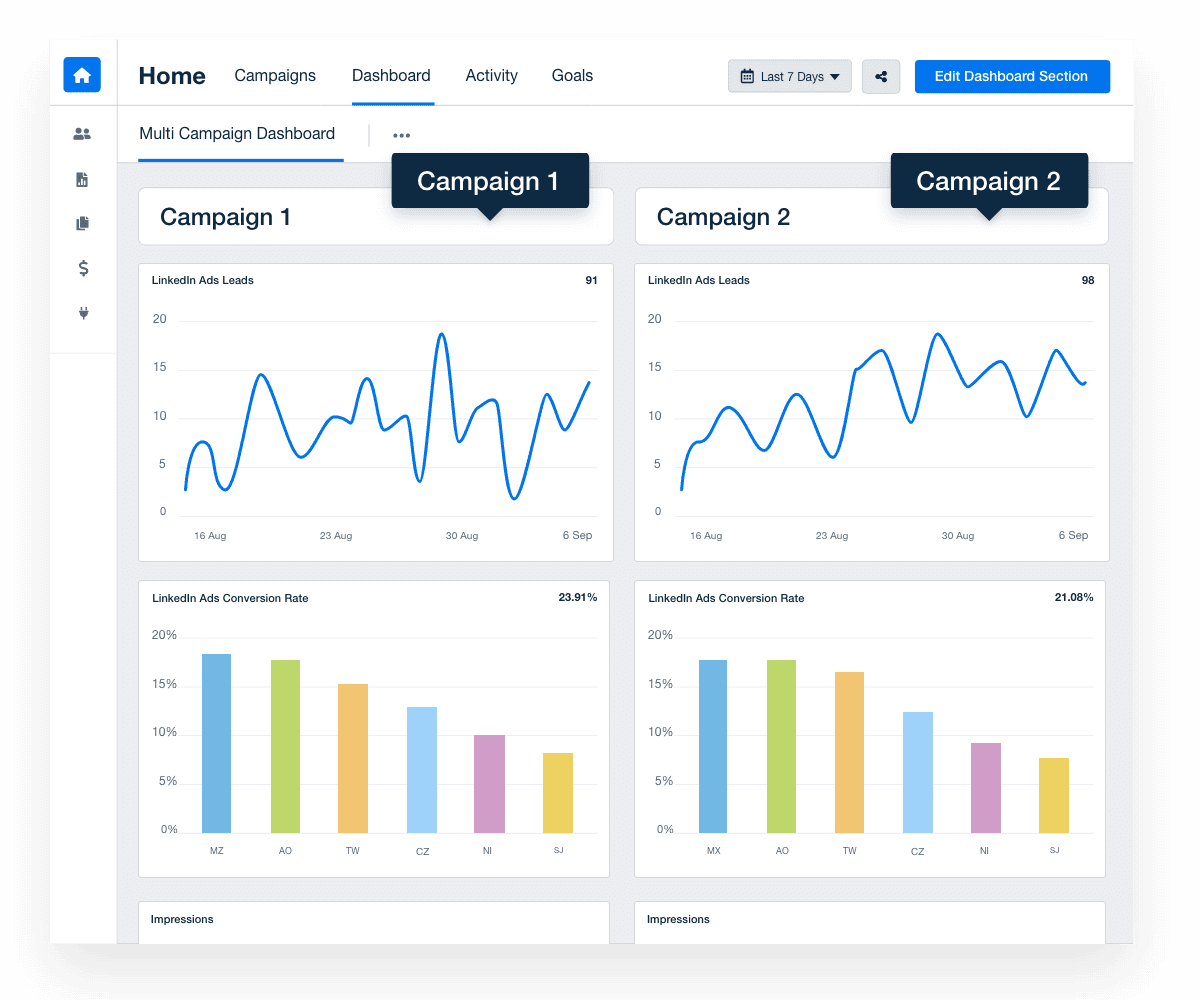
Easily switch between client campaigns, track individual performance, and ensure no detail slips through the cracks. That’s the power of a multi-client dashboard.
With this centralized view, your team stays organized, prioritizes tasks, and quickly responds to client needs. Maintain a bird’s eye view of campaign performance at all times.
Customer Support is Our Top Priority
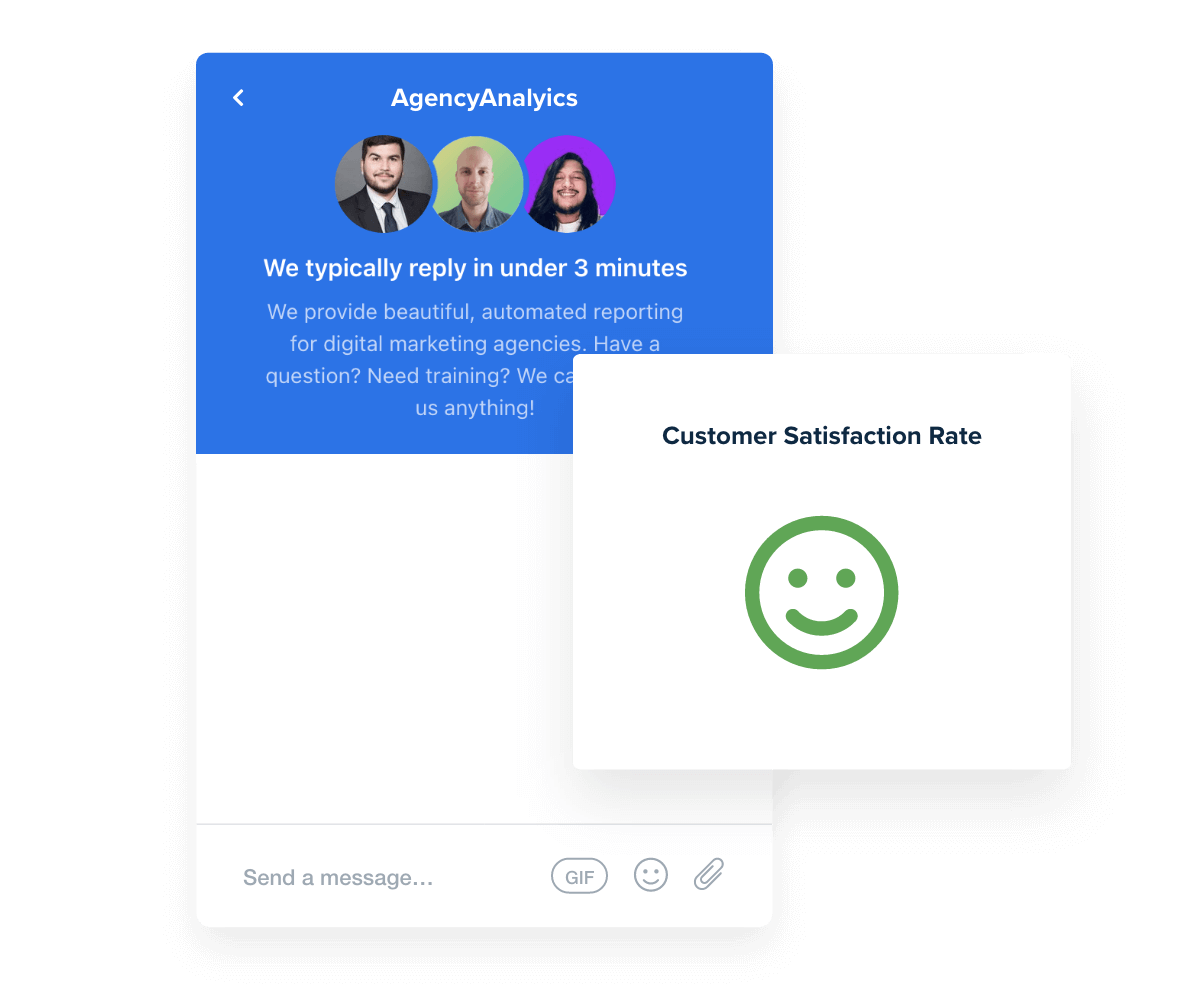
Your agency’s success is our top priority, which is why we're here to support every step of the way. Our live chat is available 24/5, with an average response time under 3 minutes.
Don’t take it from us–our satisfaction rate is consistently rated above 95%. Whether you need support to set up a LinkedIn Ads dashboard or add customization, we’re here to help. You care about your client’s success. We care about yours.
Streamline Reporting and Focus On What Matters
Billable time is a precious commodity. No need to use it for manual data collection–use a LinkedIn Ads dashboard to do the work for you. Effortlessly pull in data from LinkedIn Ads, Google Analytics, Facebook, and more! Give your clients a comprehensive view of marketing performance in one place.
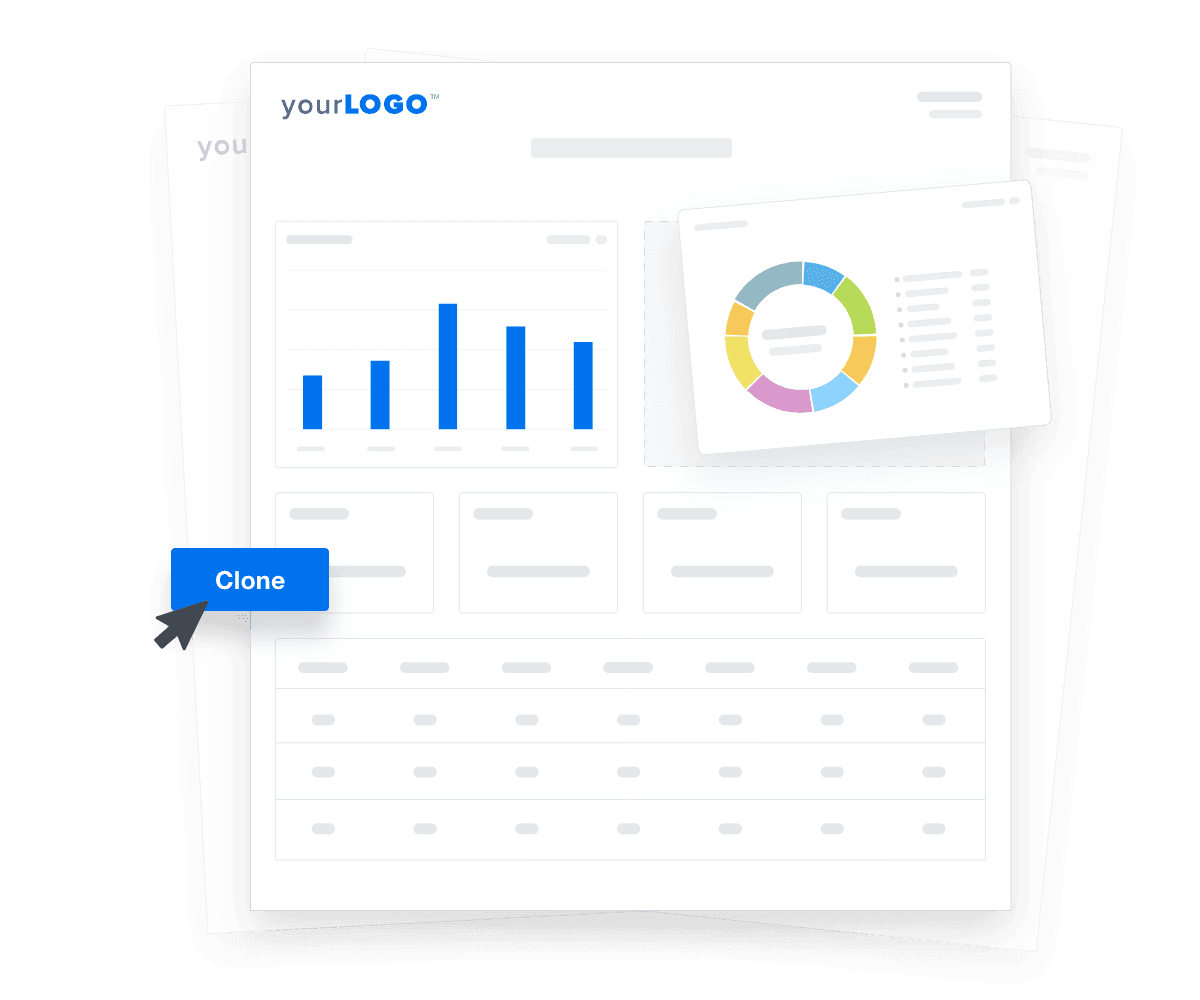
Tailor each dashboard to fit your client’s unique goals, and easily replicate them to accelerate onboarding. Spend less time building reports and more time scaling your agency’s success.
9 Sections To Include in a LinkedIn Ads Dashboard
When building a LinkedIn Ads dashboard, it’s important to focus on the performance metrics that matter most to your clients. With AgencyAnalytics, present these insights at the campaign group and ad set levels. Get as high-level or granular as you need!
FAQs About Custom LinkedIn Ads Dashboards
Still have questions about how to create and use custom LinkedIn Ads Dashboards? Don’t worry, we’ve got you covered.
A LinkedIn Ads Dashboard is a reporting interface that consolidates data from your client’s LinkedIn Ads account. It helps agencies track LinkedIn ads performance by visualizing ad spend, impressions, ad clicks, and conversions—providing clear, actionable insights into campaign success.
To create a white label LinkedIn Ads Dashboard, connect your client’s LinkedIn Ads account to a platform like AgencyAnalytics, select a layout, and apply your agency’s branding. On select plans, you can white label the dashboard with your logo and domain, creating polished dashboard examples tailored for each client.
Track key metrics such as ad clicks, impressions, ad spend, and conversions. The dashboard helps you compare metrics across campaigns, analyze performance trends, and identify optimization opportunities—all without relying on raw exports or struggling with Google Sheets.
The dashboard improves LinkedIn ads performance by offering a clear view into what’s driving results. Agencies can analyze performance across ad sets, surface actionable insights, and optimize LinkedIn campaigns in real time to drive improved business results for their clients.
Yes. Customize the dashboard to highlight the LinkedIn ads performance metrics each client values most. Whether you're reporting on ROAS, lead gen, or brand awareness, the dashboard delivers visual, client-ready views packed with actionable insights.
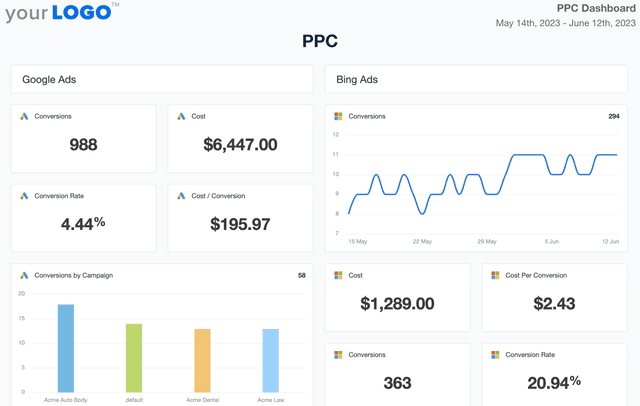
Popular dashboards include the white label PPC dashboard for tracking PPC performance, the social media dashboard template for measuring social media impact, and the SEO reporting dashboards for SEO campaign reporting. Agencies also use the web analytics dashboard to provide web analytics overviews and the digital marketing reporting dashboards to review digital marketing metrics.
See how 7,100+ marketing agencies help clients win
Free 14-day trial. No credit card required.

