Google Ads Dashboard
What Is a Google Ads Dashboard?
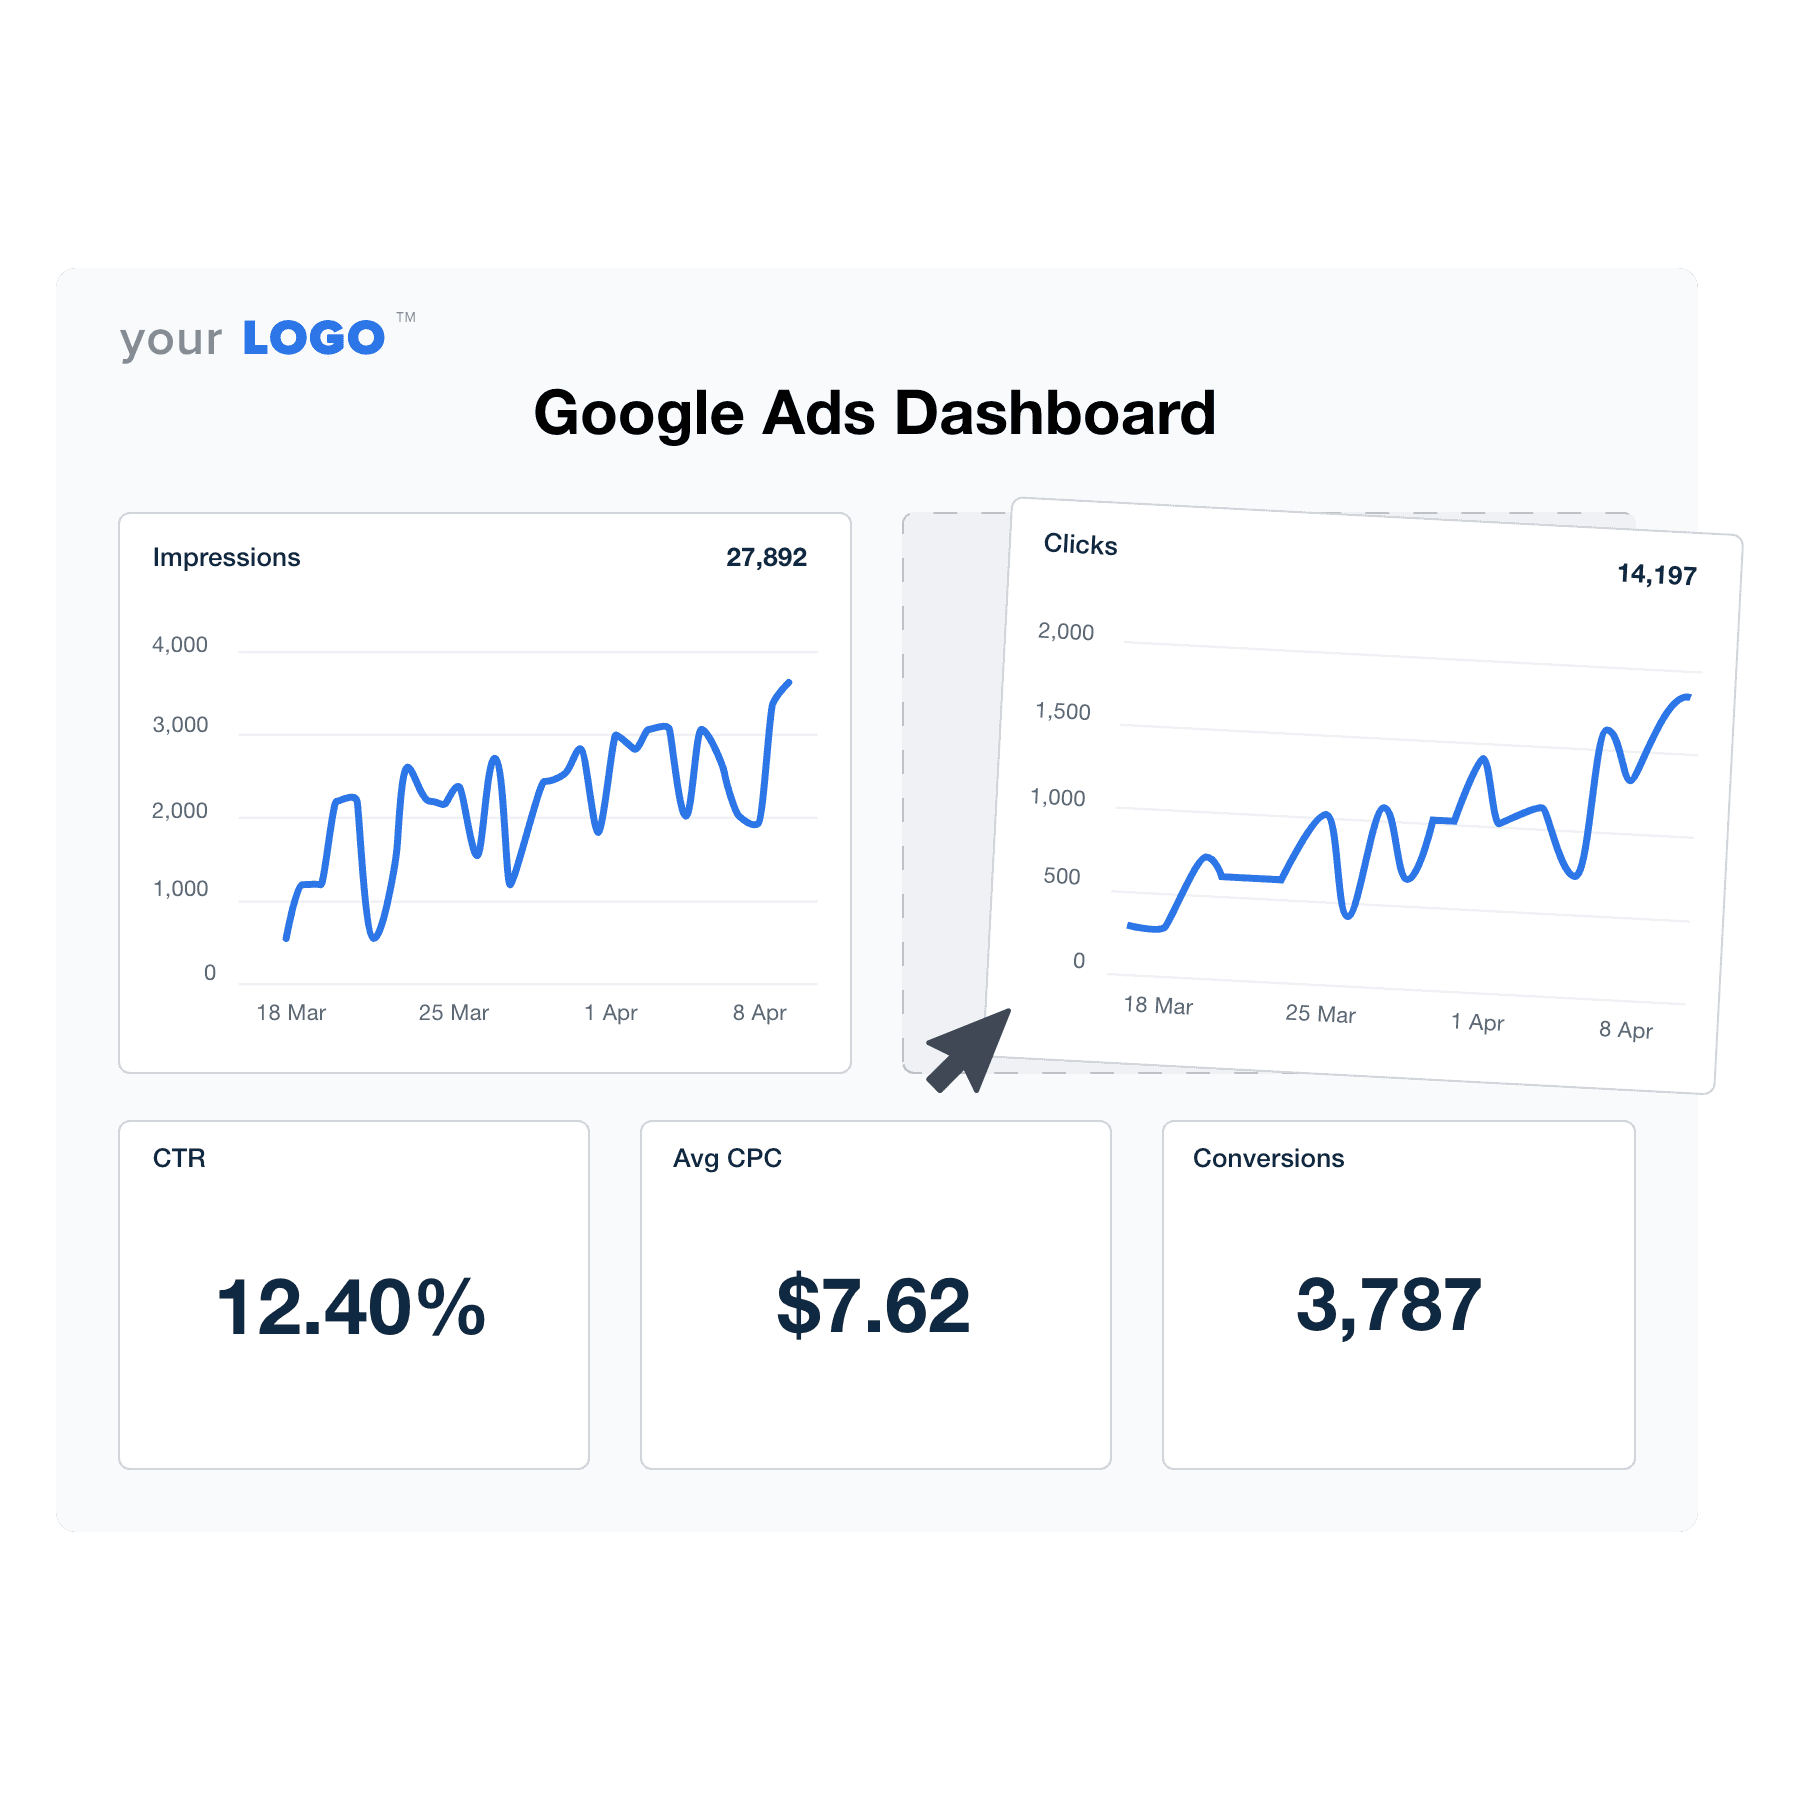
A Google Ad Dashboard is more than just a reporting tool; it's a comprehensive platform that simplifies the way agencies manage ad campaigns. Designed with agencies in mind, this dashboard template integrates data from multiple sources, including various Google Ads accounts and campaign types, into a single, user-friendly interface.
Unlock Agency Efficiency With a Google Ads Dashboard
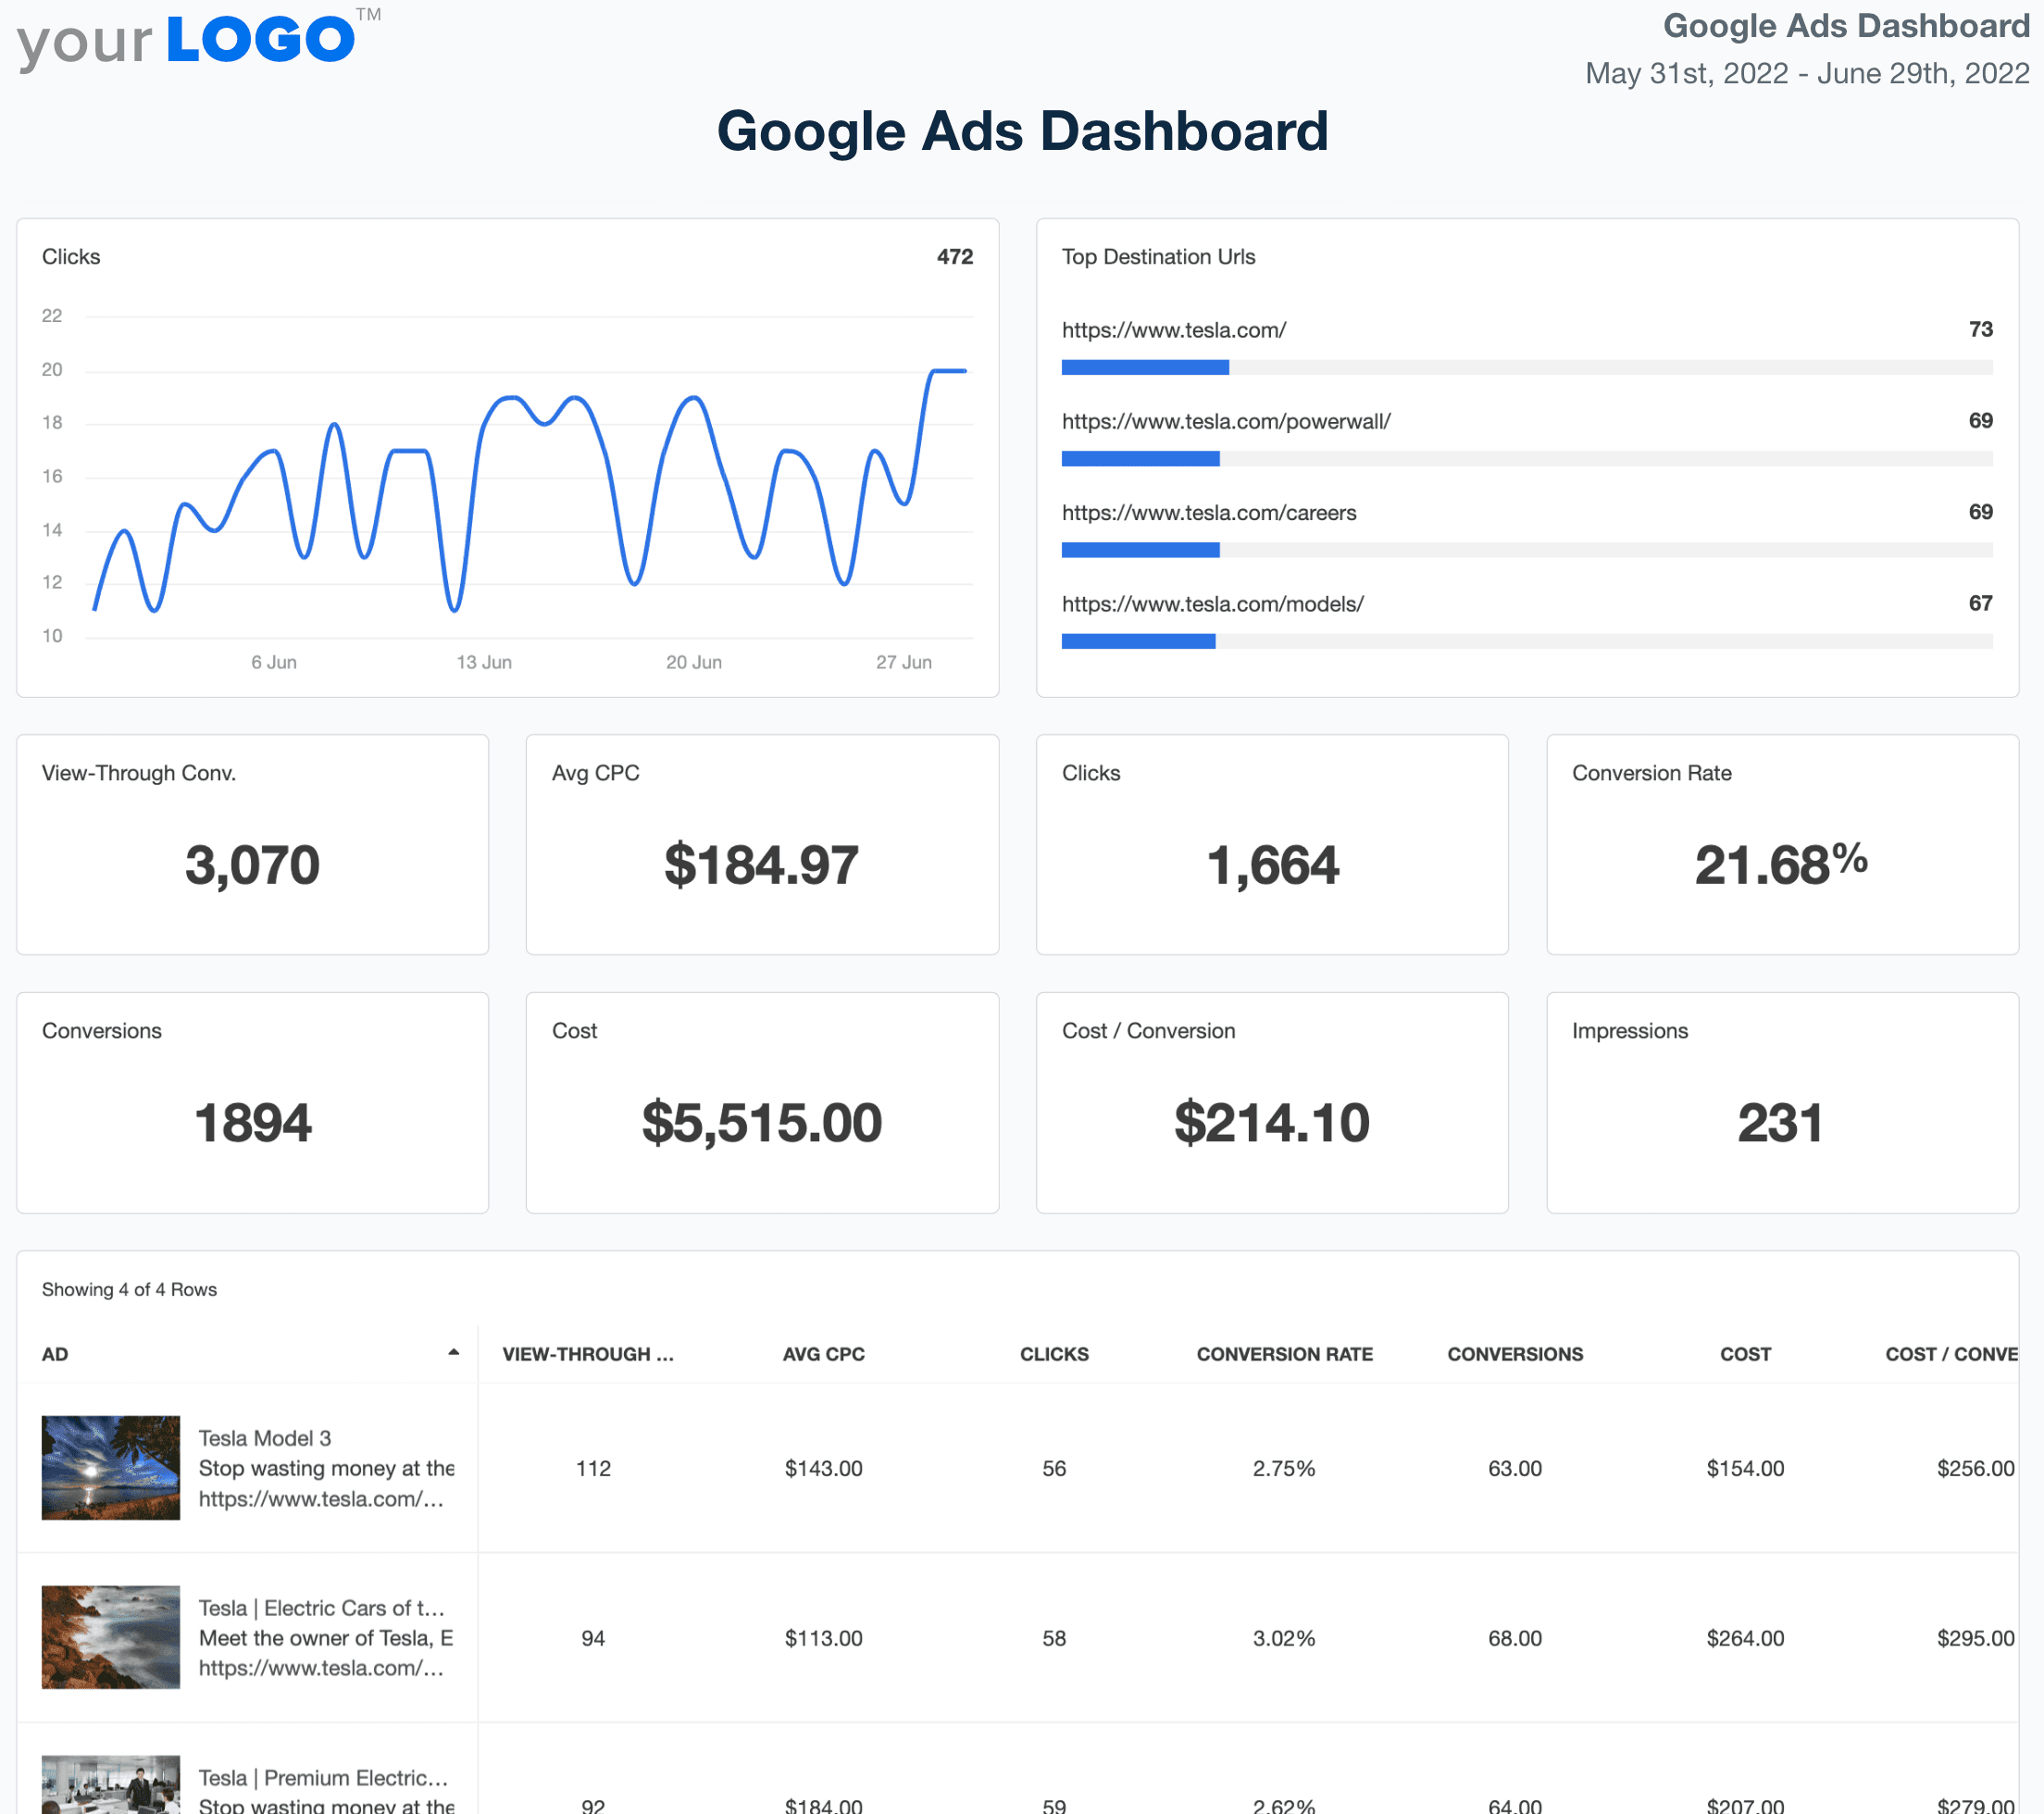
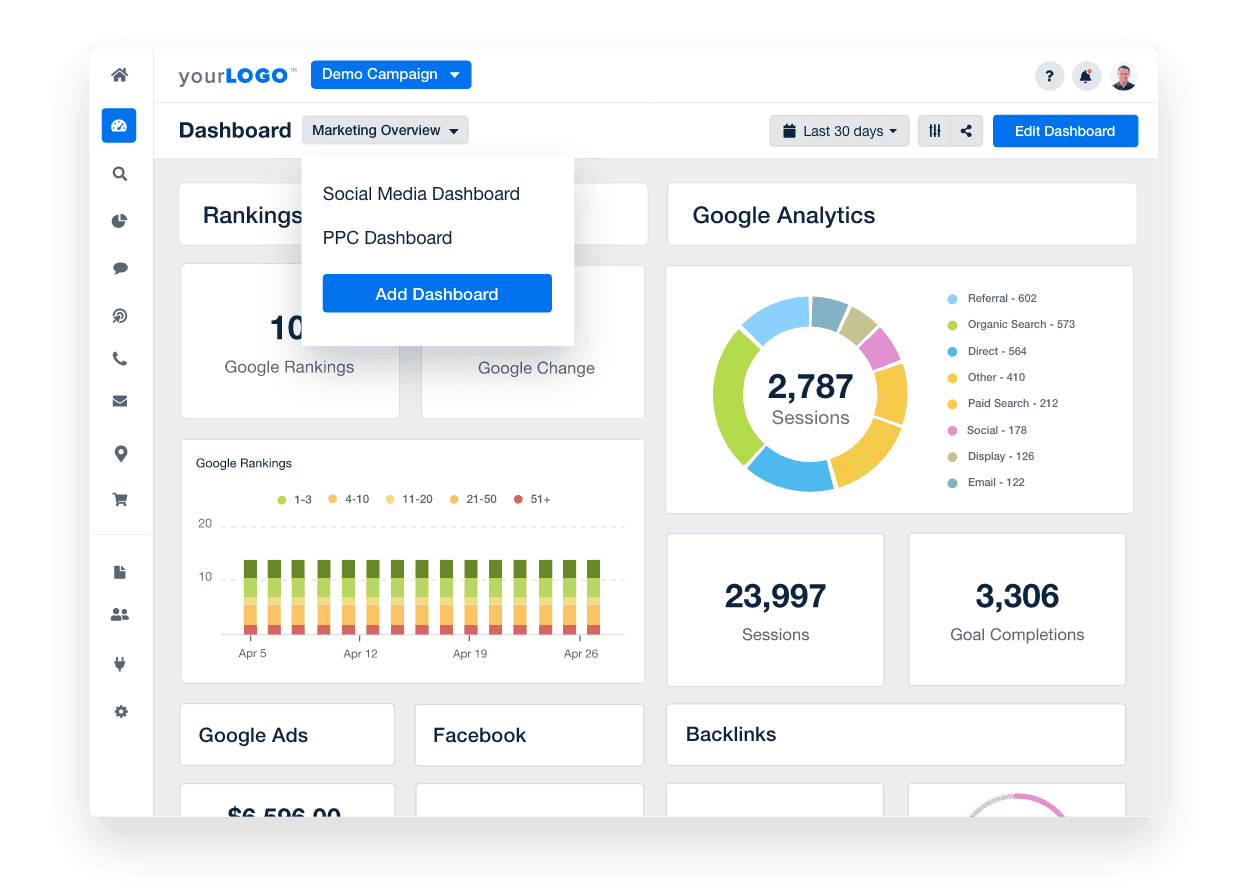
The Google Ads Dashboard simplifies the entire process of managing and reporting on Google Ads campaigns. It directly integrates with Google Ads to provide dynamic data visualizations to monitor ad campaign performance and expenditure, as well as identify optimization opportunities across multiple clients’ Google Ads accounts.
Unleash a time-saving powerhouse with a comprehensive, user-friendly platform for tracking performance, identifying trends, and making data-driven decisions. The live dashboard automatically updates, eliminating hundreds of hours of manual labor. The real-time data access allows marketing agencies to reduce their reporting time and provide clients with immediate answers and actionable insights, enhancing the return on investment.
The dashboard also serves as a platform for data-driven decision making. Whether you're monitoring individual ads, creating new Google ads, analyzing ad group performance, or evaluating overall campaign success, the Google Ad Dashboard (formerly known as the Google Adwords Dashboard) provides the tools you need. It consolidates data from multiple sources into a single report, giving you a clear view of your clients’ top campaigns and the total conversion value they generate.
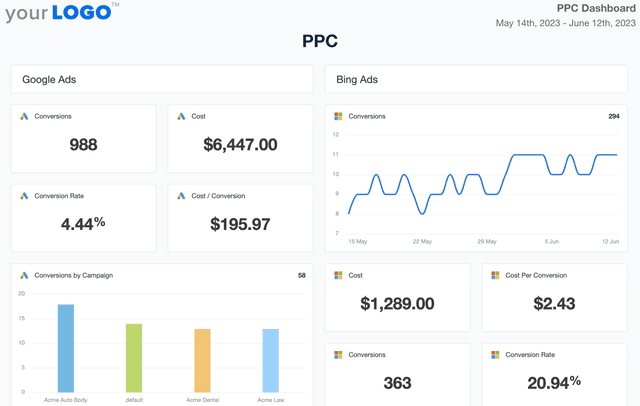
Track key Google Ads metrics, such as cost per click, conversion rate, and view through conversions, providing a comprehensive view of your ad campaign performance. The search terms related to your campaigns are also readily available, helping you understand the search volume trends and optimize your clients’ marketing dollars.
Integration with Google Ads is as simple as a few clicks. Once your Google Ads account is linked, start benefiting from the features immediately. If you prefer scheduled reporting, use the Google Ads report template, PPC reporting template, or SEM report template.
What's Included in Our Google Ads Dashboard Template
1. Impressions
Impressions are how many times a Google Ads paid search ad has been seen among search results. For campaigns designed to increase awareness, this metric can be important as it’s an indication of interest in search terms related to the brand.
Impression volume can also provide insight into search volume trends. It's a good gauge to monitor how many eyes have seen your ads.
2. Clicks
A click is recorded when a user clicks on a link in an ad. Clicks can be on the header of a paid search ad, or any of the extensions Google Ads supports such as location or featured products.
It’s an essential metric to monitor campaign performance, as a click is often a signal a user is interested enough to learn more about the product or service.
3. CPC (Cost Per Click)
CPC (cost per click) how much it charged on average for a click on a Google Ad. This metric often changes daily due to Google’s real-time bidding algorithm and so it’s best not to compare it week-over-week in a dashboard. The lower the cost, the more efficient your ad is at attracting website visitors, and the more of your audience you can reach within budget.
4. Conversions
Google Ads can report on several conversion events and should be the main target of any campaign. This includes calls from mobile ads, purchases, and Google Analytics custom goals. Conversions can be seen at the ad or keyword level in addition to at the campaign level, and allow you to track the real impact of marketing dollars.
Tracking conversions makes it easy to track and report on the ROI (return on investment) of campaigns which makes it easy to prove the value of Google Ads.
5. Conversion Rate
As many paid search campaigns exist to drive consumer action, their effectiveness is an important KPI. Conversion rate shows the rate that clicks lead to conversions.
A Google Ads conversion rate can be calculated for various conversion metrics, and for purchase driven campaigns is often the main KPI. In a dashboard, the conversion rate can be broken into several granularities, including individual ads, ad group and more.
6. Top Performing Keywords
Metrics such as conversions, cost, CPC, and CTR (click-through rate) can be viewed by the Google Ads keywords level. Data at this granularity can help agencies identify trends and insights into customer desires, guiding optimizations and/or the creation of new ads.
Top performing keywords are a frequent client ask, and including them in a Google Ads dashboard allows you to anticipate questions.
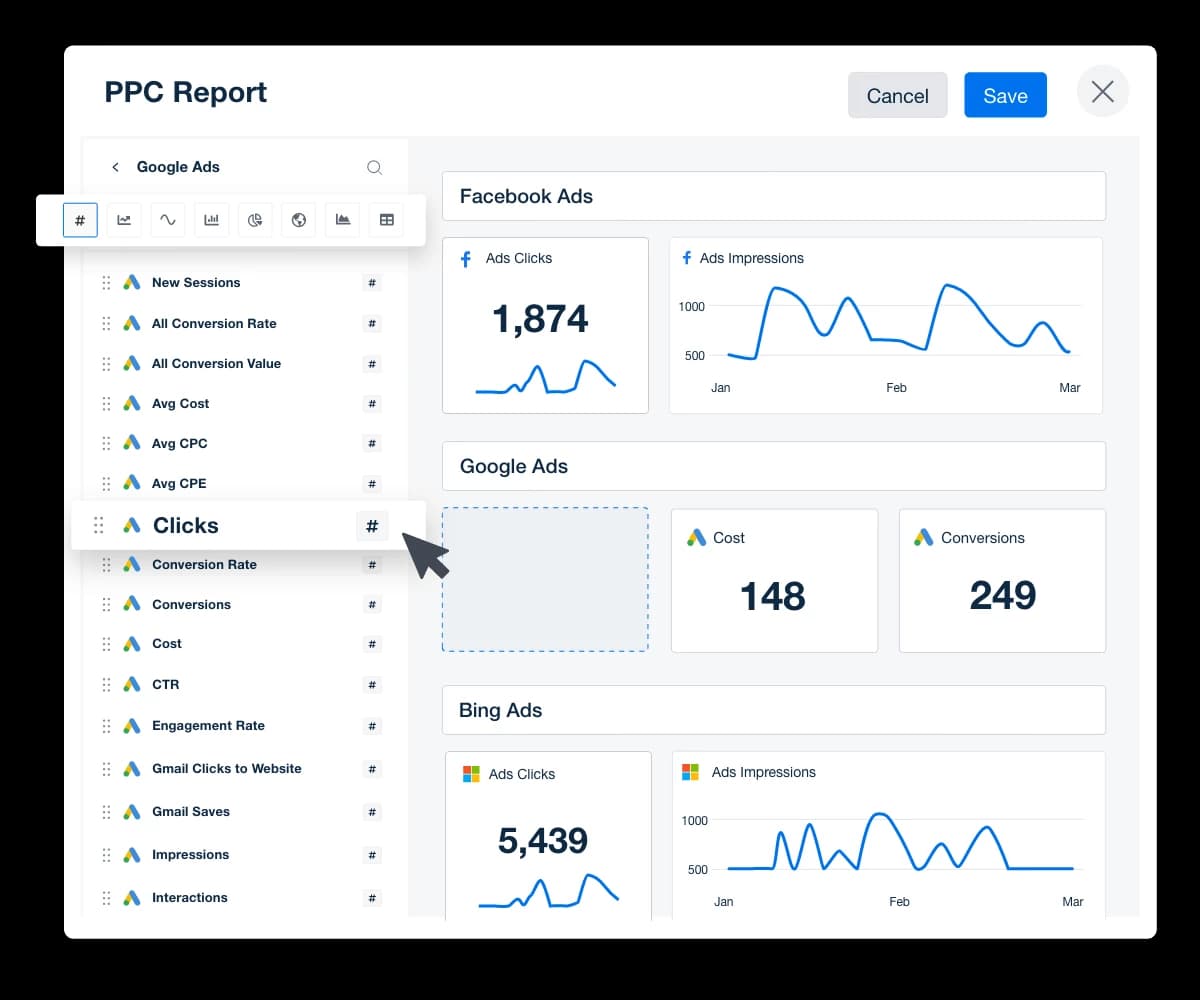
Want to add more sections, additional information, or custom metrics to your Google Ads dashboard? AgencyAnalytics lets you easily drag and drop new sections to your dashboard in minutes, saving your agency time to focus on scaling your business.
Why Your Agency Needs a Live Google Ads Dashboard
Create Custom Marketing Dashboards & Client Reports in Minutes
Save countless hours in data retrieval and client reporting. Integrate with Google Ads to access your clients’ real-time data instantly. Select the widgets you want to include and use the drag-and-drop report builder to organize each client’s data in a way that maximizes impact. Flip it into a client report in minutes, without the hassle. AgencyAnalytics gives you everything you need to put your client reporting on autopilot.
Monitor Multiple Campaigns in One Place
Keep track of all your clients’ campaigns in one place to easily identify insights and opportunities–even if a client has multiple locations or websites. Cross-campaign reporting makes it convenient to monitor all their campaigns, identify optimization opportunities, and share key insights.
Streamline Your Agency’s Billing Process
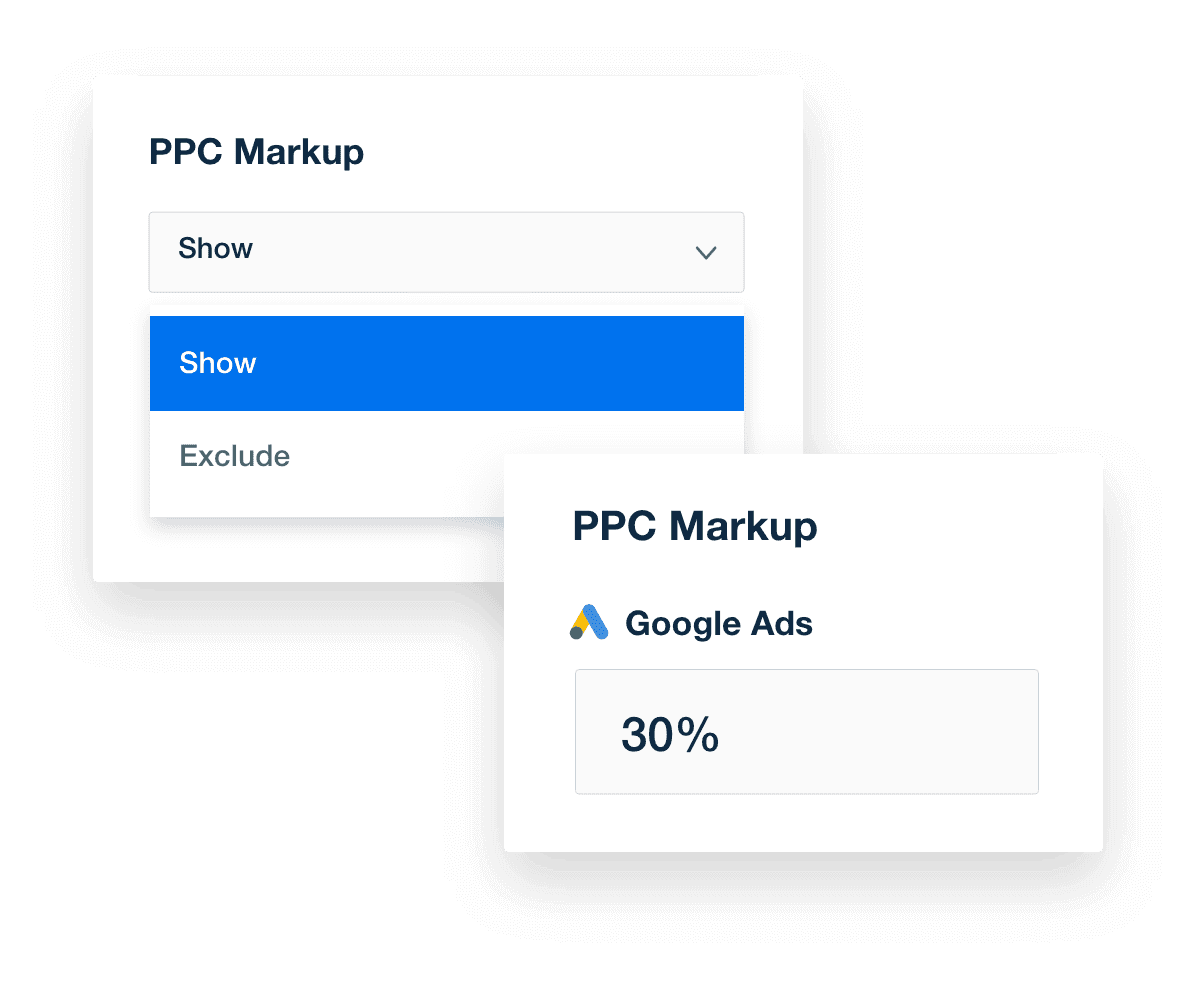
Clearly communicate costs and overheads with your clients, fostering trust and clarity in your business relationships. With AgencyAnalytics, you have the flexibility to apply your PPC markup either at the campaign level or across all campaigns in your account with an account-wide markup. Include your margin in the total ad spend, providing a clear understanding of costs to your clients and avoiding potential misunderstandings.
Customizable Access for Clients & Staff
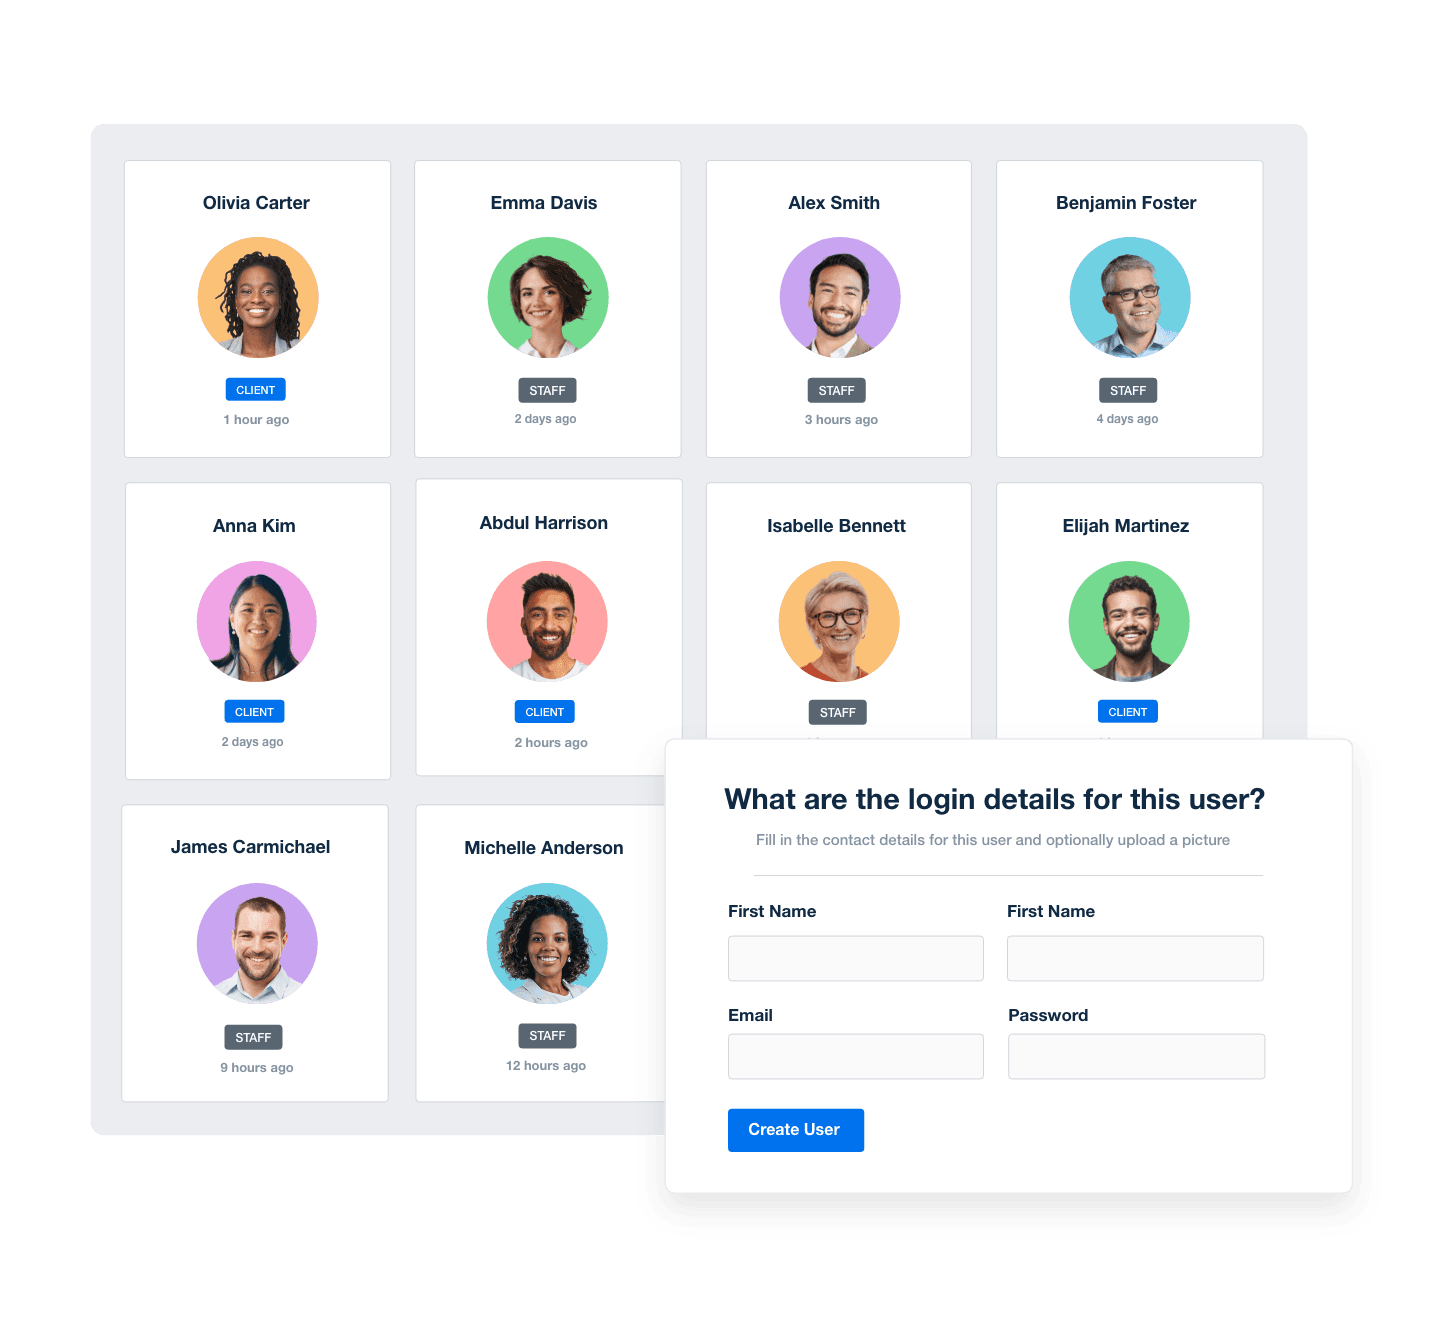
Give your clients their own login so they can access their live marketing dashboard at any time. Want to delegate tasks to your team and streamline your agency’s workflow? Granular user permissions give you complete control over exactly what each staff member can access. Assign staff members to clients and create one-off or recurring tasks for each campaign.
Tie Your Results To Your Agency’s Brand
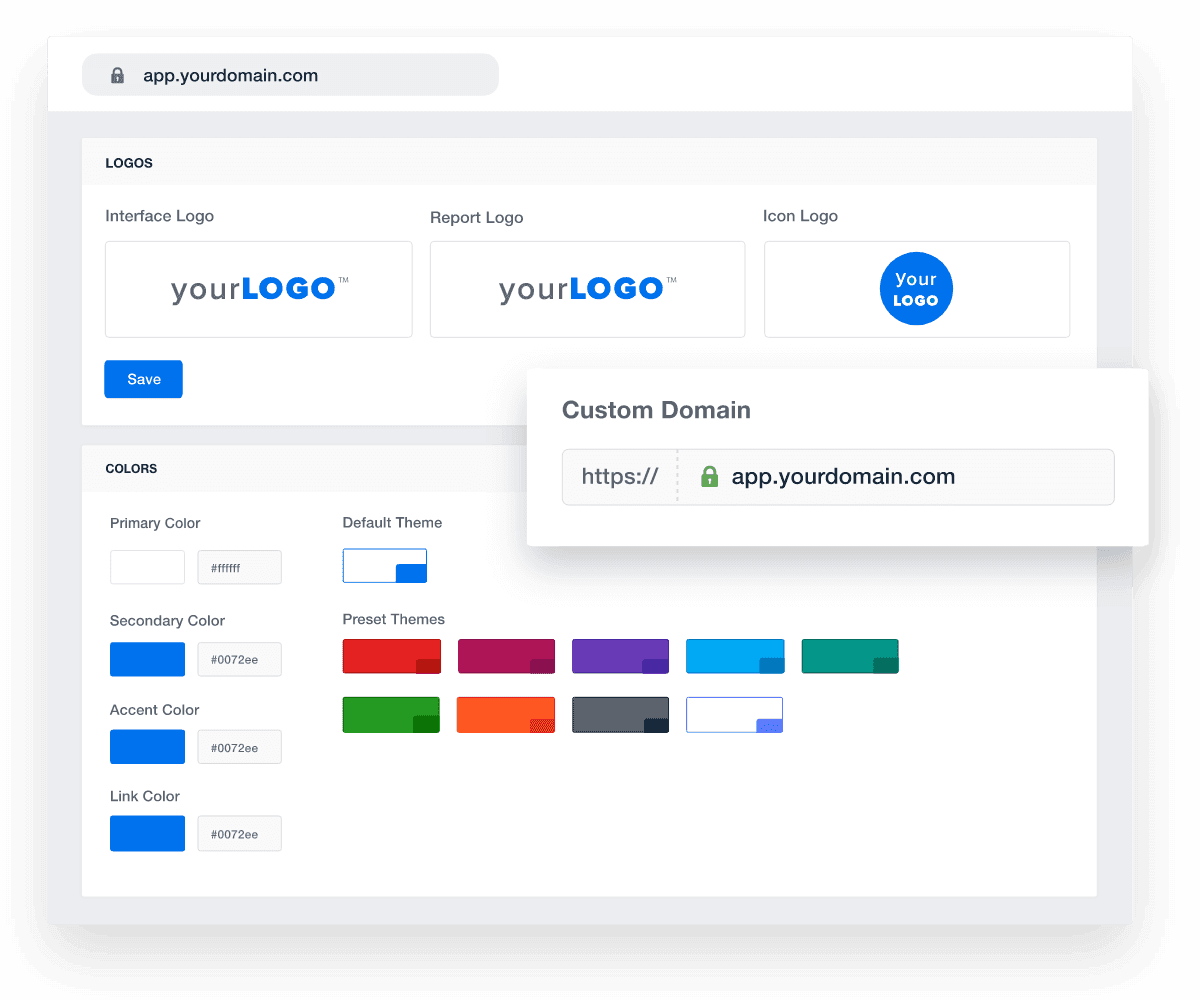
Make your brand go further with fully white-labeled dashboards and reports with your agency logo and your brand’s color palette. Take advantage of the multiple white label profiles on the Grow plan and higher for additional features like hosting your marketing dashboards on your own custom domain.
Report Smarter, Not Harder
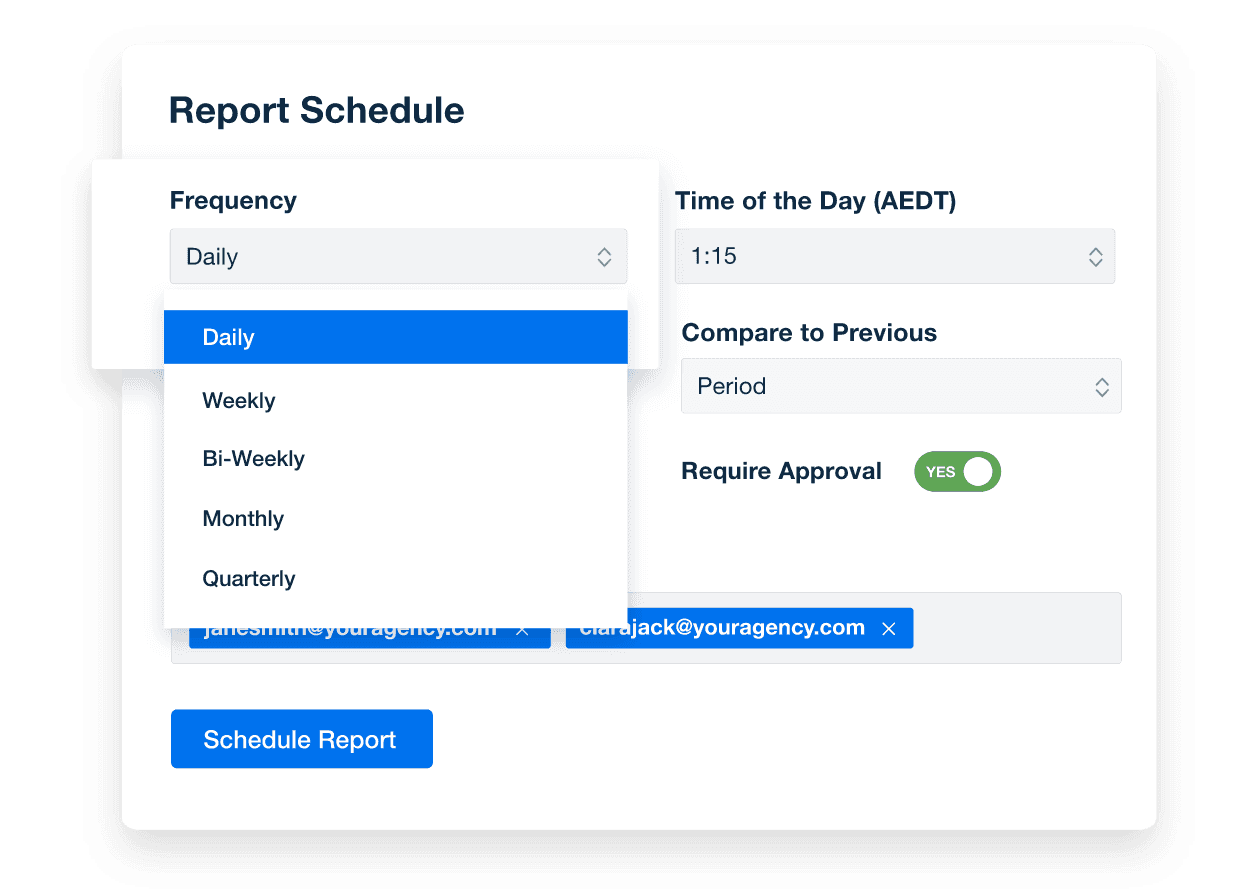
Automate your agency’s report generation and delivery on a daily, weekly, or monthly basis, freeing up time for strategic tasks. Regular, automated reports also enhance client engagement and retention.
With 80+ marketing integrations, your scheduled reports provide a comprehensive view of your clients' marketing performance across multiple platforms. Harness the power of automation and focus on delivering exceptional marketing results.