Facebook Dashboard for Performance Tracking and Client Reporting
Customizable Facebook Dashboard for Smarter Social Media Insights
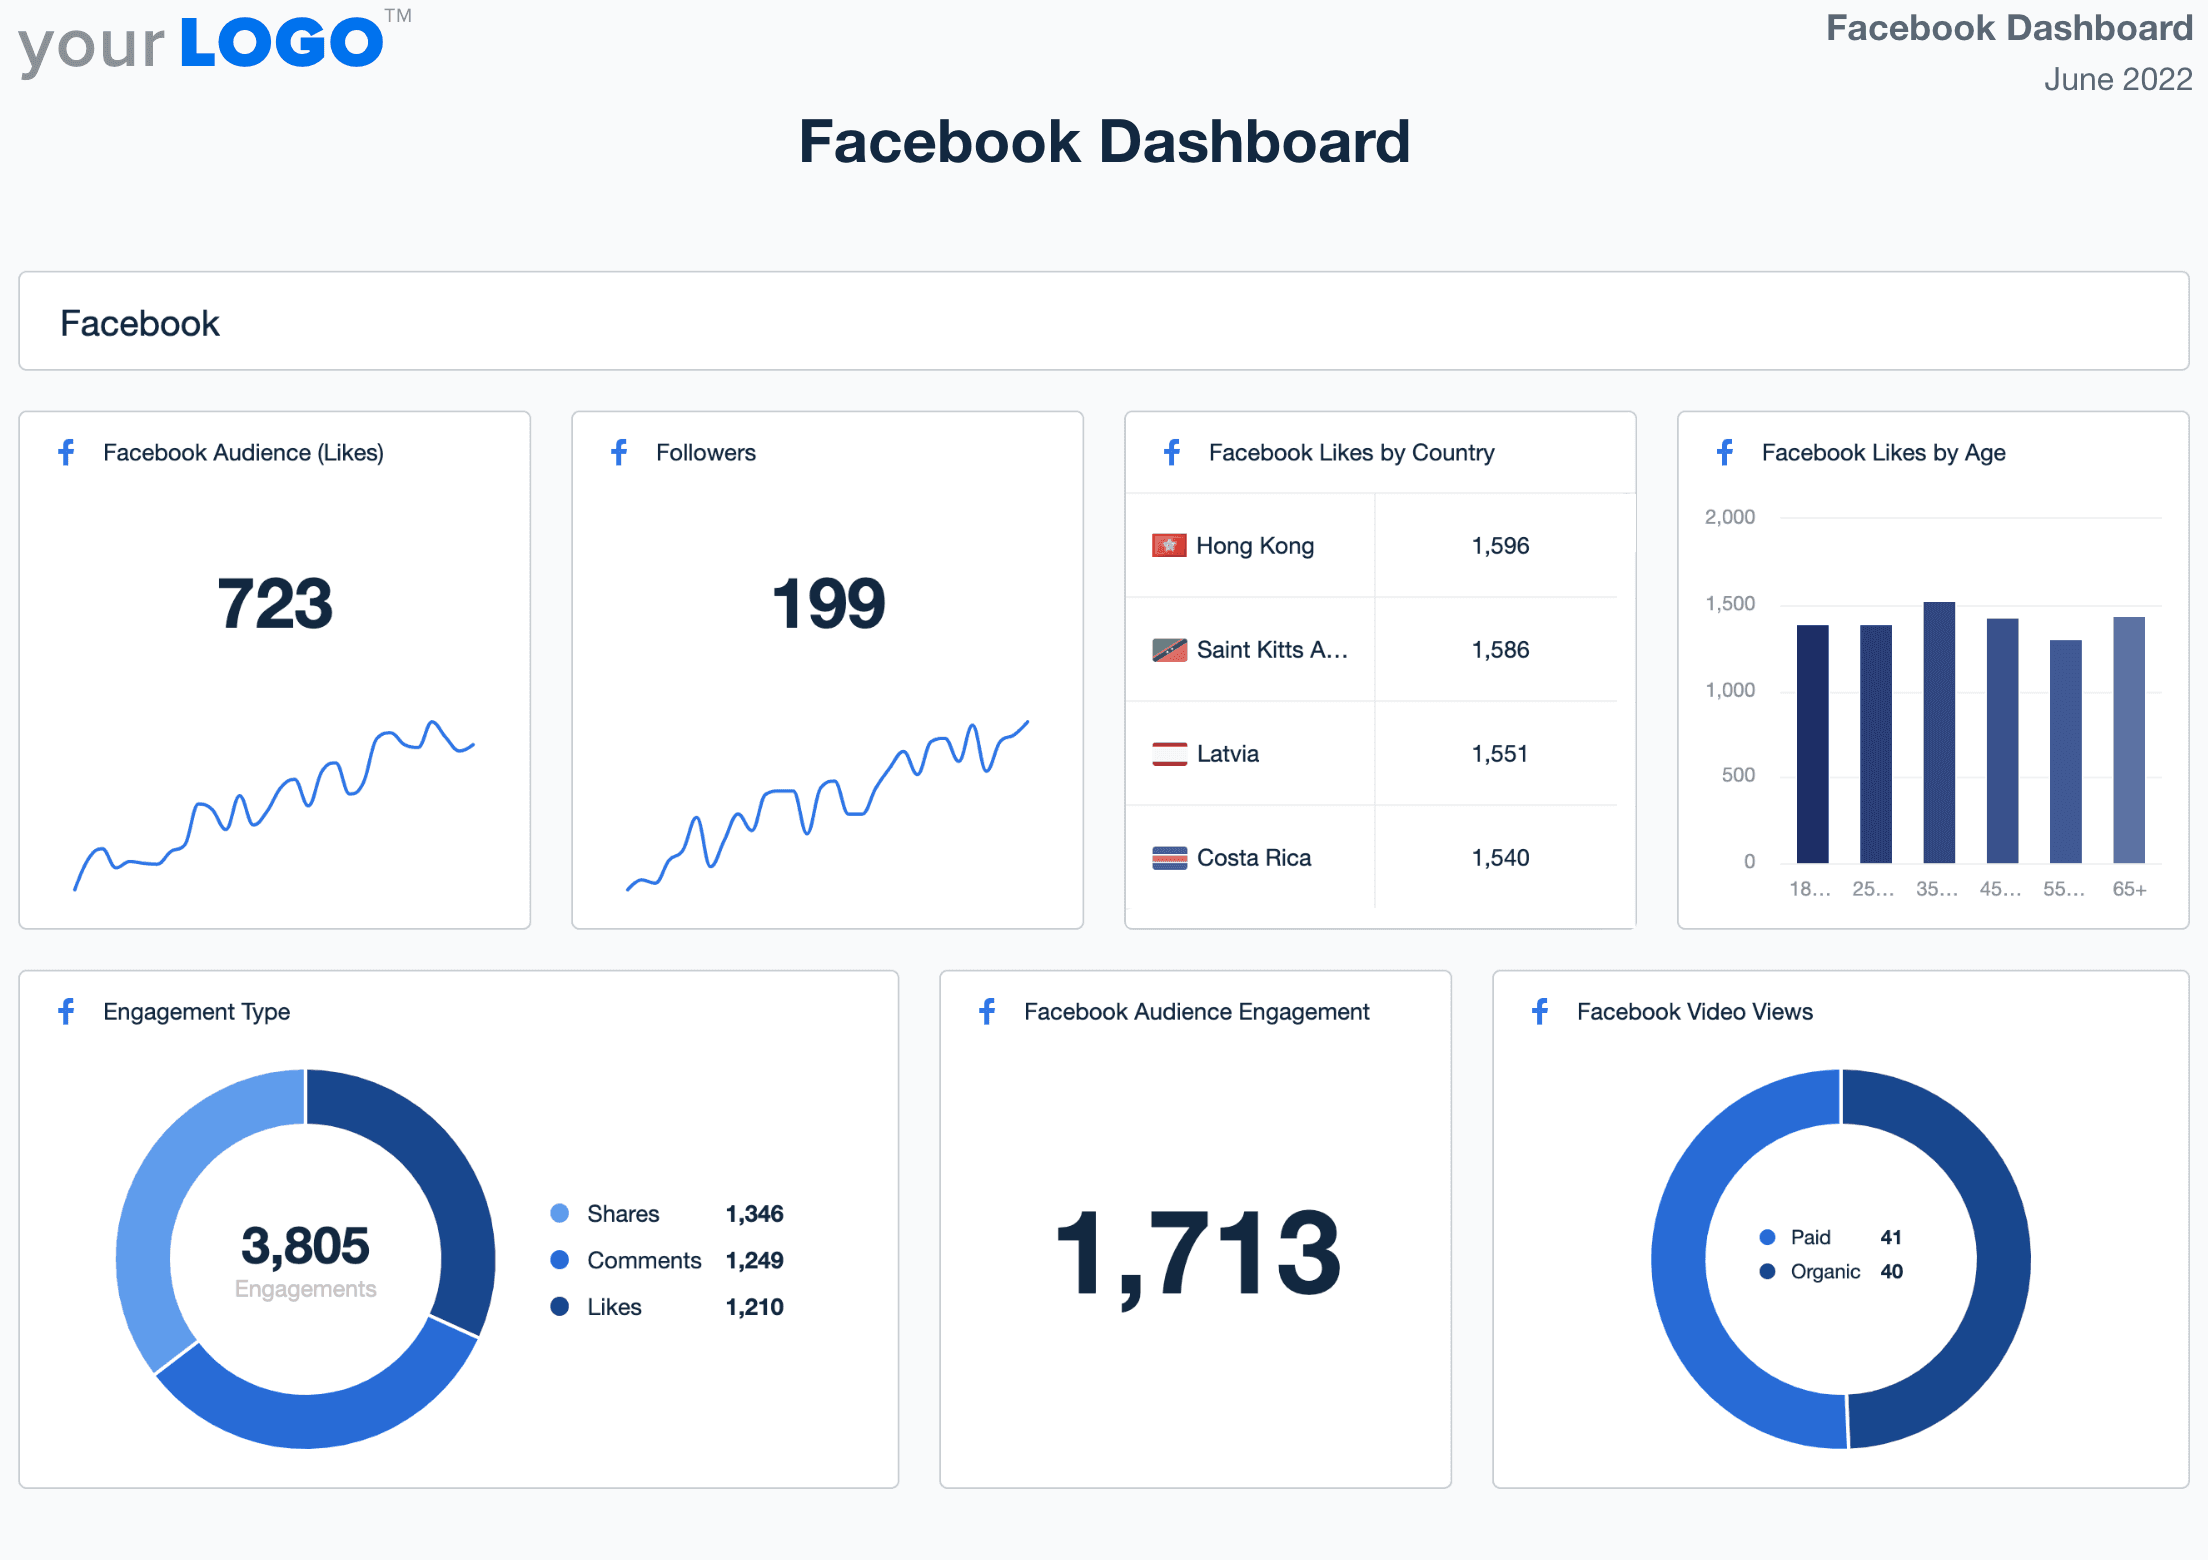
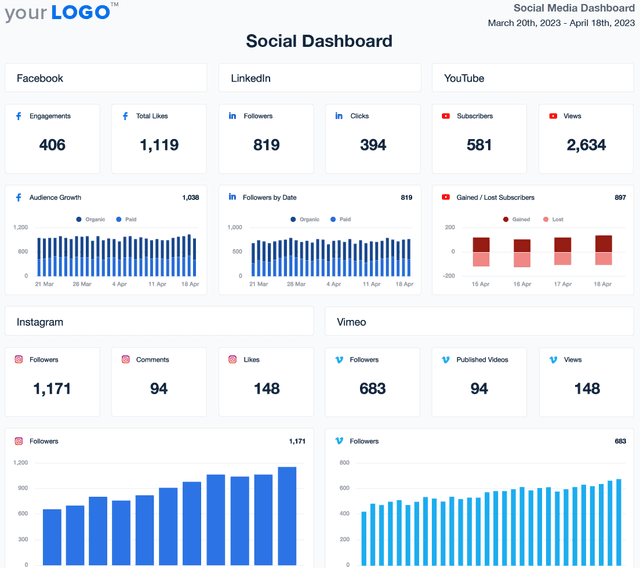
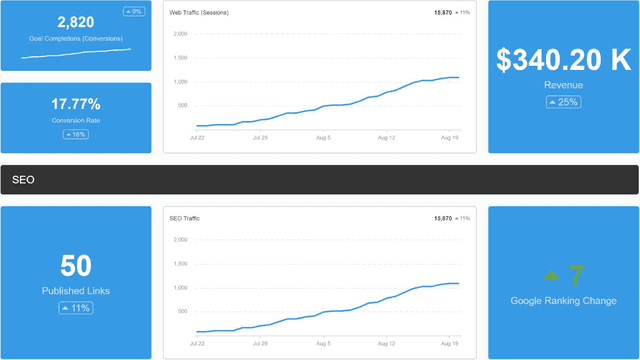
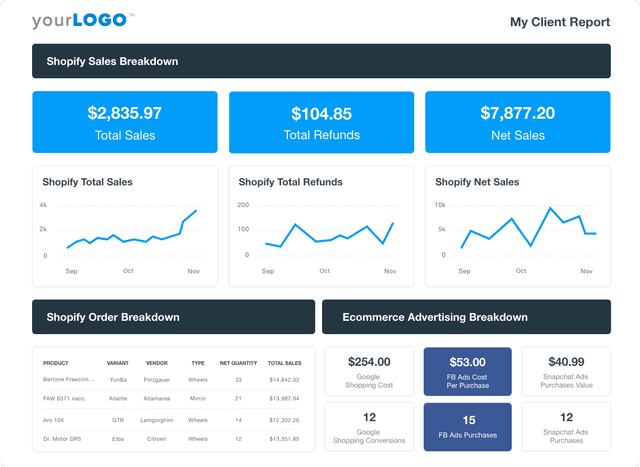
A white-labeled Facebook dashboard consolidates organic social media performance data in one place, eliminating the need for manual tracking. Customize widgets, white label dashboards, and highlight key KPIs like follower growth, engagement rate, and follower growth—all in an easy-to-digest format. Customize the template to include organic and paid Facebook campaign data for a comprehensive view that updates automatically, showcasing wins and highlighting areas of opportunity.
Provide clients with a live, up-to-date view of their Facebook marketing efforts while streamlining your agency’s internal analysis. With automated reporting and seamless integration with Facebook analytics, agencies focus more on strategy and less on compiling data.
Creating, generating, and sharing reports has never been easier, and our clients love the fact they can follow our activity and their stats in real time. Everything is simplified, accessible, and beautifully presented.


5 Sections Included in the Template
1. Audience Growth
This is an obvious metric to watch closely, as your clients probably want to see an upward growth trend on their accounts. But why is this important? Tracking Facebook audience growth is what helps you determine how many people you are getting across to and if you are reaching the right people.

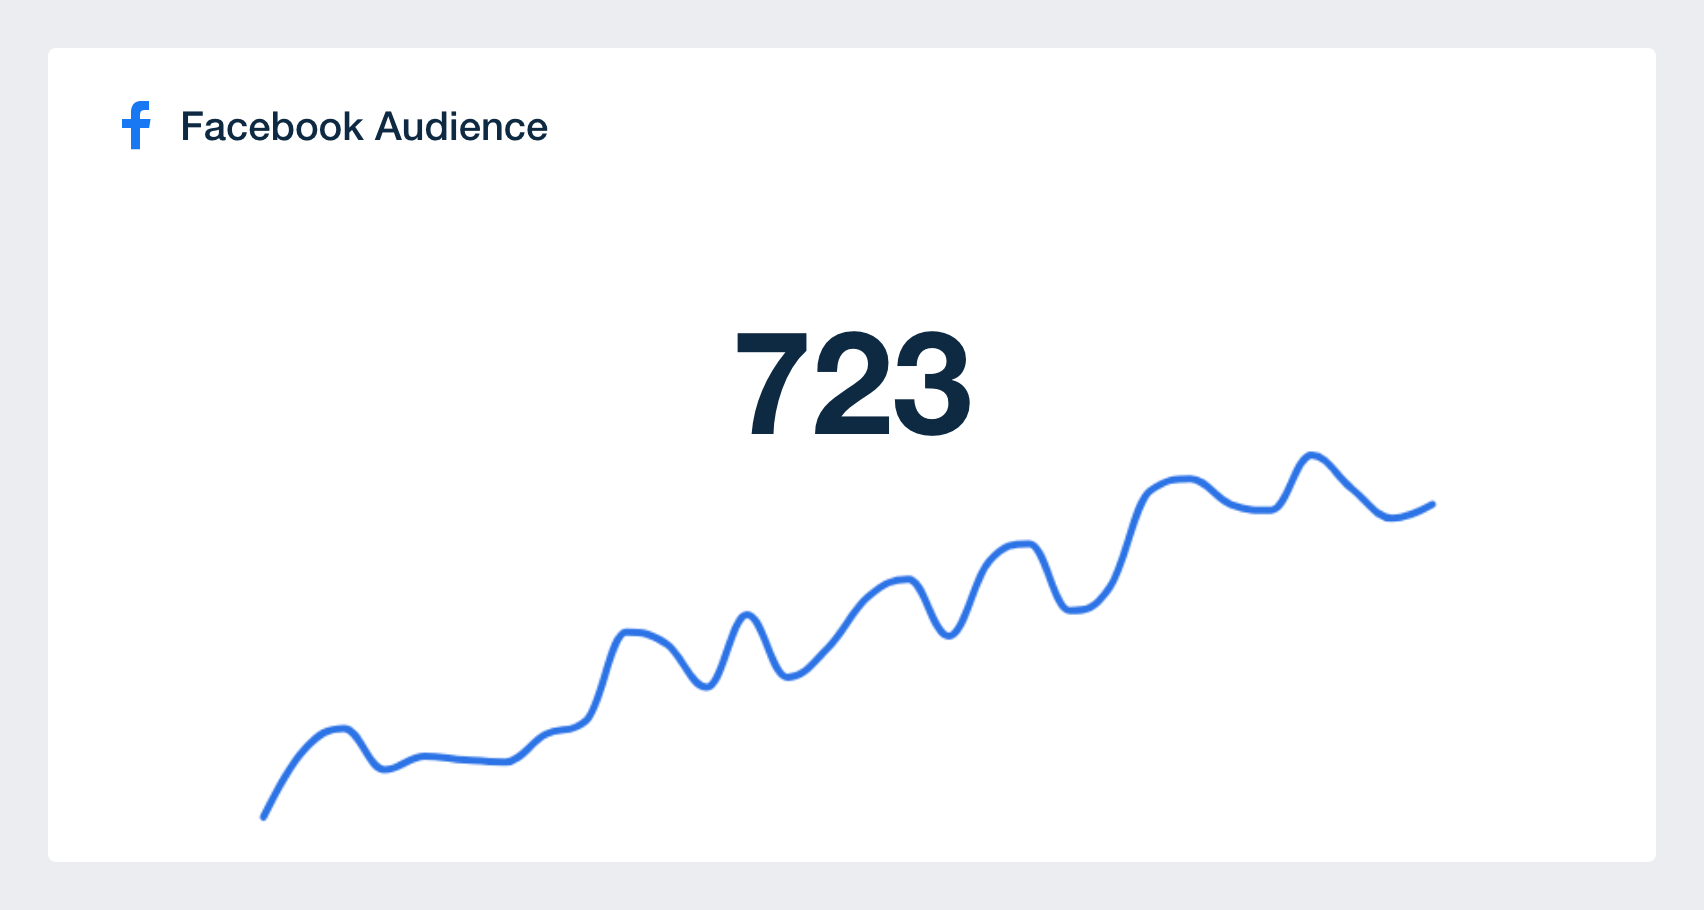
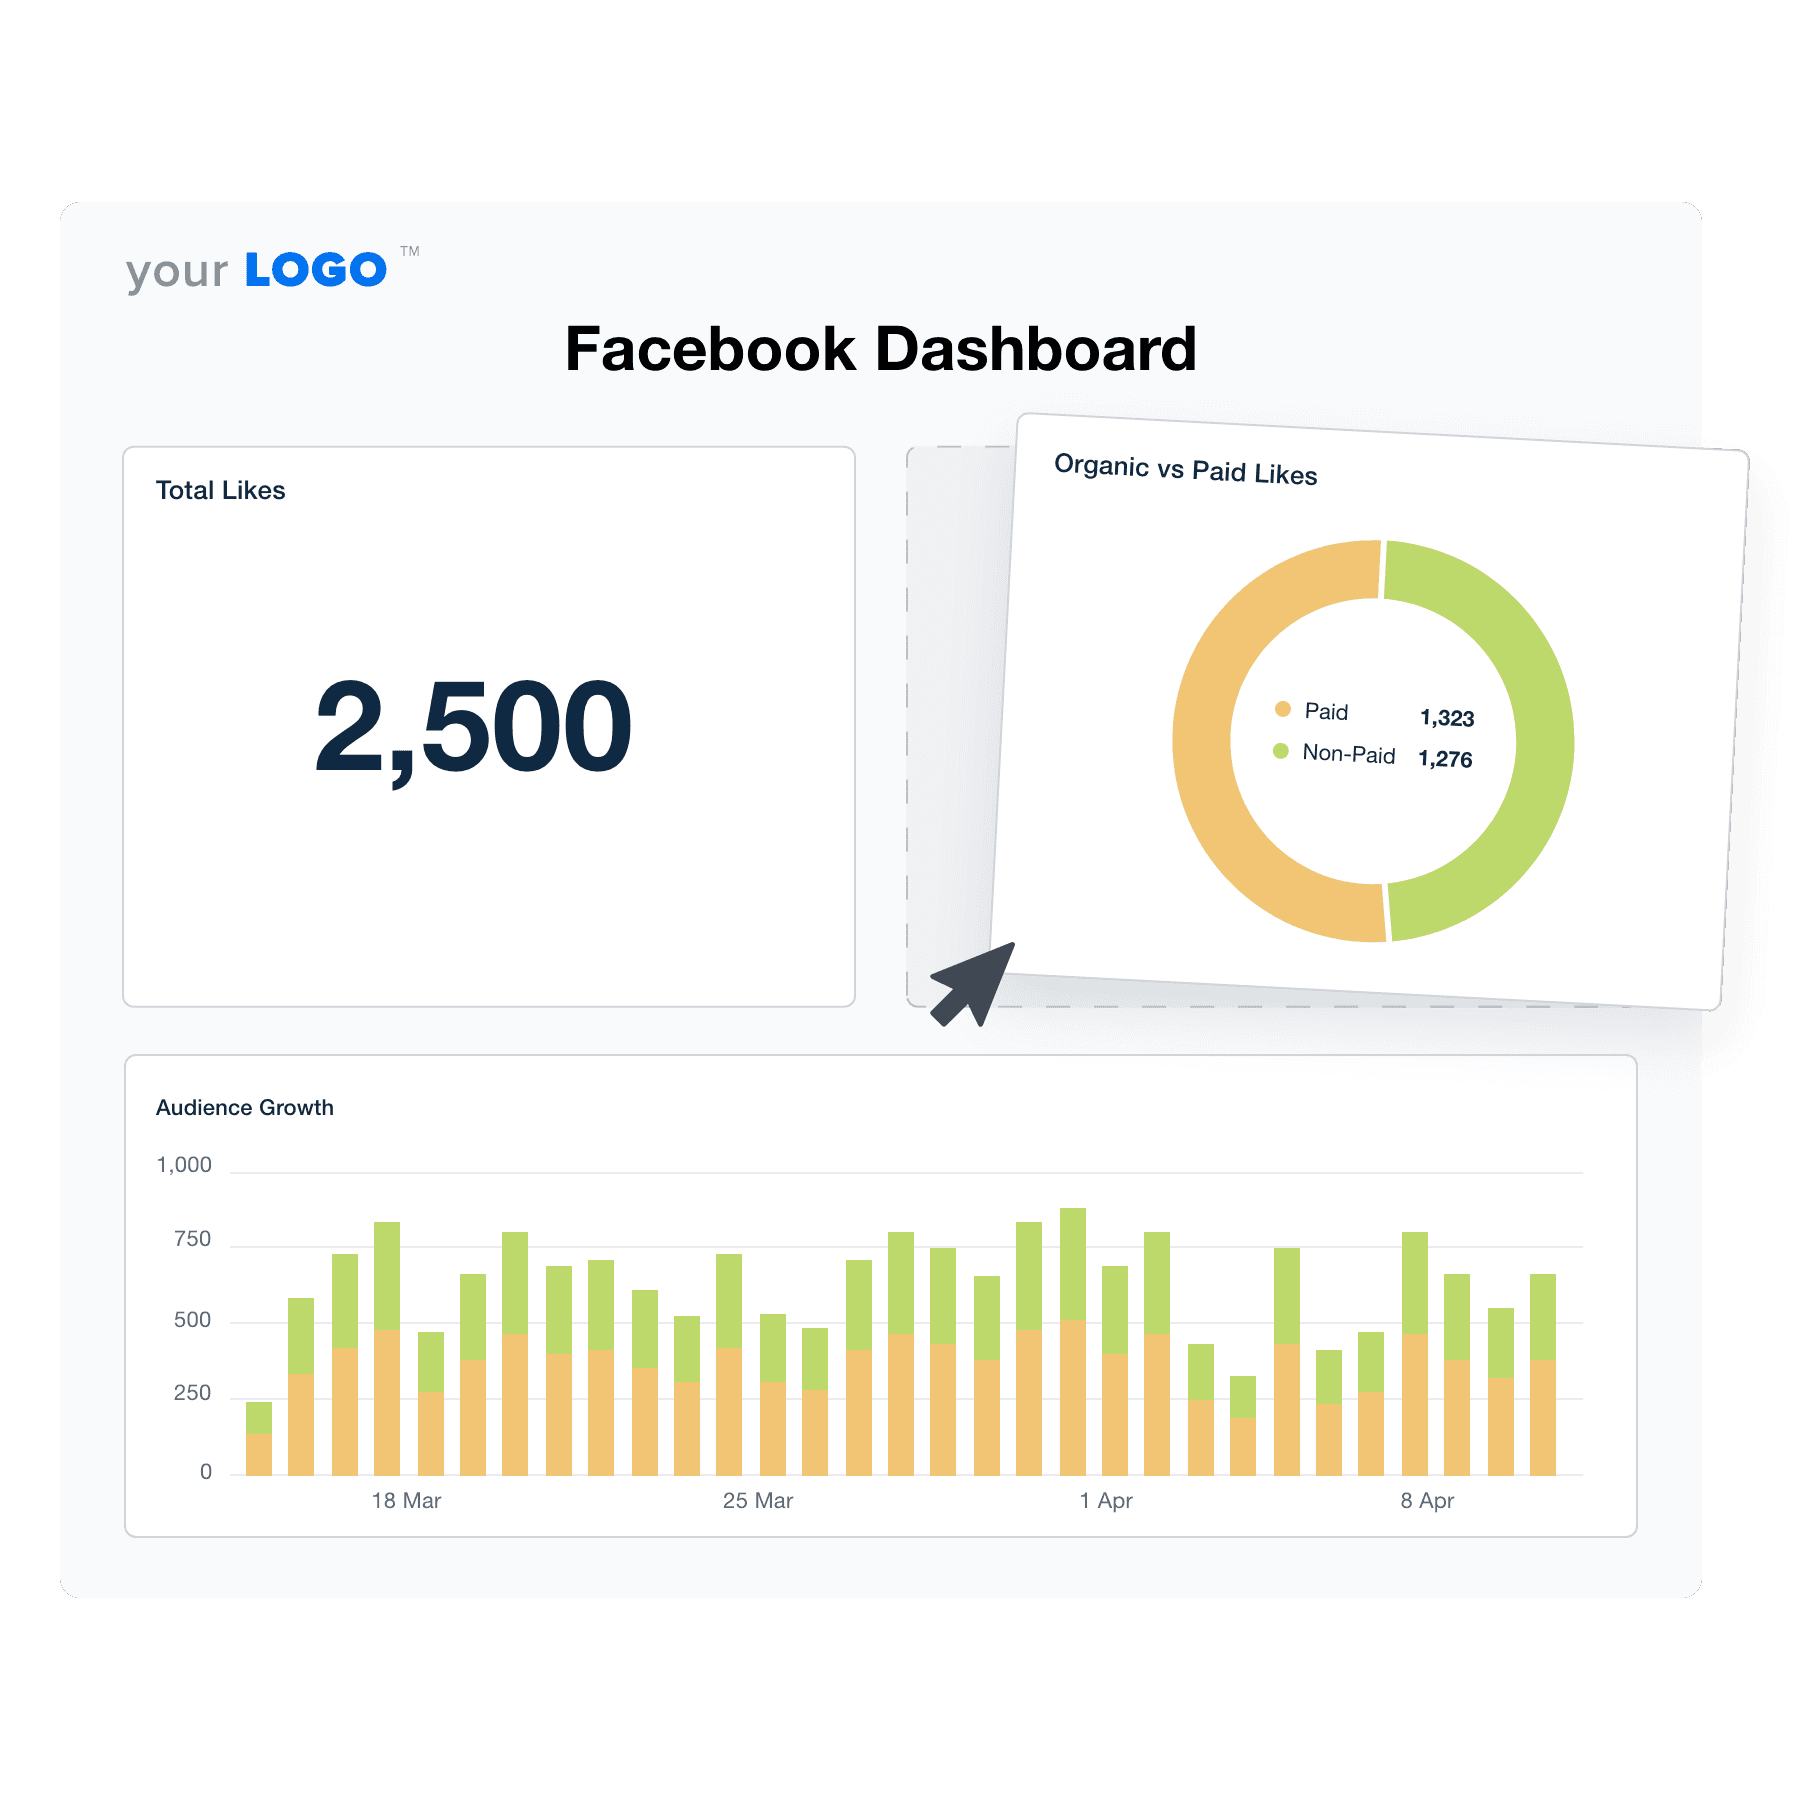
With our Facebook marketing dashboard, keep track of your clients’ audience growth over time by viewing the page like numbers monthly, weekly or even daily, all from one place.
Using this data, you can look out for months, weeks or days that you had a surge of new likes in comparison to other days and find out what was done differently to attract new people.
2. Likes by Country
Facebook is used globally, with 89% of monthly users residing outside the United States and Canada and over 50% of users having a native language other than English. Such diversity can make it easier to locate your target audience or a bit more complicated.

For instance, if your clients’ customers are people who live only in the United States and 90% of likes their page gets are from other countries, it means your strategy is wrong despite the following growth.
That is why this data is so important; to see the true value of the page's following. Having 10,000 likes from people uninterested in what your client offers is equal to zero likes in terms of prospect quality.
3. Post Engagement
Engagement on Facebook includes post impressions, shares, reactions, comments and clicks on images, posts, videos and links.
Post impressions can be used in summary charts to present key performance metrics and provide insight into performance trends.

Use the post engagement metric to measure the effectiveness of your content and the kind of connection you’re making with your client’s page fans.
Analyze and compare engagement over time, using your dashboard to see the total number of comments, likes, clicks, and shares the page generates monthly, weekly, or daily.
This helps you and your clients know what content is appealing to their target audiences. If fans are not engaging with the page as expected, you need to realign your content strategy to match their desire. The total engagement will reveal your overall performance and not just what users think of individual posts but will give you information on how your page is viewed by users.
4. Total Reach
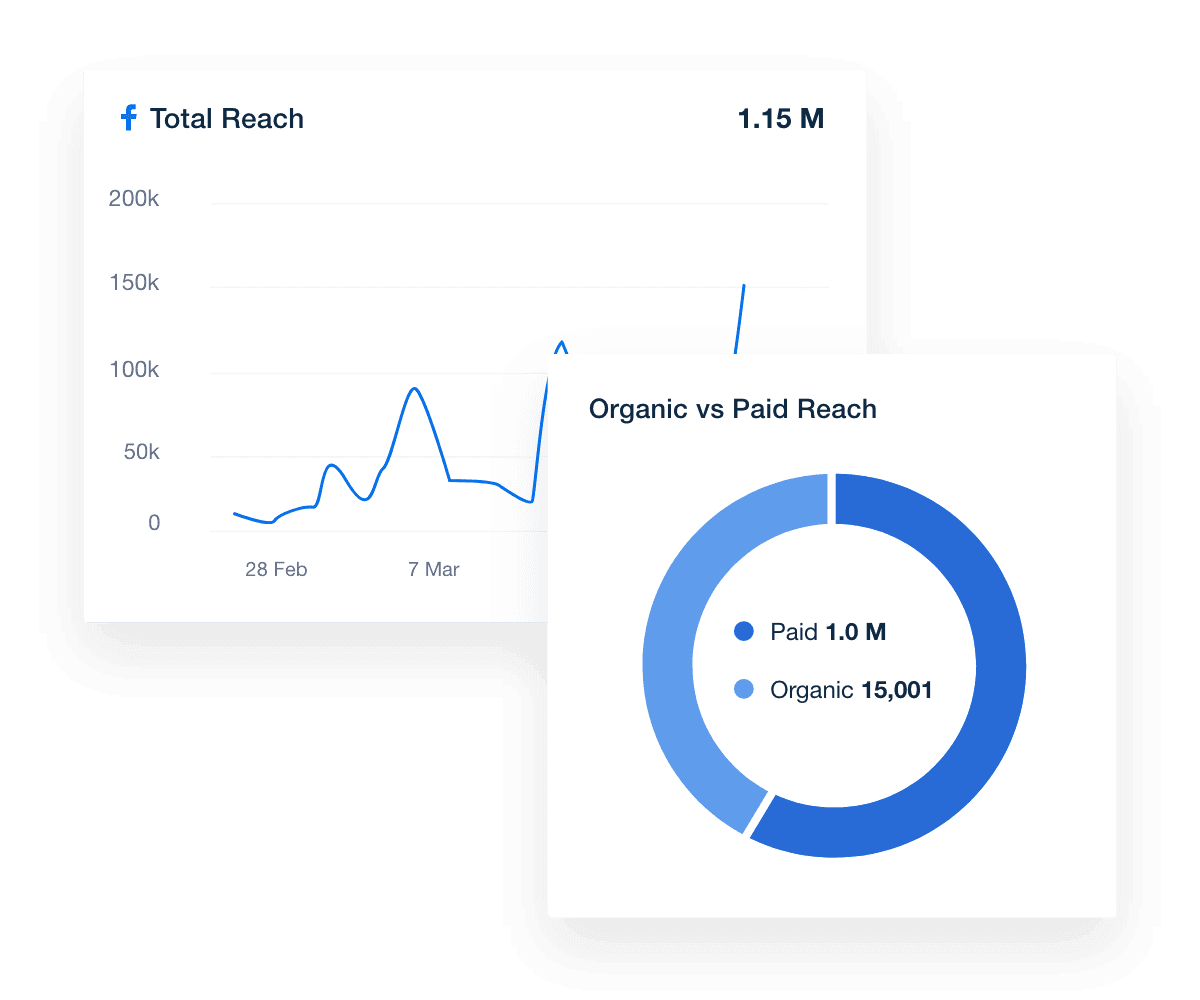
Facebook’s total reach metric refers to how many unique users saw any type of content associated with the Facebook page you manage at a particular time. This is different from Impressions, which counts multiple views from the same person.

By analyzing total reach you and your client can understand what sort of online presence your strategy is yielding on Facebook as total reach measures brand awareness on the platform.
It's important to state that your organic reach is based on hundreds of factors but has certain major factors used by Facebook to determine who sees your content: a user's former interaction with your page, when your posts were made, any previous negative feedback about your page, the interaction of other people with your content.
These factors are mainly what the organic reach metric will point you to, as your reach could reveal poor or quality interactions with the page's content.
You may also want to take a look at our Facebook Ads dashboard if you're reporting on reach too!
5. Video Views
By analyzing the Facebook video views metric, you can see what videos on your clients Facebook page are getting the most views as well as the duration of time spent by people watching each video.

The video views graph shows you how many times users viewed your videos for longer than 3 seconds, 10 seconds, and 30 seconds etc.
The graph will also show you unique views, repeat views, click to plays and auto-plays. This information will let you know what videos are most relevant and interesting to the target audience.
Want to add more sections or custom metrics? AgencyAnalytics lets you easily drag and drop new sections to your Facebook dashboard in minutes, saving your agency time and money.
Why AgencyAnalytics Makes the Best Facebook Dashboard
Show the Full Picture of Your Client’s Marketing Activities
Combine your clients’ Facebook campaign performance 80+ alongside all your other marketing activities with a comprehensive digital marketing reporting tool. Show clients how their Facebook campaigns are impacting their business.

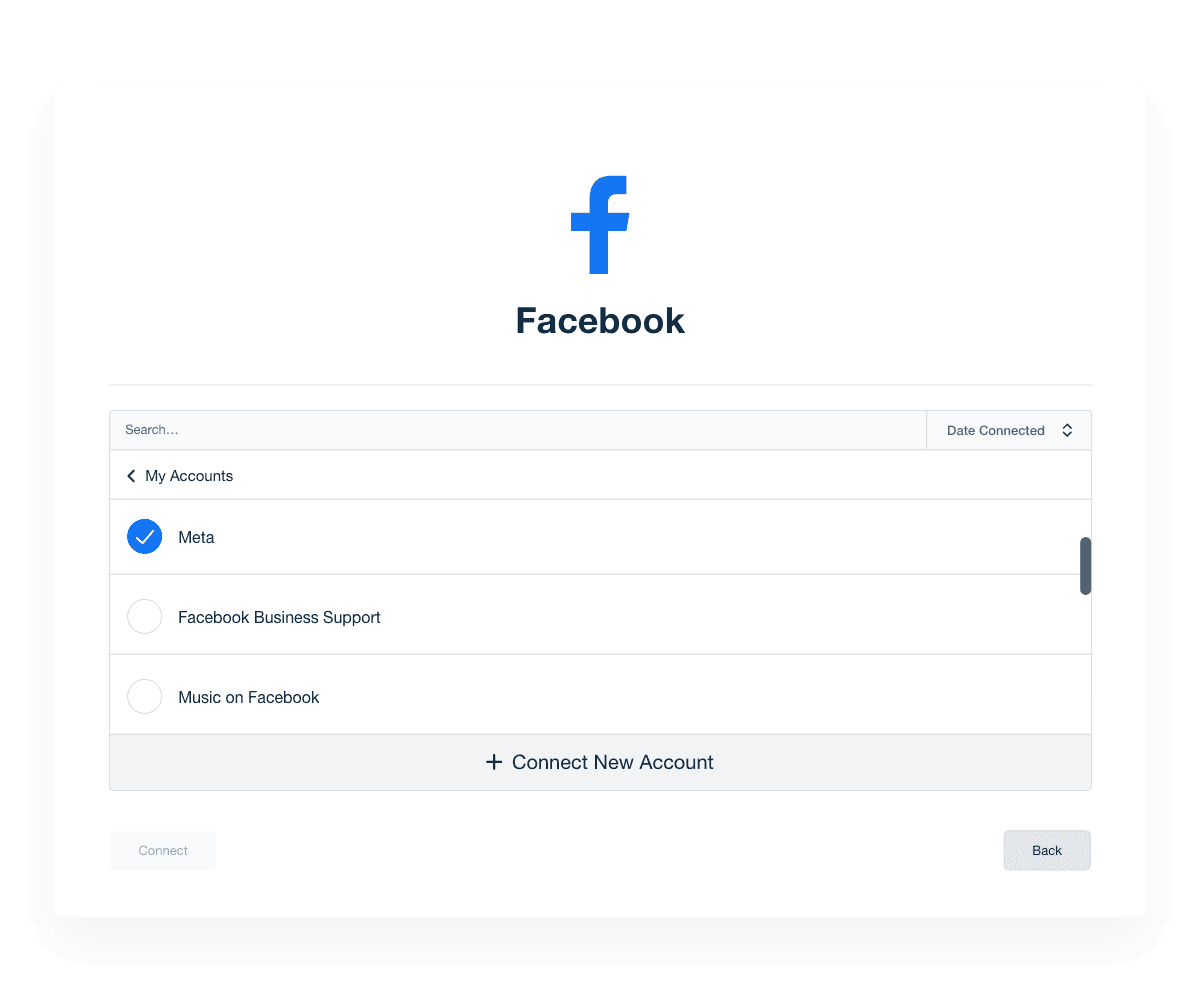
All Your Clients’ Facebook Pages Under One Roof
Stop logging into multiple Facebook accounts. Analyze all of your clients’ social media performance in a single dashboard to glean actionable campaign insights, and fast.

Track Engagement Metrics
Monitor your clients’ audience growth and Facebook page trends. Understand what drives new followers with metrics like paid vs. organic "Likes". Use these insights and impress clients with a clear dashboard showing audience growth over time.

Analyze User Reach
Quickly identify Facebook posts with the highest reach in our dashboard. Analyze the audience demographics for your client's campaign. Then easily share these KPIs with your client to show them the impact of your campaign.

In-Depth Post Analytics
Discover which posts deliver the most engagement and highest reach, so you can focus on the content that works. Staying on top of the feeds for all of your clients is a hassle. We simplify the process with quick access to post analytics for every page your agency manages.

White Labeled Facebook Dashboards
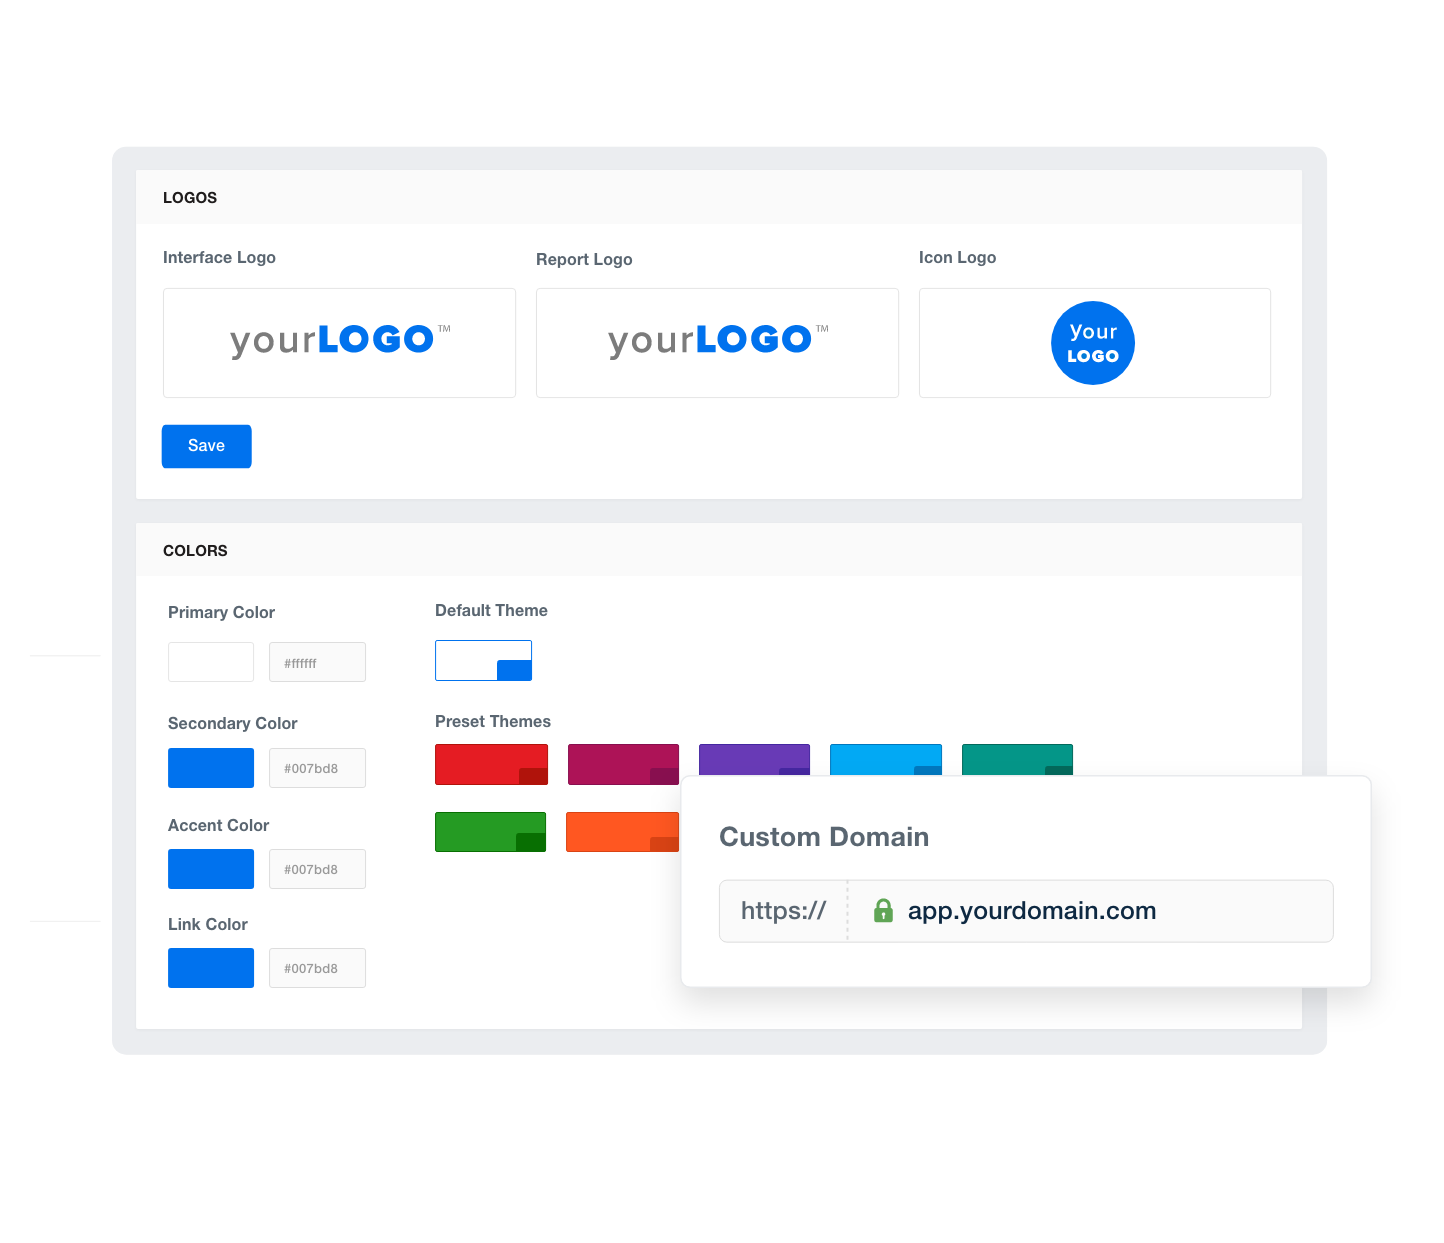
Upload your agency logo, add your brand’s color palette, and more. With AgencyAnalytics, you have everything you need to call these dashboards your own. For a complete white-labeled reporting experience, host your digital marketing dashboards on your own custom domain and send reports from your own email (available on the Agency plan and higher).

Get Started for Free