Table of Contents
QUICK SUMMARY:
Marketing data visualization techniques turn complex data into clear, actionable visuals that reveal trends, wins, and areas for improvement. Effective visuals simplify client reporting and strengthen decision-making. This guide outlines essential techniques for organizing data, highlighting performance, and improving client communication.
Raw data doesn't always tell the whole story, at least not in a way that clients can easily understand. Lists of numbers and percentages rarely show the real impact of a marketing campaign, and clients shouldn’t have to guess what’s working and what’s not.
Effective data visualization techniques bridge the gap between performance data and client understanding. They take complicated data points and turn them into clear, visual insights that make decisions faster and conversations easier.
It’s very difficult to explain the value of a service to a client without visuals.
Ruben Roel, President, Investigator Marketing
Good visuals highlight wins, flag issues, and prove value without a detailed walkthrough. With traditional business intelligence tools, even building simple graphs usually means fighting with exports and trying to force the data to fit.
AgencyAnalytics cuts out that friction by putting effective data visualization at the center of client reporting.
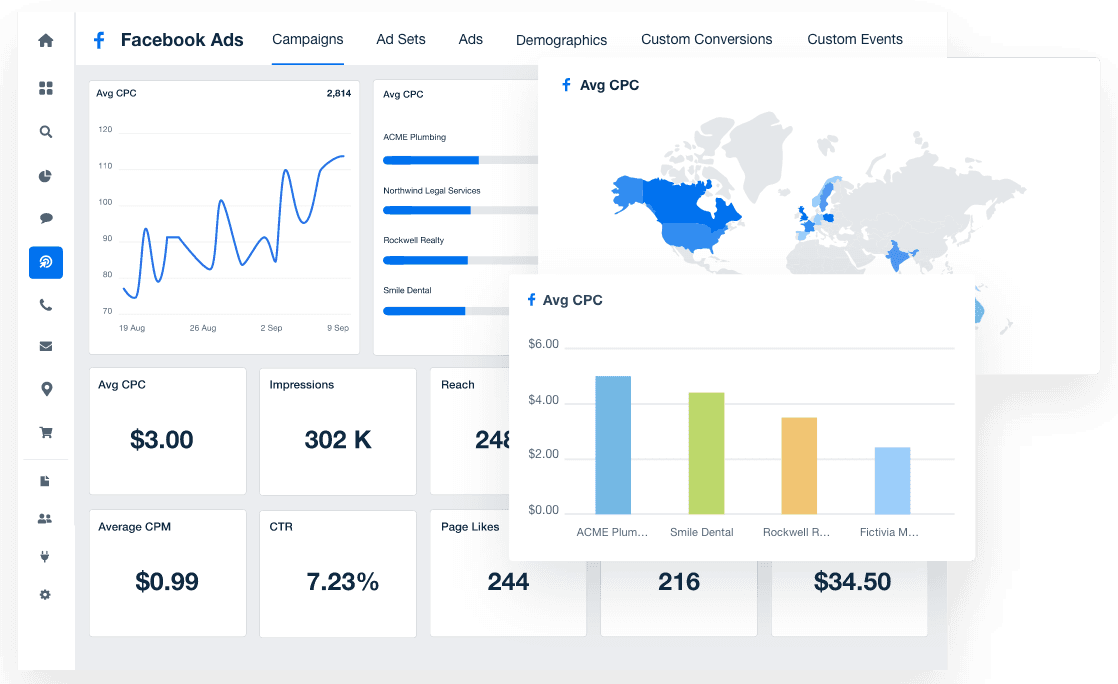
This guide breaks down the most valuable data visualization techniques for marketing agencies, making it easier to organize data, spot trends, and give clients the insights they actually want to see.
Let’s get started!
What Is Data Visualization?
Data visualization is the process of turning numbers, statistics, and measurements into visuals that are easier to understand. It makes it possible to spot patterns, trends, and outliers without needing to study long spreadsheets or dense data sets.
Our clients aren’t data analysts—they’re business owners, and they want insights they can actually use. We design the reports to be clean and easy to digest, with visuals like graphs and trend lines that make performance jumps or dips crystal clear.
Ryon Gross, CEO, Local Leap Marketing
Using the right data visualization tools takes the pressure off manual reporting and saves time on data analysis. Instead of sorting through disconnected metrics, reports become a clean, easy-to-follow story that highlights what matters most.
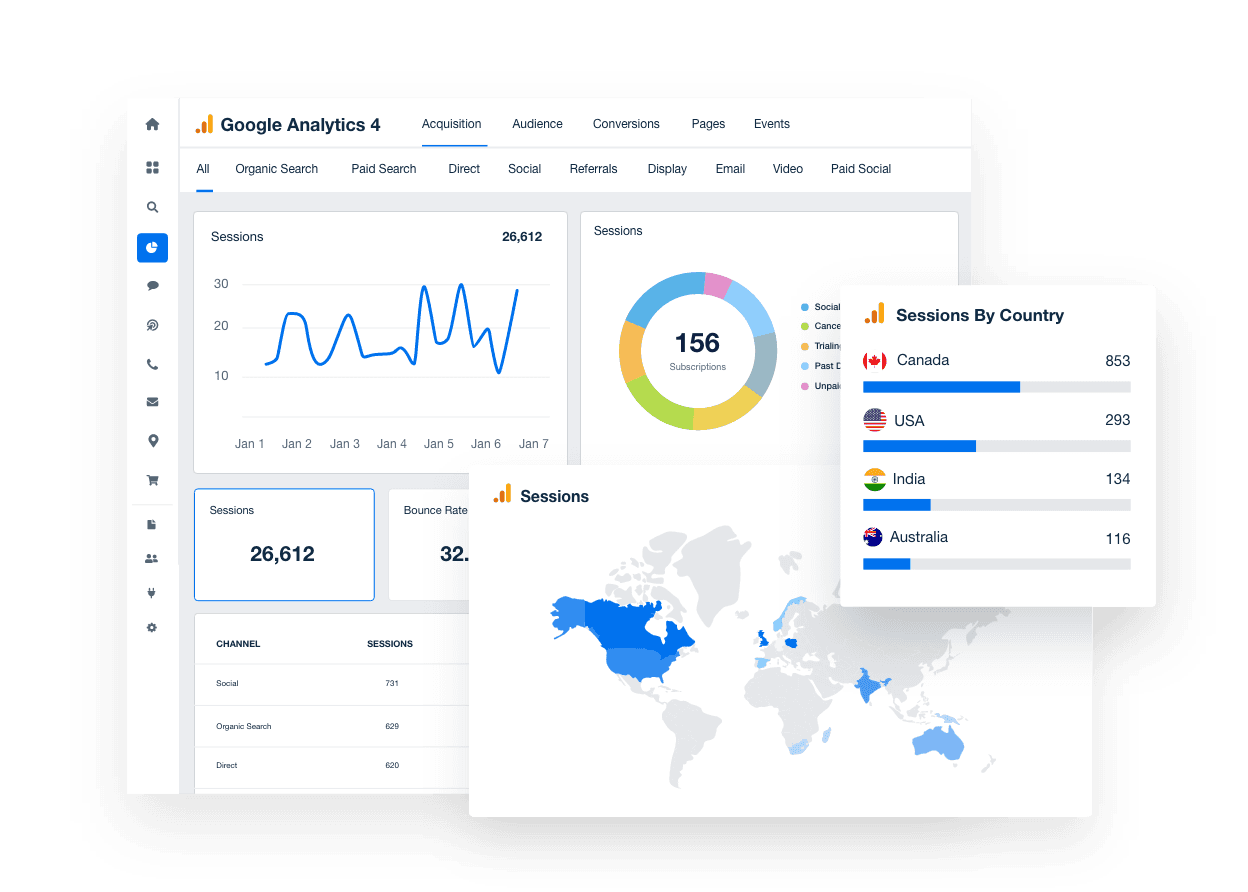
Good data visualization leads to three outcomes that matter in client relationships:
Clarity: Clients immediately see what is happening without needing long explanations.
Faster Decisions: Easy-to-read visuals make it easier for clients to approve strategies, suggest changes, or spot problems early.
Better Relationships: When clients understand their marketing results quickly, trust builds faster, and collaboration feels smoother.
In short, strong visuals turn raw data into clear, actionable insights. In an industry where attention is short and results matter, presenting data using the right visualization tools and techniques is key to delivering real value.
Data Visualization Best Practices
To make data insights clear, it’s important to think about how to organize and display data so that clients immediately understand what is happening and why it matters.
Focus on creating reports that are clear, concise, and actionable. This means using data visualization tools like charts, graphs, and tables to help clients quickly and easily understand the performance of their campaigns and website.
It also means providing context and explanations for the data presented, so clients can understand what the data means and how it relates to their business goals.
Daniel Dye, President, Native Rank, Inc.
These best practices help keep reports clean, focused, and effective when presenting any type of data.
Keep It Simple and Focused
Too many visuals at once bury the real message. Clean layouts, limited colors, and clear labels help clients immediately spot trends without digging. Therefore, every graph, chart, or table should drive one point home without distractions.
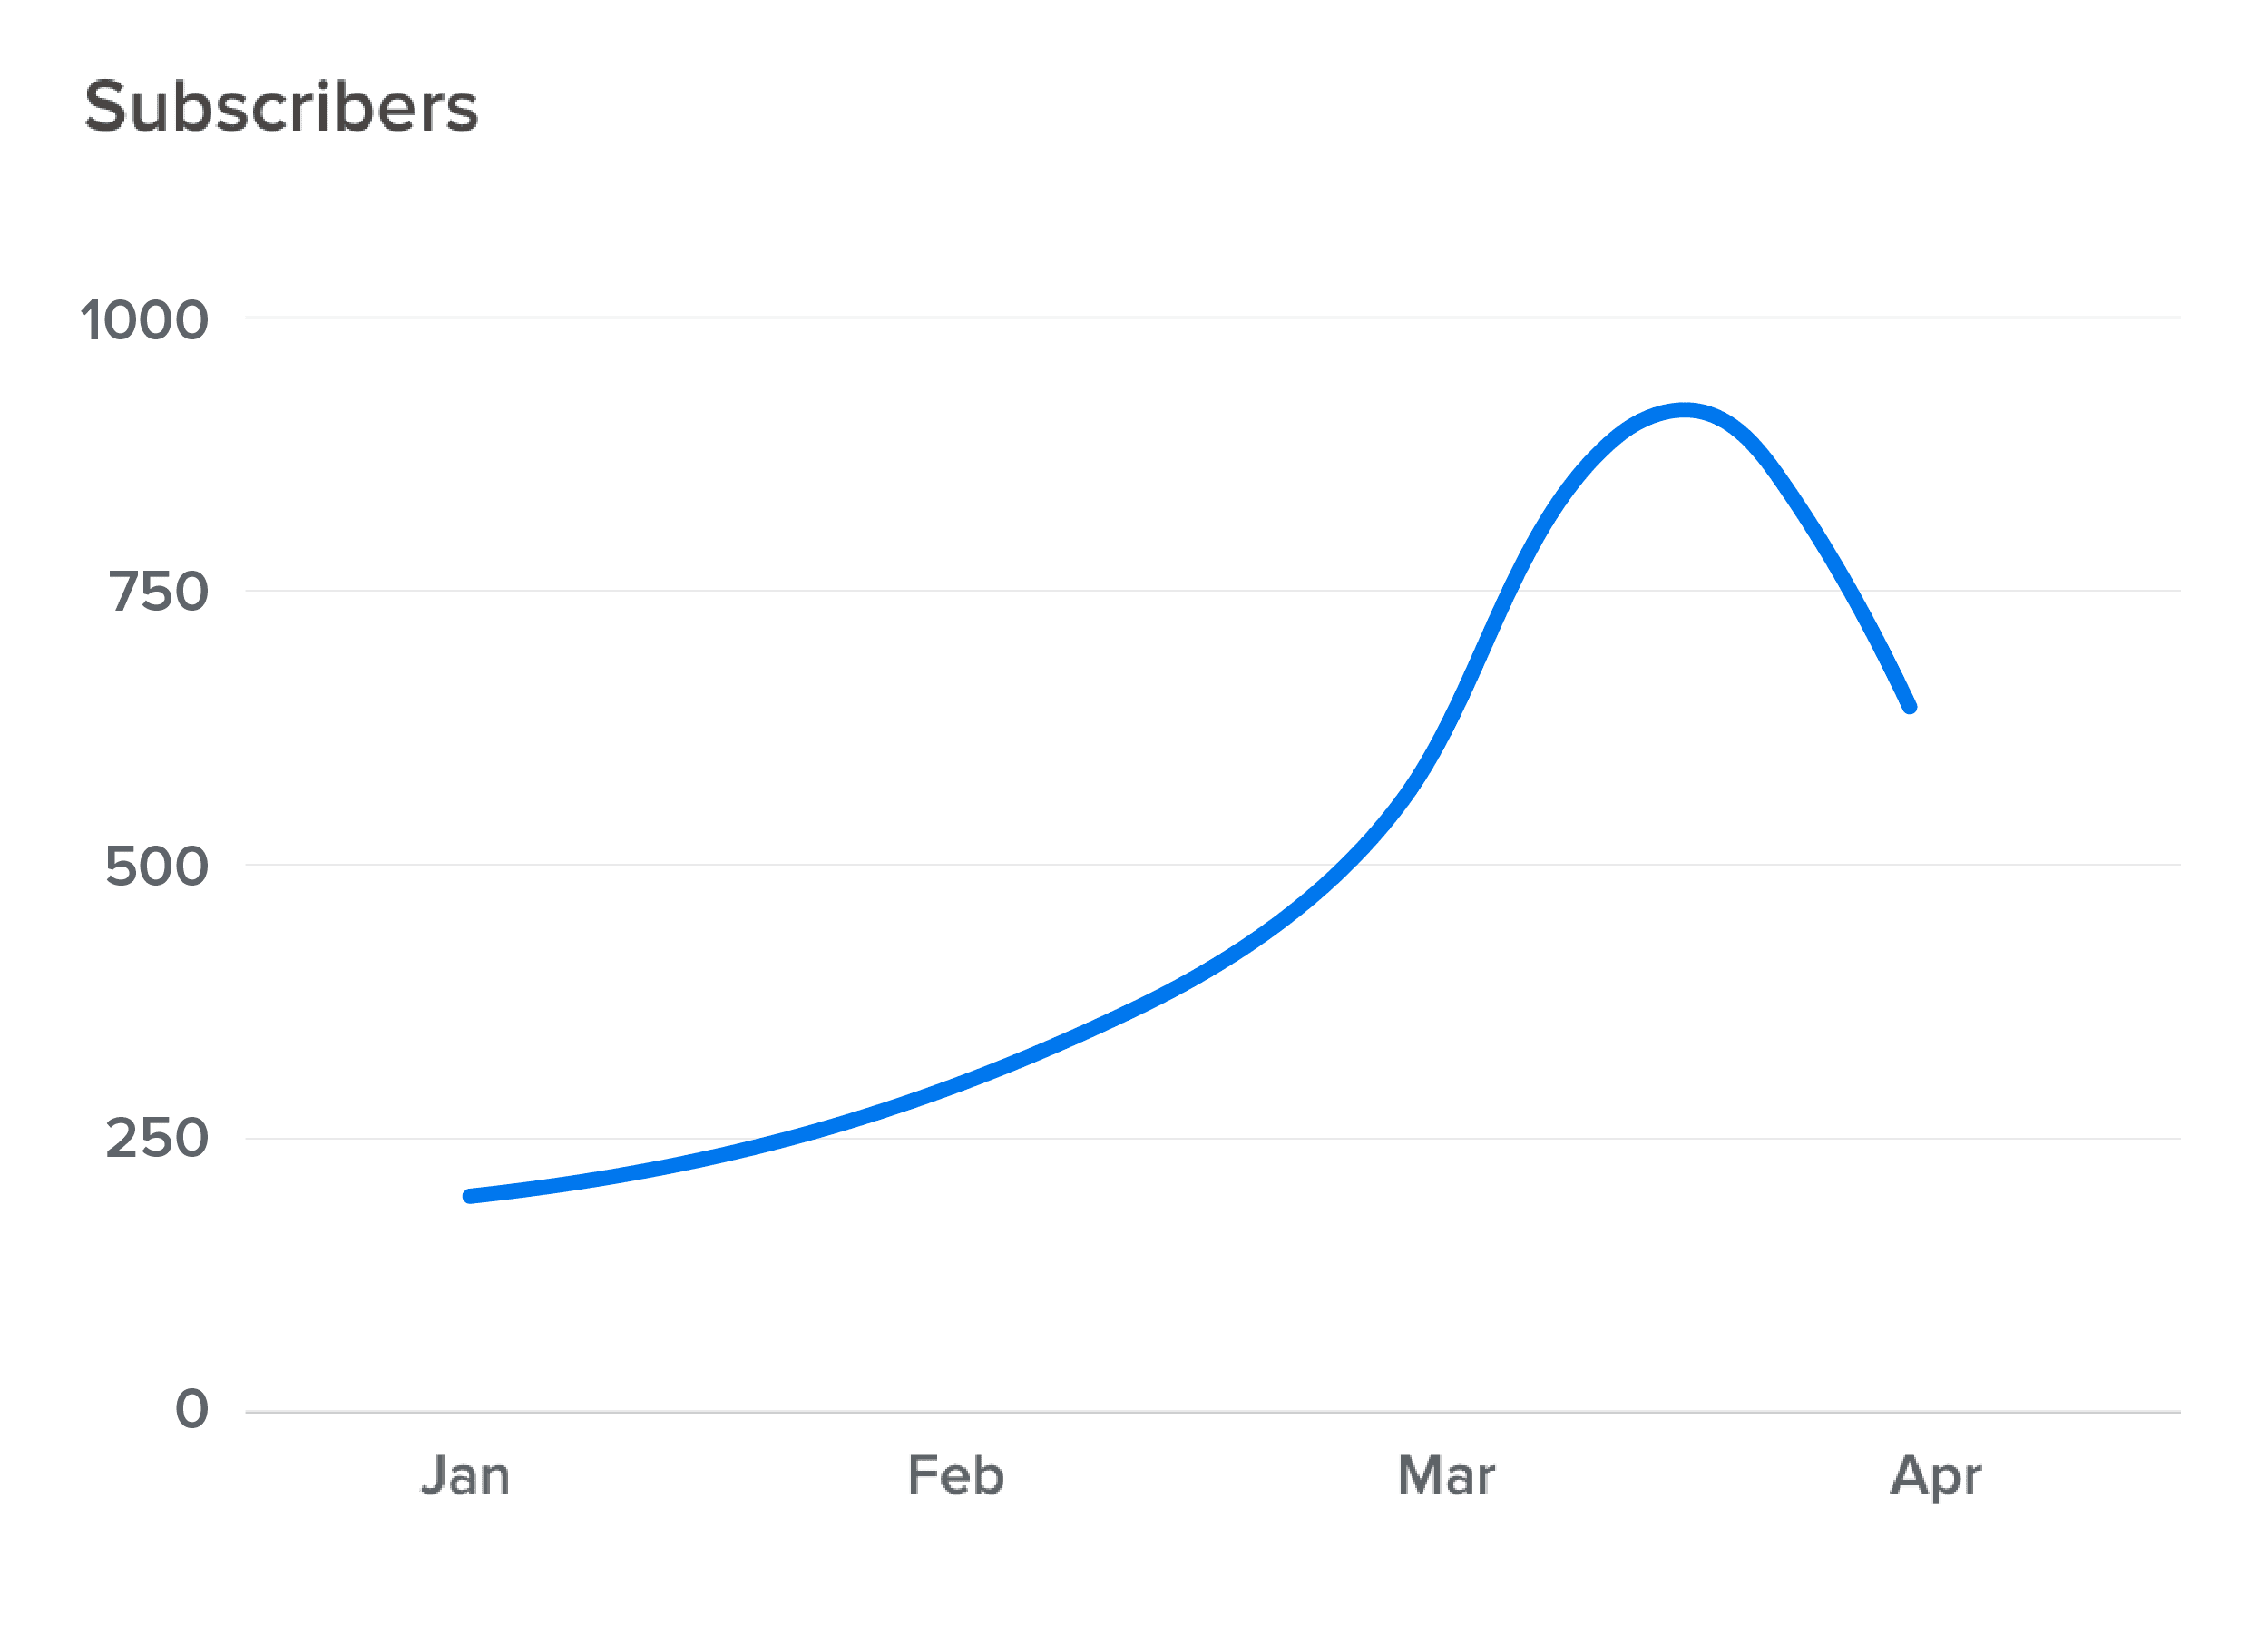
Example: Instead of five social media subscriber graphs, use custom metrics to combine them into one clean line chart showing total monthly subscribers, which tells the story faster.
Choose the Right Visual for the Right Data Points
Each type of data needs to be displayed in the right way. Bar charts beat pie charts for comparing campaign performance or sales data, while line charts win for showcasing trends over time. Picking the wrong format hides insights instead of highlighting them.
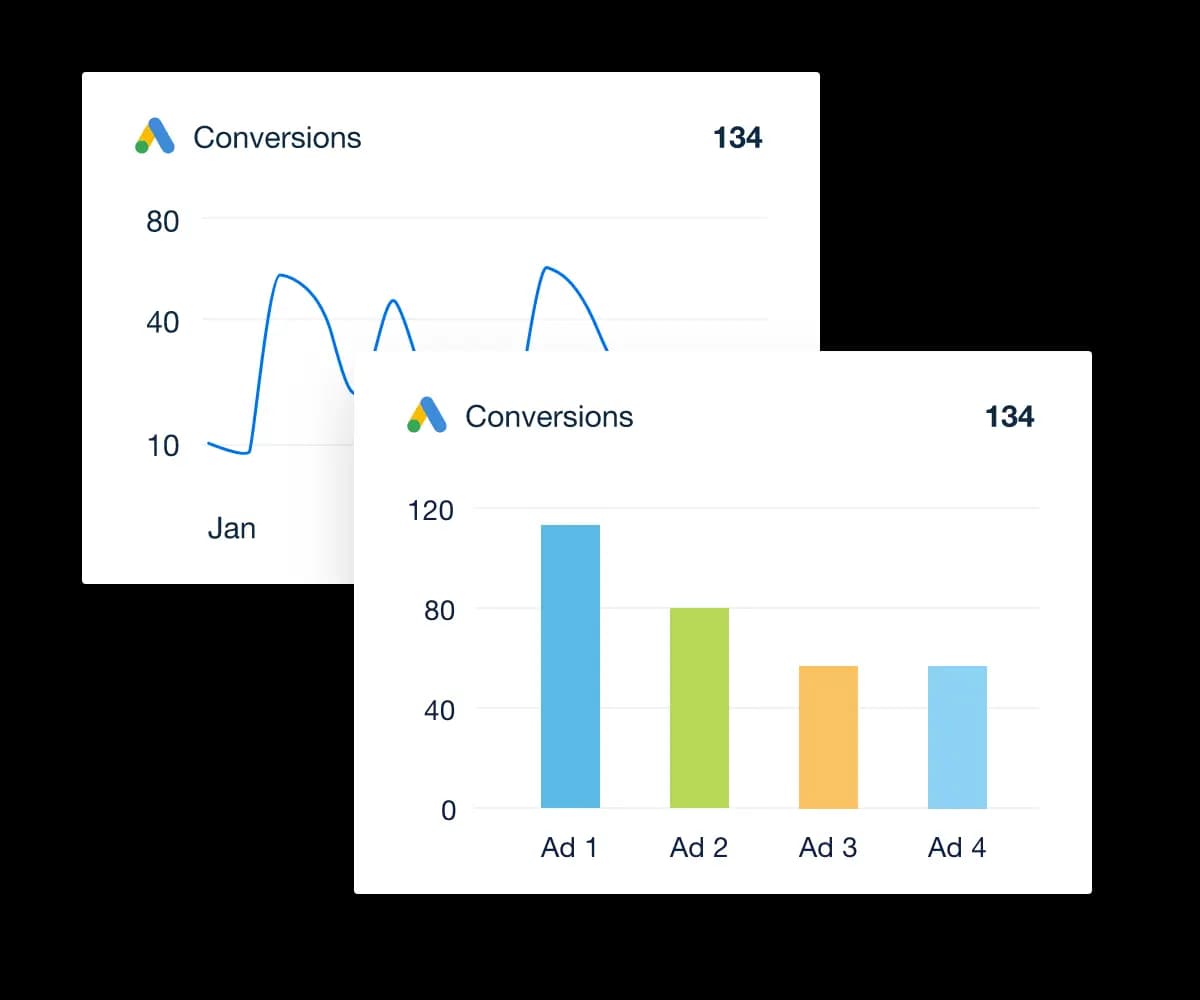
Example: A bar chart comparing Google Ad campaign leads side-by-side makes it instantly clear which ad performs better, while a line chart will show performance growth (or dips) month-to-month.
Highlight Insights, Not Just Data
A chart full of numbers isn’t a win unless it shows something important. Every visual should drive attention to what matters, be it wins or gaps that need action.
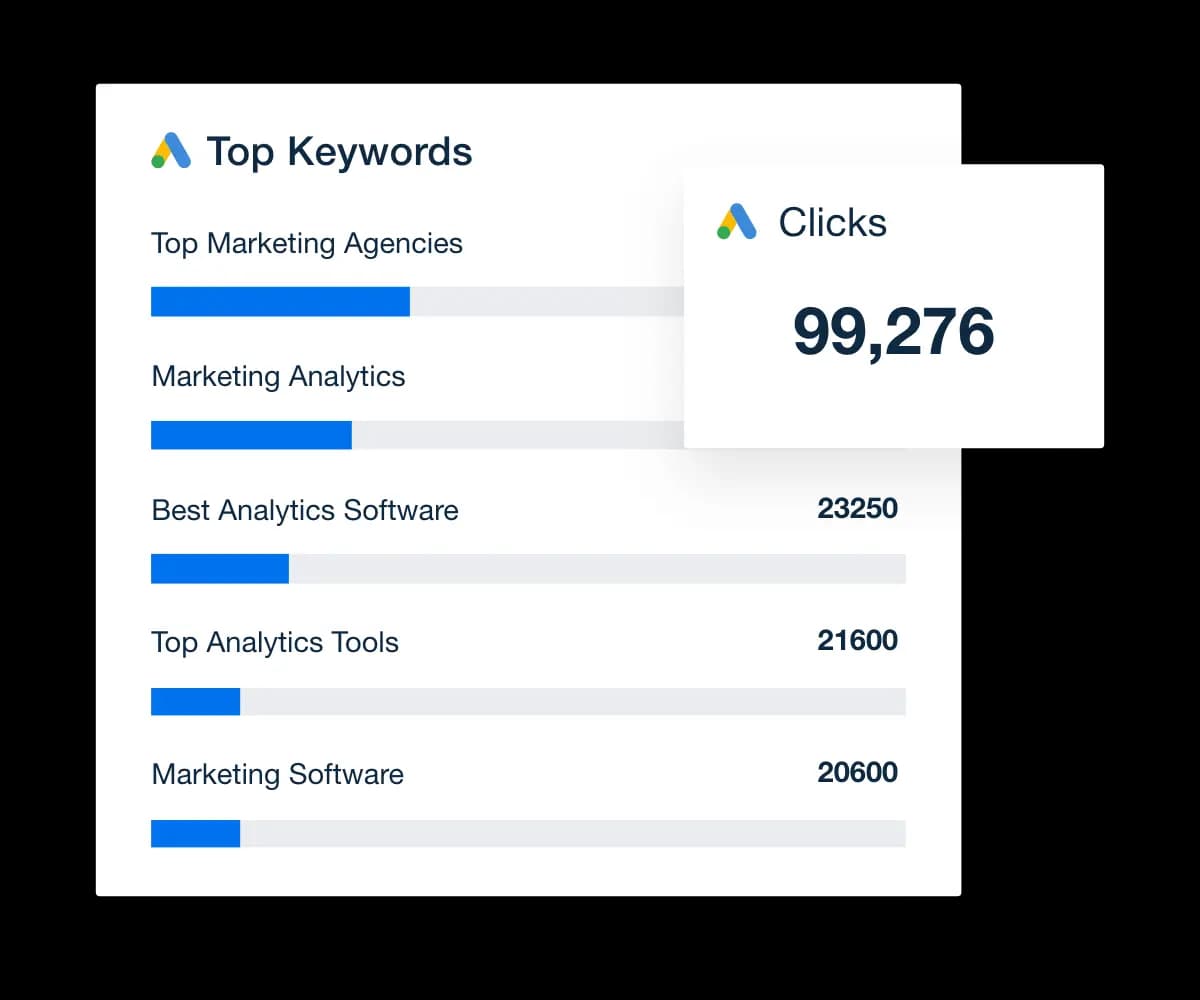
Example: Instead of showing all PPC keywords, highlight the ones that drove 80% of traffic last month.
Make Comparisons Easy to See
Reports that force clients to guess could cause them to lose trust. Make differences obvious, whether it's month-over-month growth or channel comparisons.
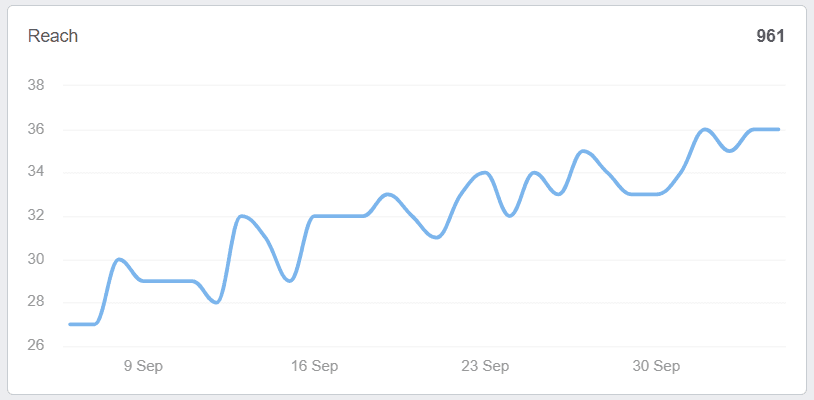
Example: Using the same y-axis for different months' social media analytics lets clients spot progress without recalculating in their heads.
Think About What Story Needs to Be Told
Great reports are a story, not a data dump. Focus charts around the client’s biggest questions: What worked? What needs work? What changed?
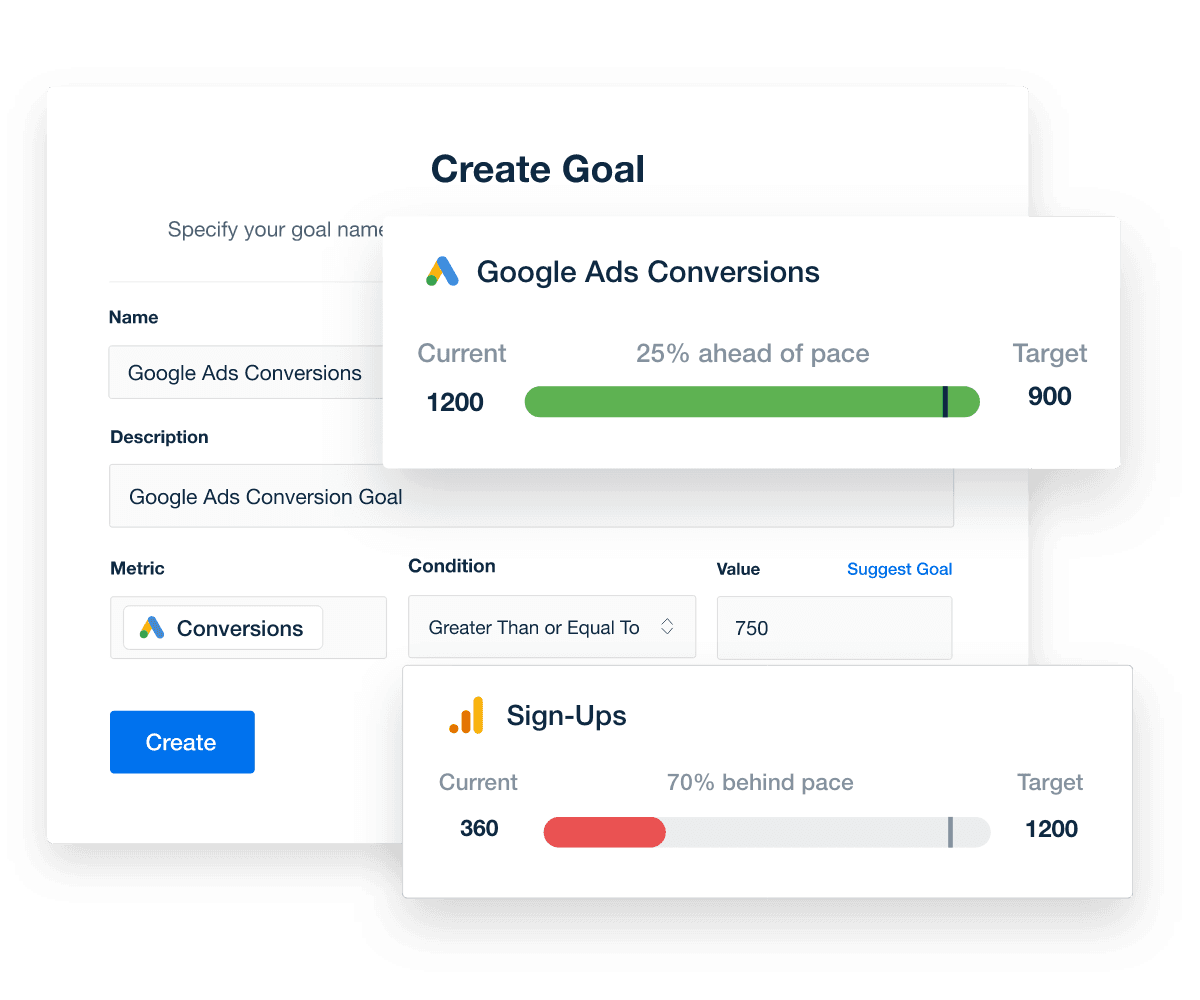
Example: A goal tracker that shows a campaign moving from 70% to 95% of the target tells a strong, positive story at a glance. Similarly, goals highlight areas that might need additional focus to hit targets.
For agencies that want to simplify reporting, using the right data visualization tools makes a big difference.
Instead of wrestling with general-purpose software built for data scientists, tools designed for client reporting make it faster and easier to organize, visualize, and display data. Try AgencyAnalytics free for 14 days.
Core Data Visualization Techniques for Marketing Reports
Choosing the right way to display data makes all the difference when turning campaign results into client-ready reports. Different techniques work better depending on the data types, the insights needed, and how the client likes to view performance.
Below are some of the most effective ways to visualize data for marketing client reports. Each is designed to keep reports simple, clear, and focused on the results that matter.
Line Charts
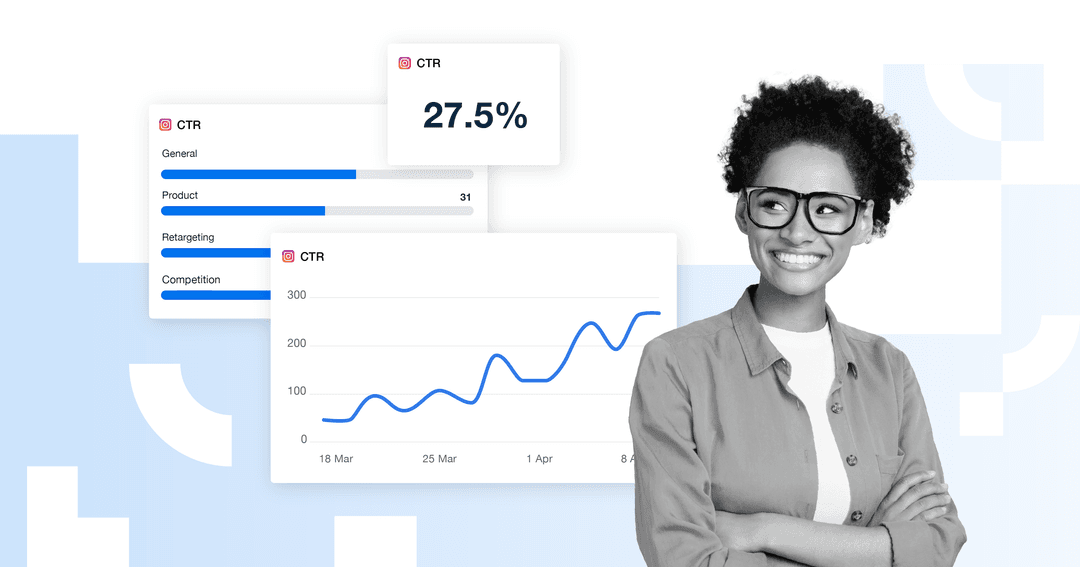
Line charts and graphs are one of the best ways to show performance over time. They make it easy to identify trends across a campaign’s lifespan, whether that’s website traffic, ad spend, or conversions.
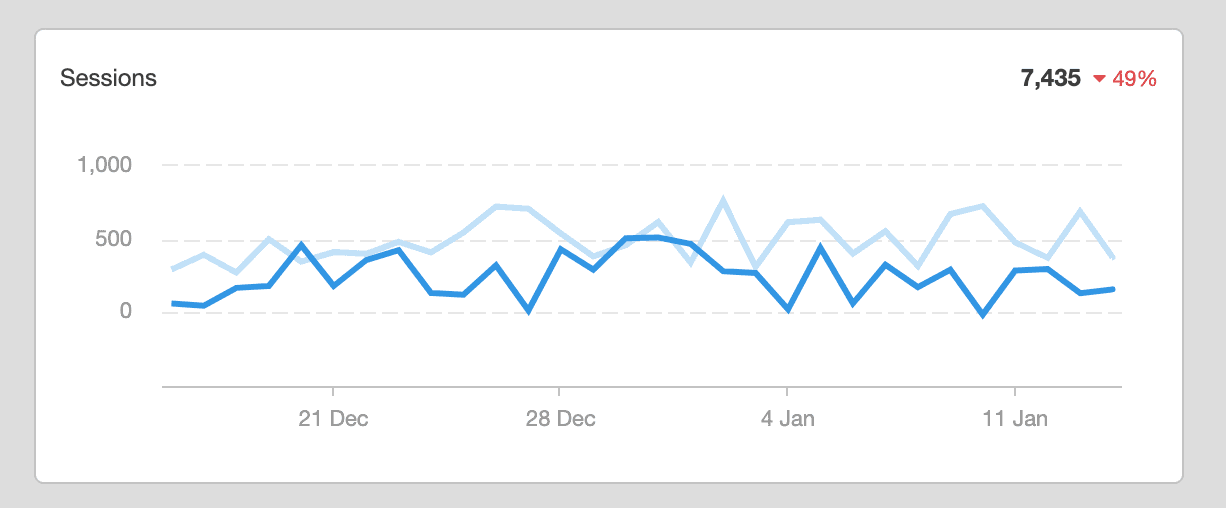
By connecting data points in a clean line, these graphs highlight rises, dips, and steady growth at a glance, helping clients quickly understand how efforts are tracking against their business goals.
Bar Charts
Bar charts are ideal for comparing different sets of data across campaigns, channels, or time periods.
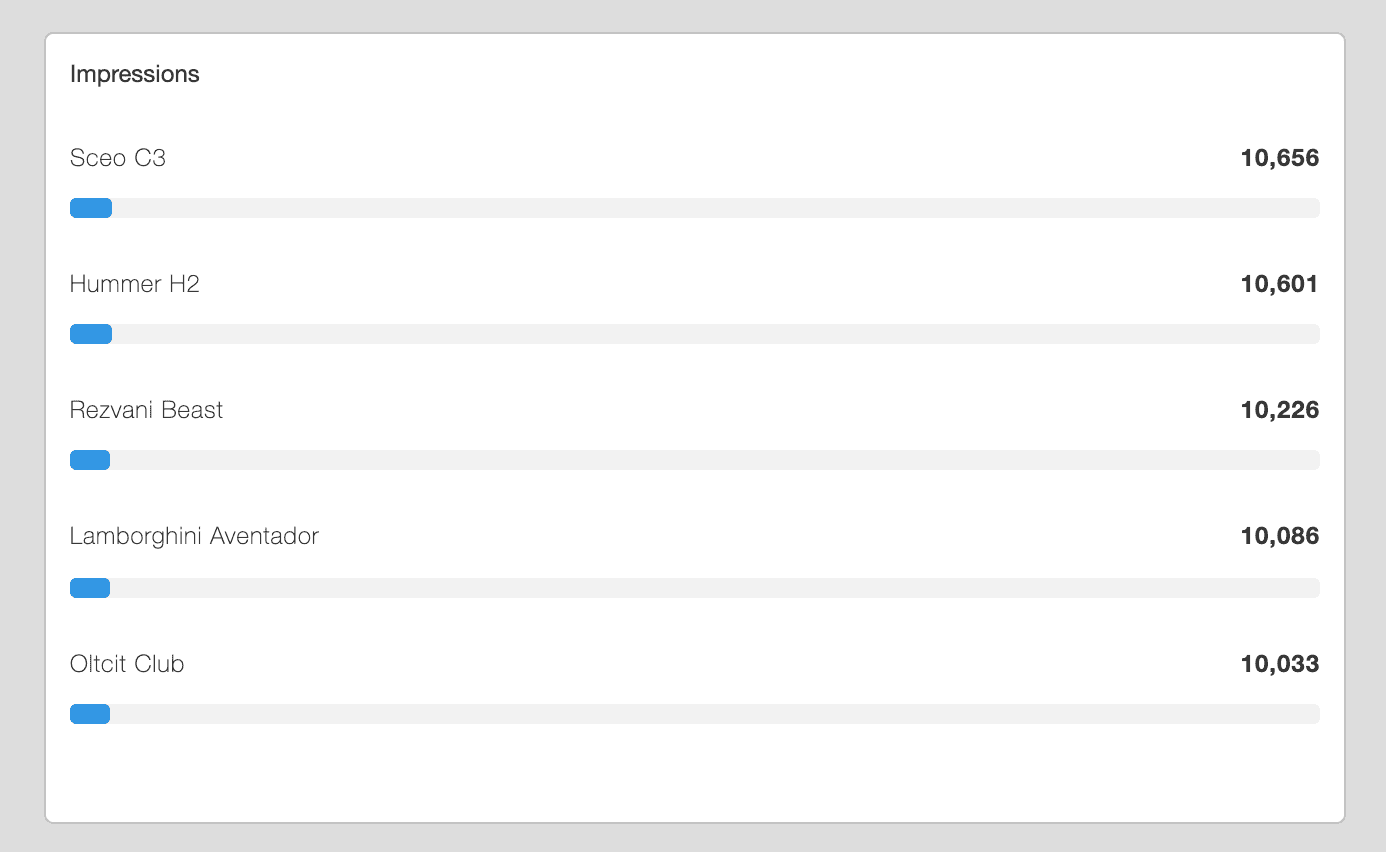
They clearly display data side-by-side, making it easy to see which ads performed best, which channels drove the most conversions, or which social media platforms delivered the highest engagement.
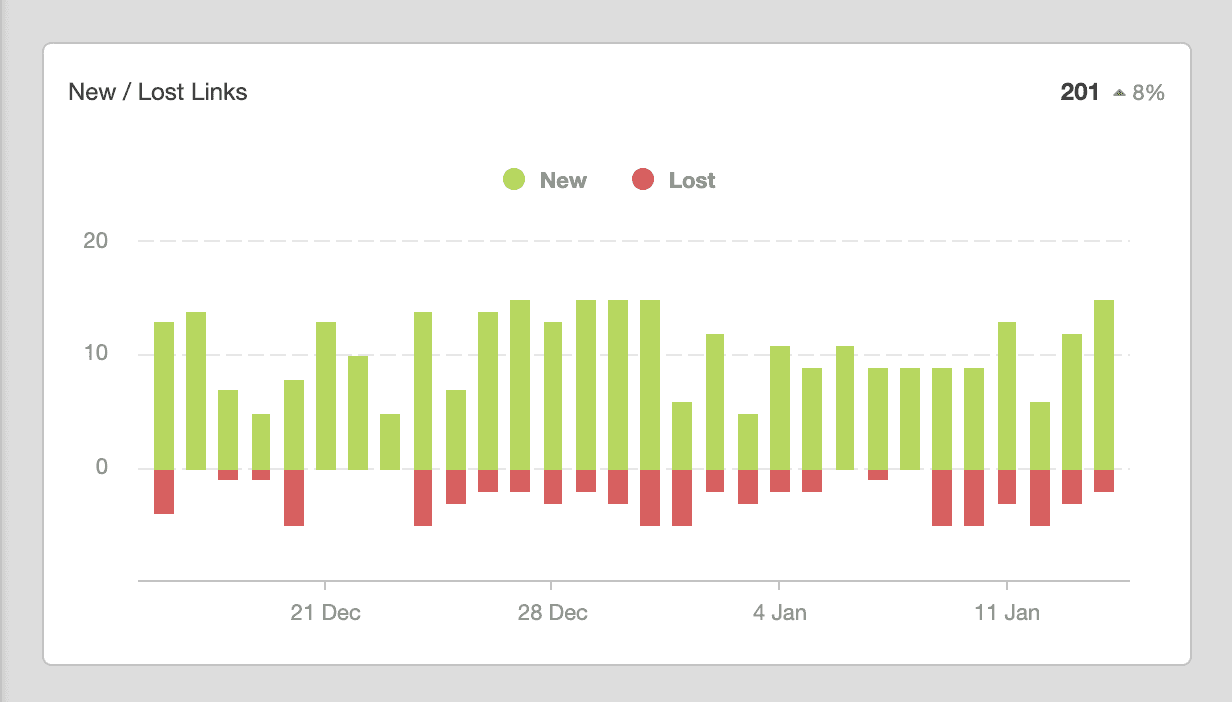
One of the most popular data visualization techniques, bar charts simplify large amounts of data generated across marketing efforts into something clients can process quickly.
Pie Charts
Pie charts are best used when breaking down percentages within a whole, like showing how a total budget was split across different platforms or how many sessions each channel generated.
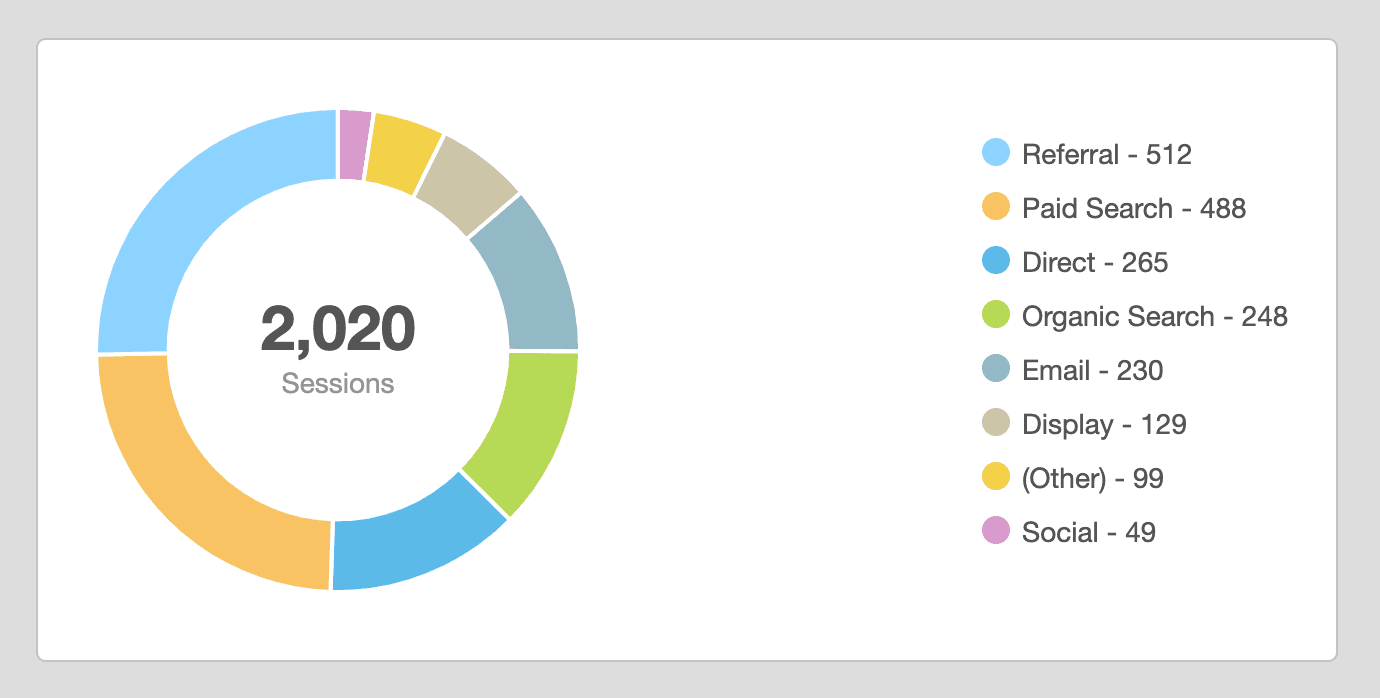
They should be used sparingly, though. Pie charts make sense when there are just a few categories to compare; too many slices can make them harder to read and less helpful for highlighting key insights.
Tables
Tables are still necessary when clients need to see detailed data that can't easily be condensed into a visual.
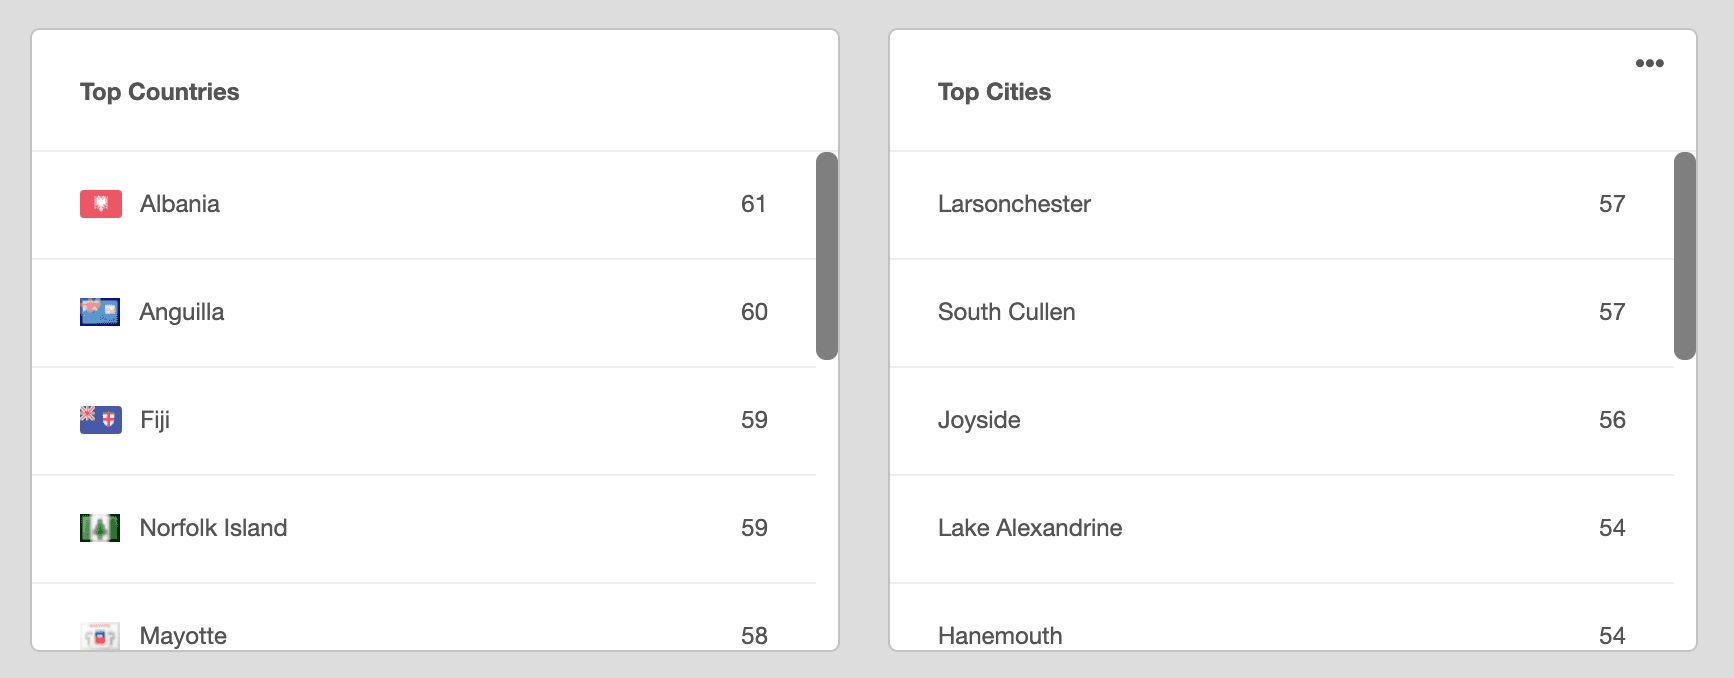
A well-formatted table organizes complex data sets without overwhelming the reader. It is especially useful for financial data, keyword lists, or campaign breakdowns where precision matters.
Stacked Charts
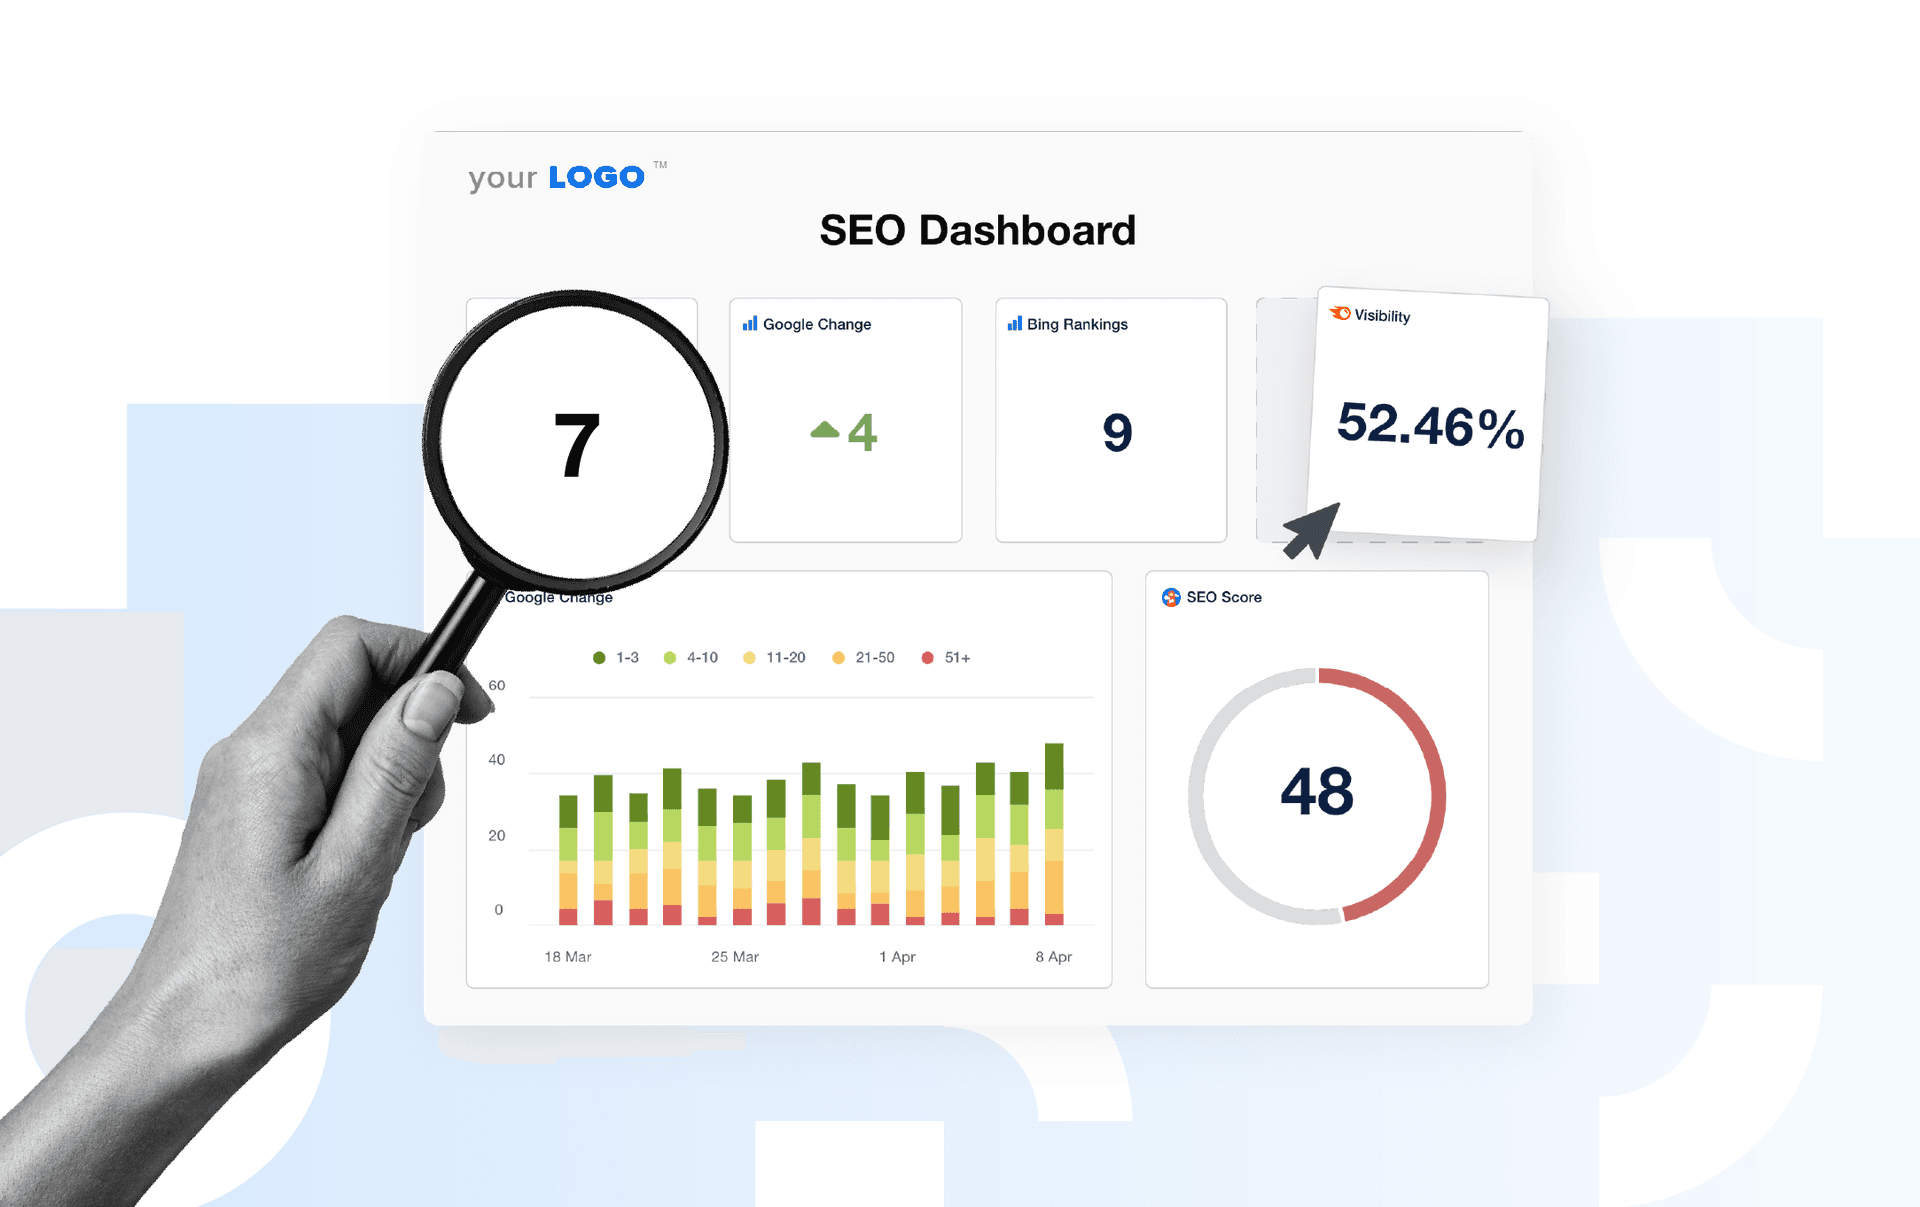
Stacked column charts allow you to visualize the distribution of a specific metric.
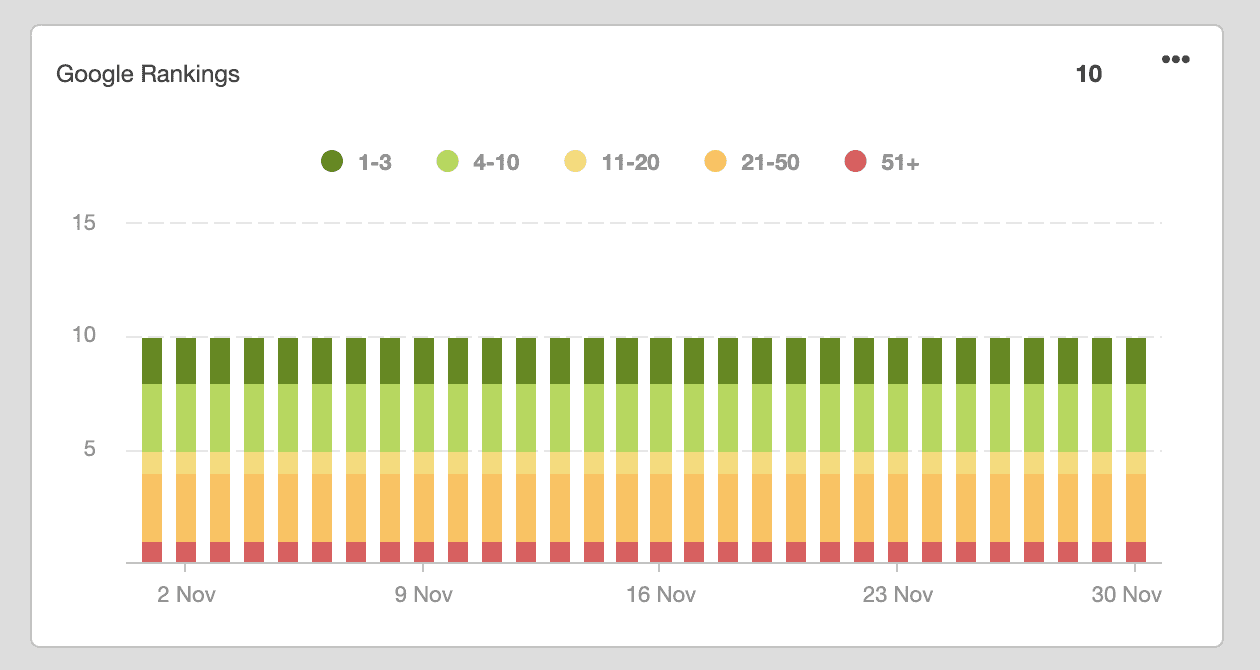
For example, if your clients want to track significant changes in SERP rankings, these types of charts do that job very nicely.
Map Charts
Map charts are used to visualize spatial data, making it simple to see geographic trends.
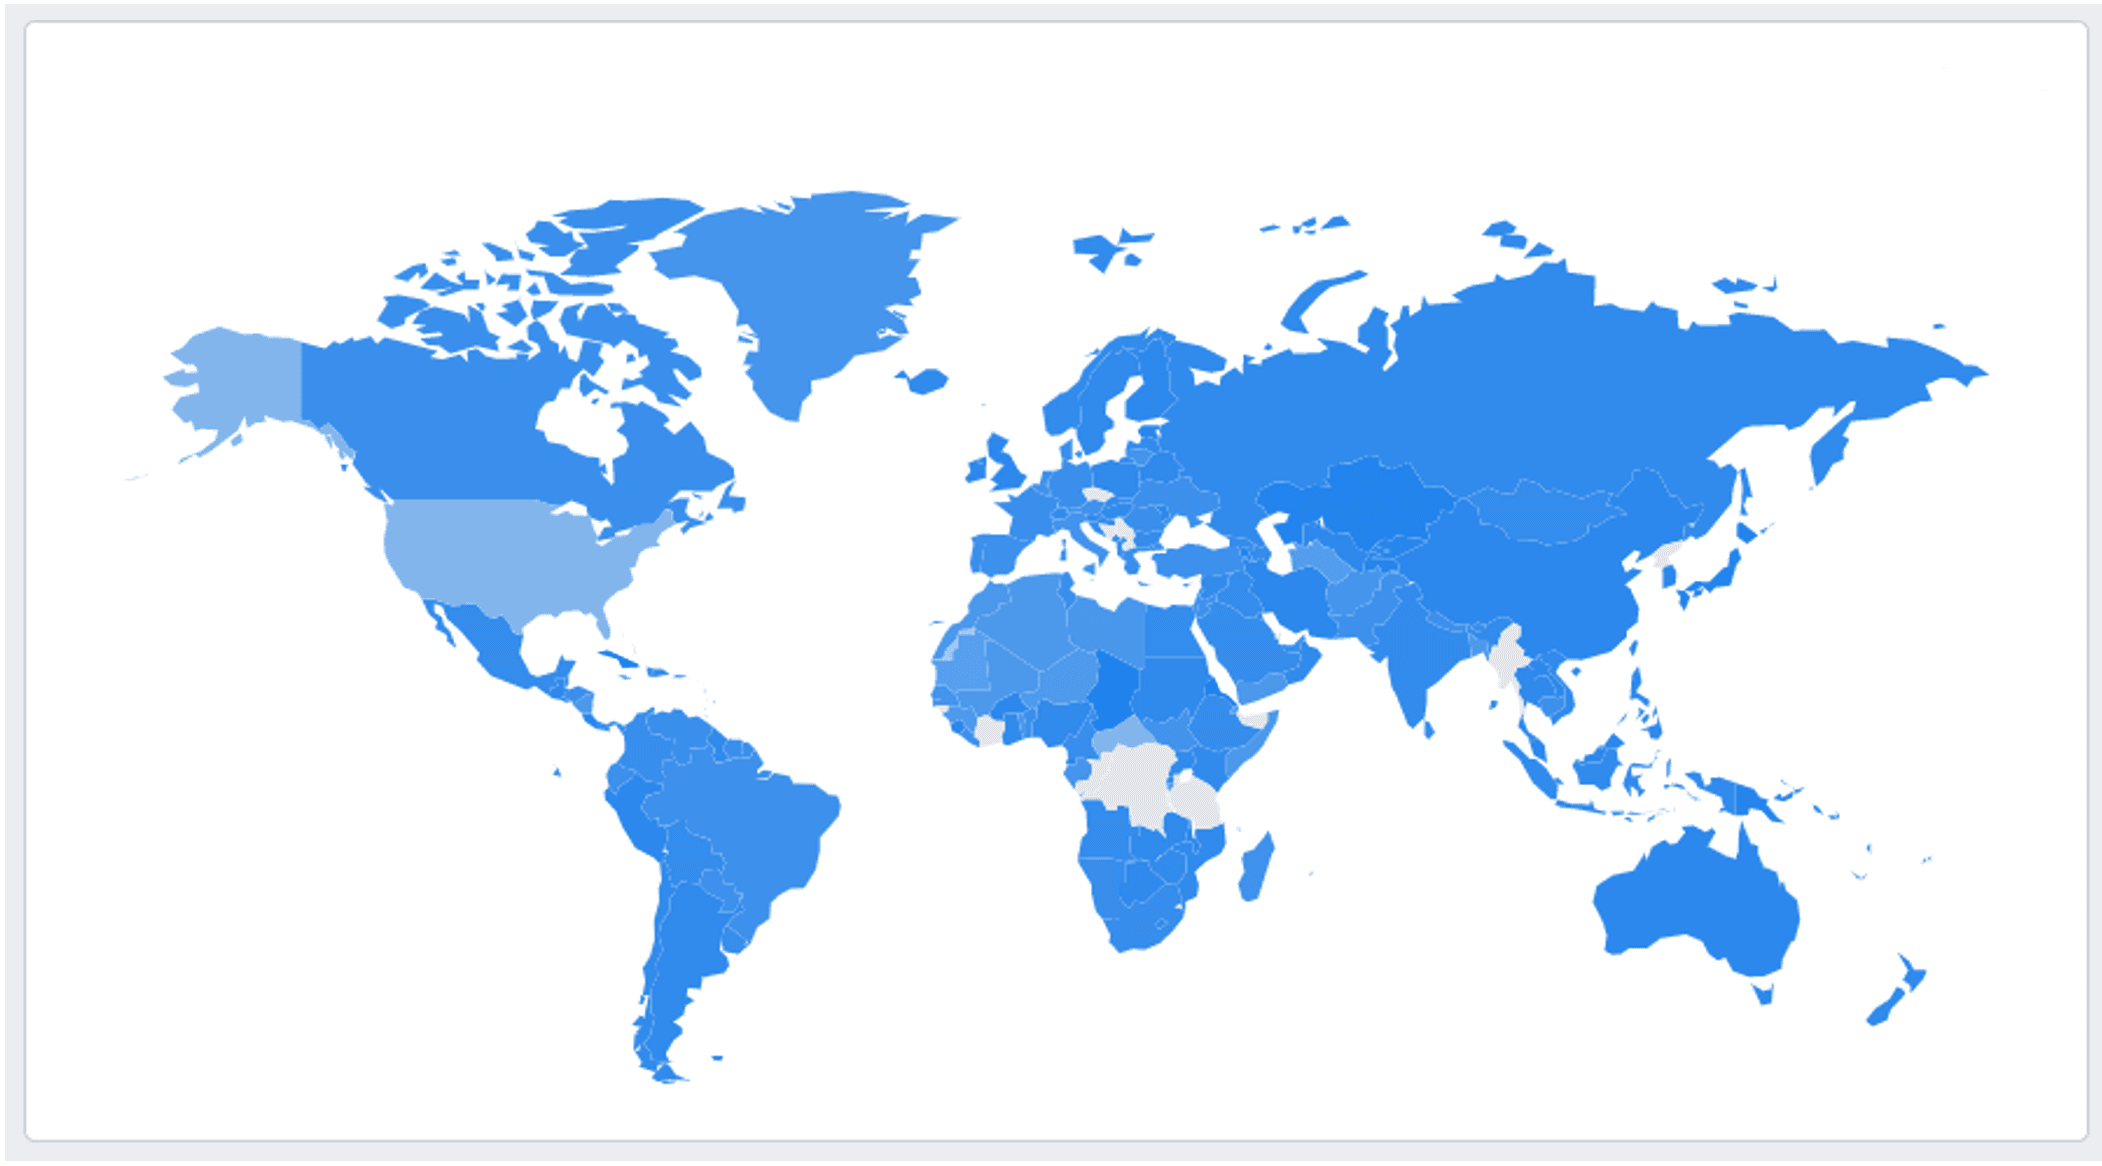
Whether breaking down paid search results by region or highlighting where new leads are coming from, map charts help identify trends based on location. They make it easy for clients to spot market opportunities or gaps.
Combo Charts
Combo charts mix two types of visuals, usually bars or stats with lines, into a single graph.

They are perfect for multi-metric storytelling, such as showing ad spend alongside conversions, or for displaying a particular data point, like sales, both in terms of absolute numbers and the growth pattern.
Goal Trackers
Goal trackers clearly show how performance stacks up against set targets.
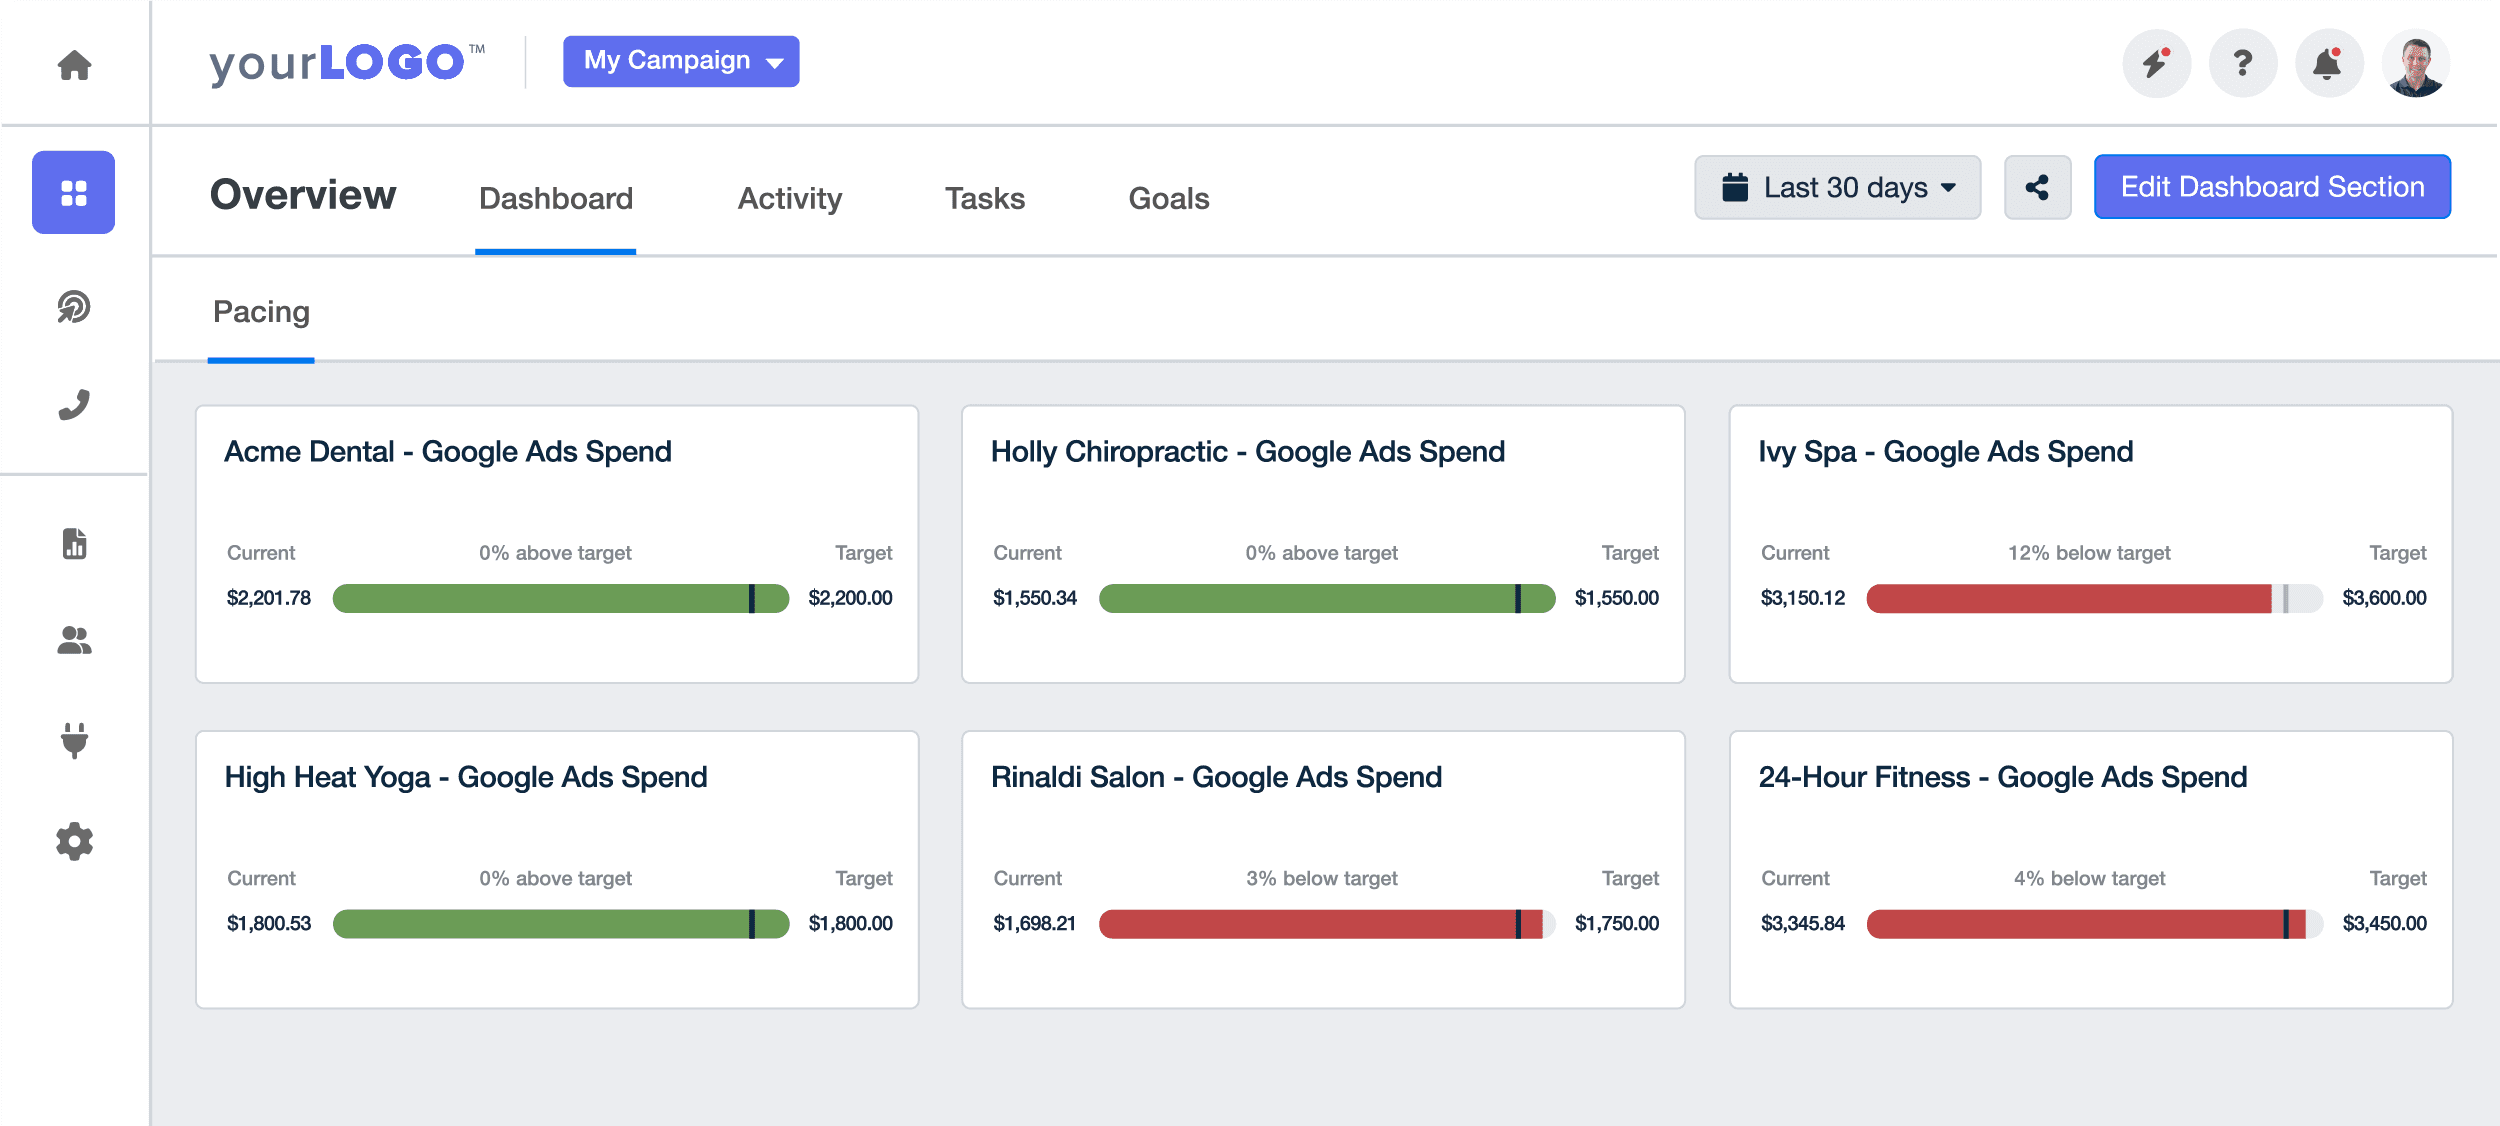
They help display data progress in a way that motivates action, either to push harder toward goals or celebrate hitting them. Whether tracking ad budgets, SEO keyword rankings, paid ad conversions, or lead targets, goal trackers make it simple to highlight key insights without extra explanation.
By customizing dashboards, we can highlight and prioritize the client KPIs that are most relevant to them, ensuring that we’re delivering data that’s both actionable and meaningful to them.

Common Mistakes in Data Visualization
Even the best data visualization techniques lose their power when small mistakes pile up. A good report should make complex information easier to understand, not harder.
By avoiding these common problems, reports stay clear, relevant, and helpful for making decisions based on real business insights.
Overloading a Report With Too Many Visuals: Adding too many visual elements overwhelms the reader and buries the key points. Instead of creating dashboards packed with every metric, focus on the visuals that support the main story.
Picking the Wrong Type of Chart for the Data: Choosing the wrong visual form hides trends instead of helping to generate insights. Effective visualizations come from matching the right chart style to the specific data points being shared, making it easier to explore data and spot patterns.
Ignoring How the Client Thinks or What They Care About: When building reports, it is easy to fall into data exploration mode—adding charts based on what looks interesting, not what matters to the client. Reports should be built around the client’s goals, preferred visual context, and the metrics tied to their success.
Using Visuals That Hide the Real Insights: Charts filled with too many numerical values, unclear labels, or overloaded color schemes often hide the insights that should be clear. Every chart, table, or graphic should help the reader grasp the key points without second-guessing what the data means.
Not Accounting for Data Accuracy: Even the best-designed visual can fall apart if the numbers behind it are wrong. Effective visualizations start with trusted data sources and accurate calculations.
How AgencyAnalytics Helps Simplify Complex Data, Without a Data Science Degree
Building clear, powerful data visualizations across multiple clients shouldn’t feel like a full-time job. Manually exporting numbers, picking chart types, and adjusting visuals every month drains time that should be spent on strategy. AgencyAnalytics removes the busywork by making it easy to organize, visualize, and present complex data without the usual headaches.
Here’s how it streamlines the process:
Built-In Data Visualization Tools Designed for Marketing
AgencyAnalytics has built-in data visualization tools designed to display complex information clearly and cleanly.
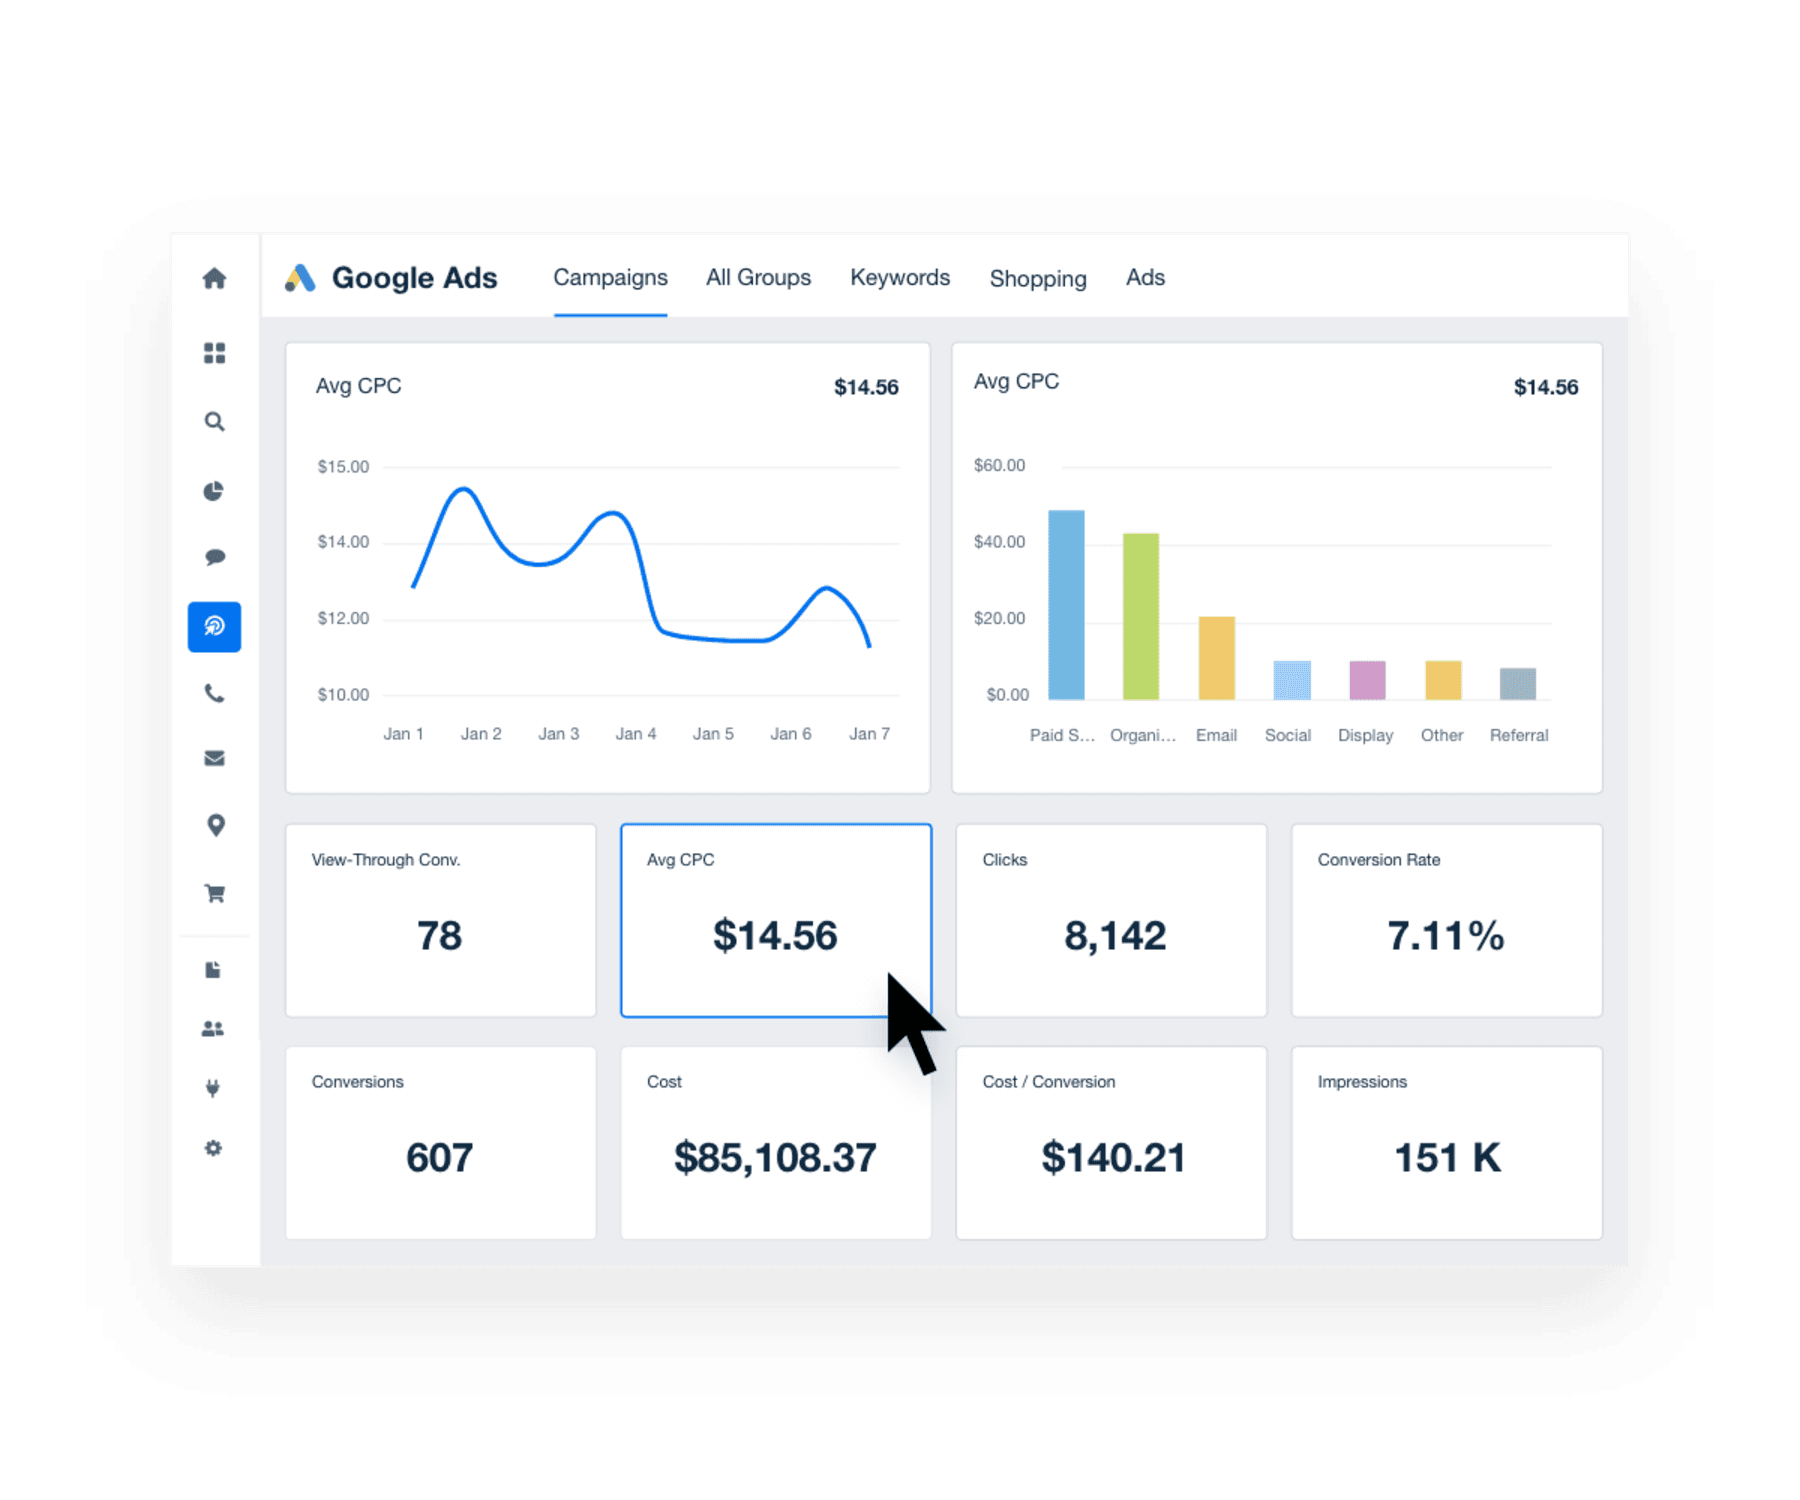
Everything from basic charts to customizable visualizations is geared toward creating compelling visuals that make campaign performance dashboards easy to understand.
Drag-and-Drop Reports & Dashboards Built for Marketing Metrics
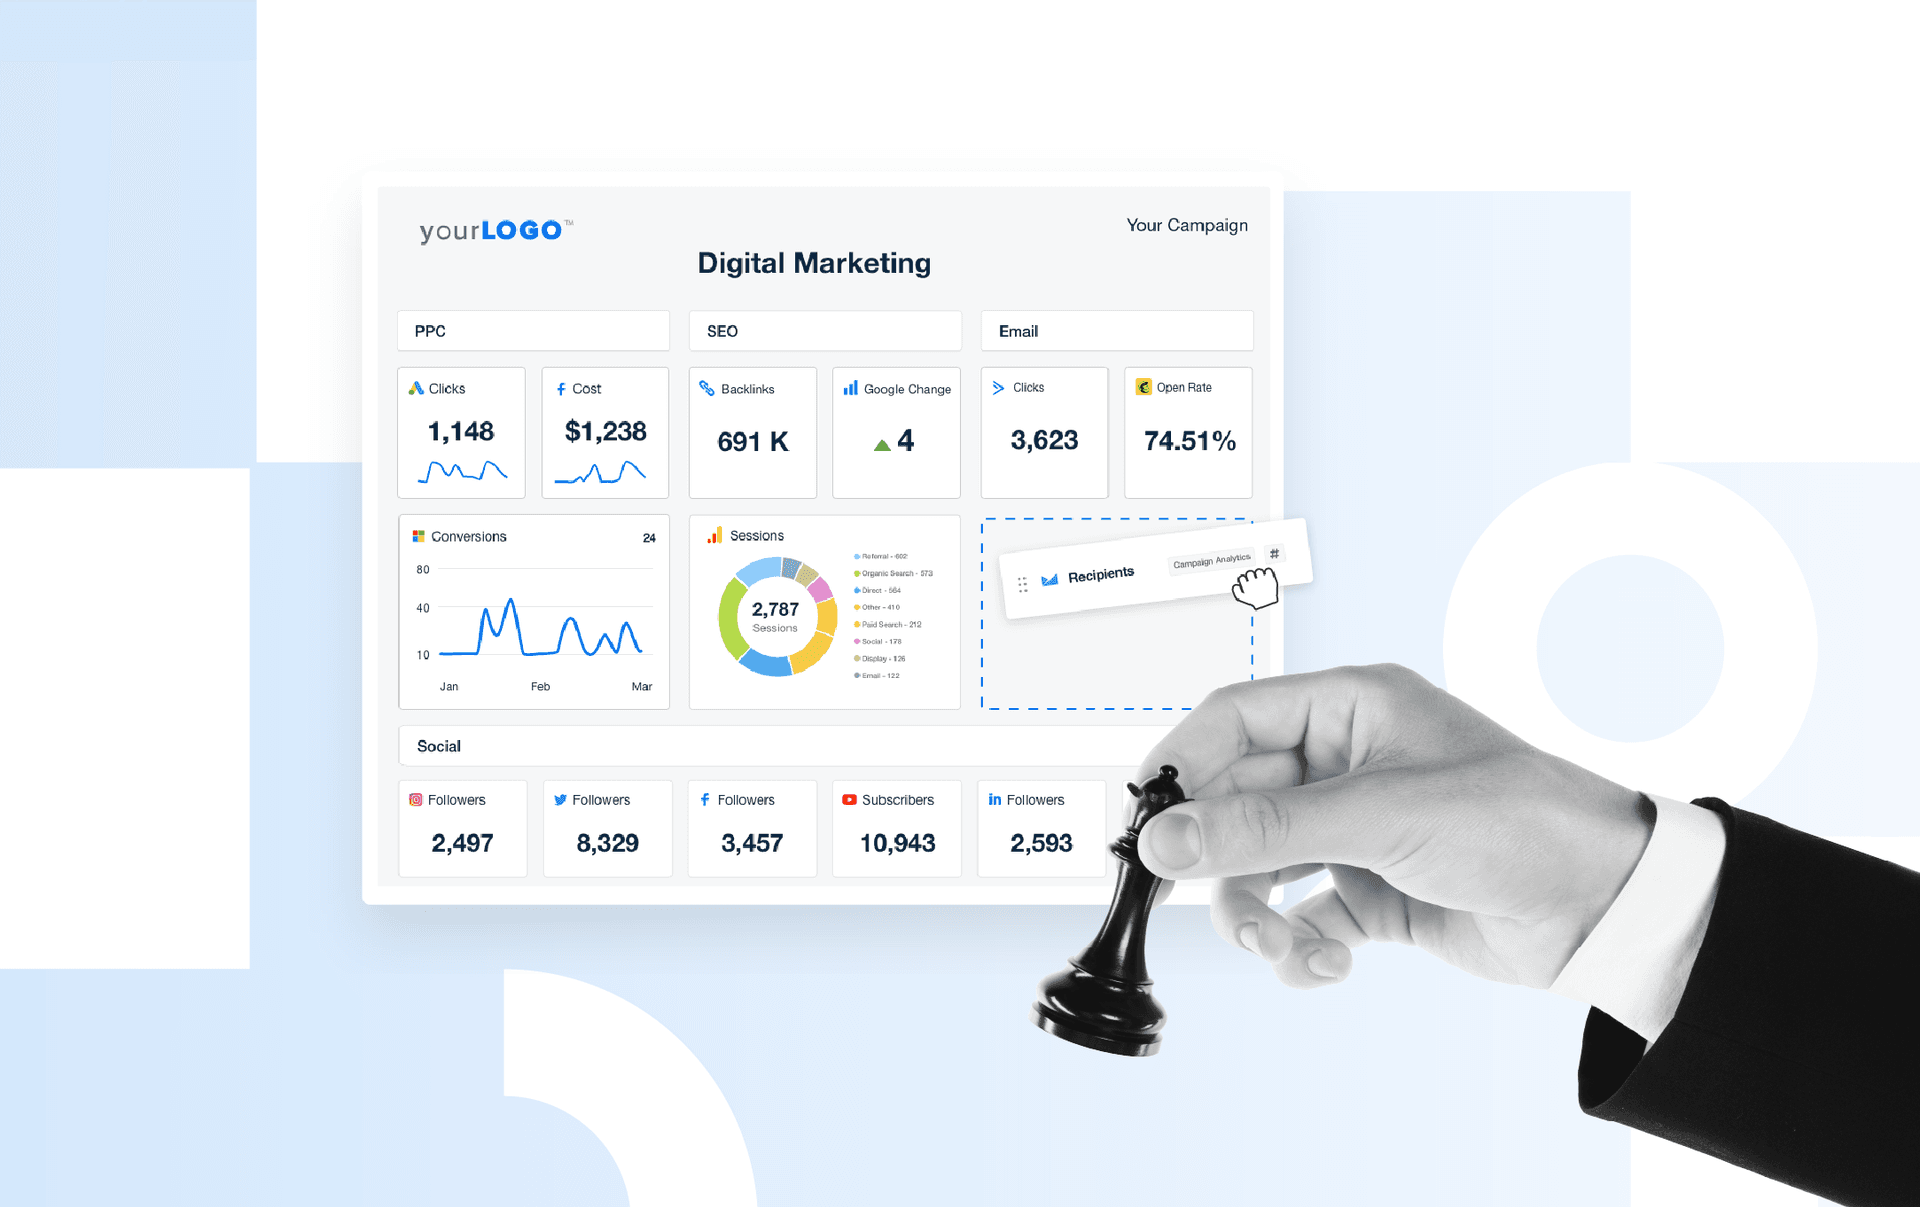
Setting up reports doesn’t start with a blank screen. AgencyAnalytics offers drag-and-drop dashboards and reports with built-in widgets that already know how to display data from marketing campaigns.
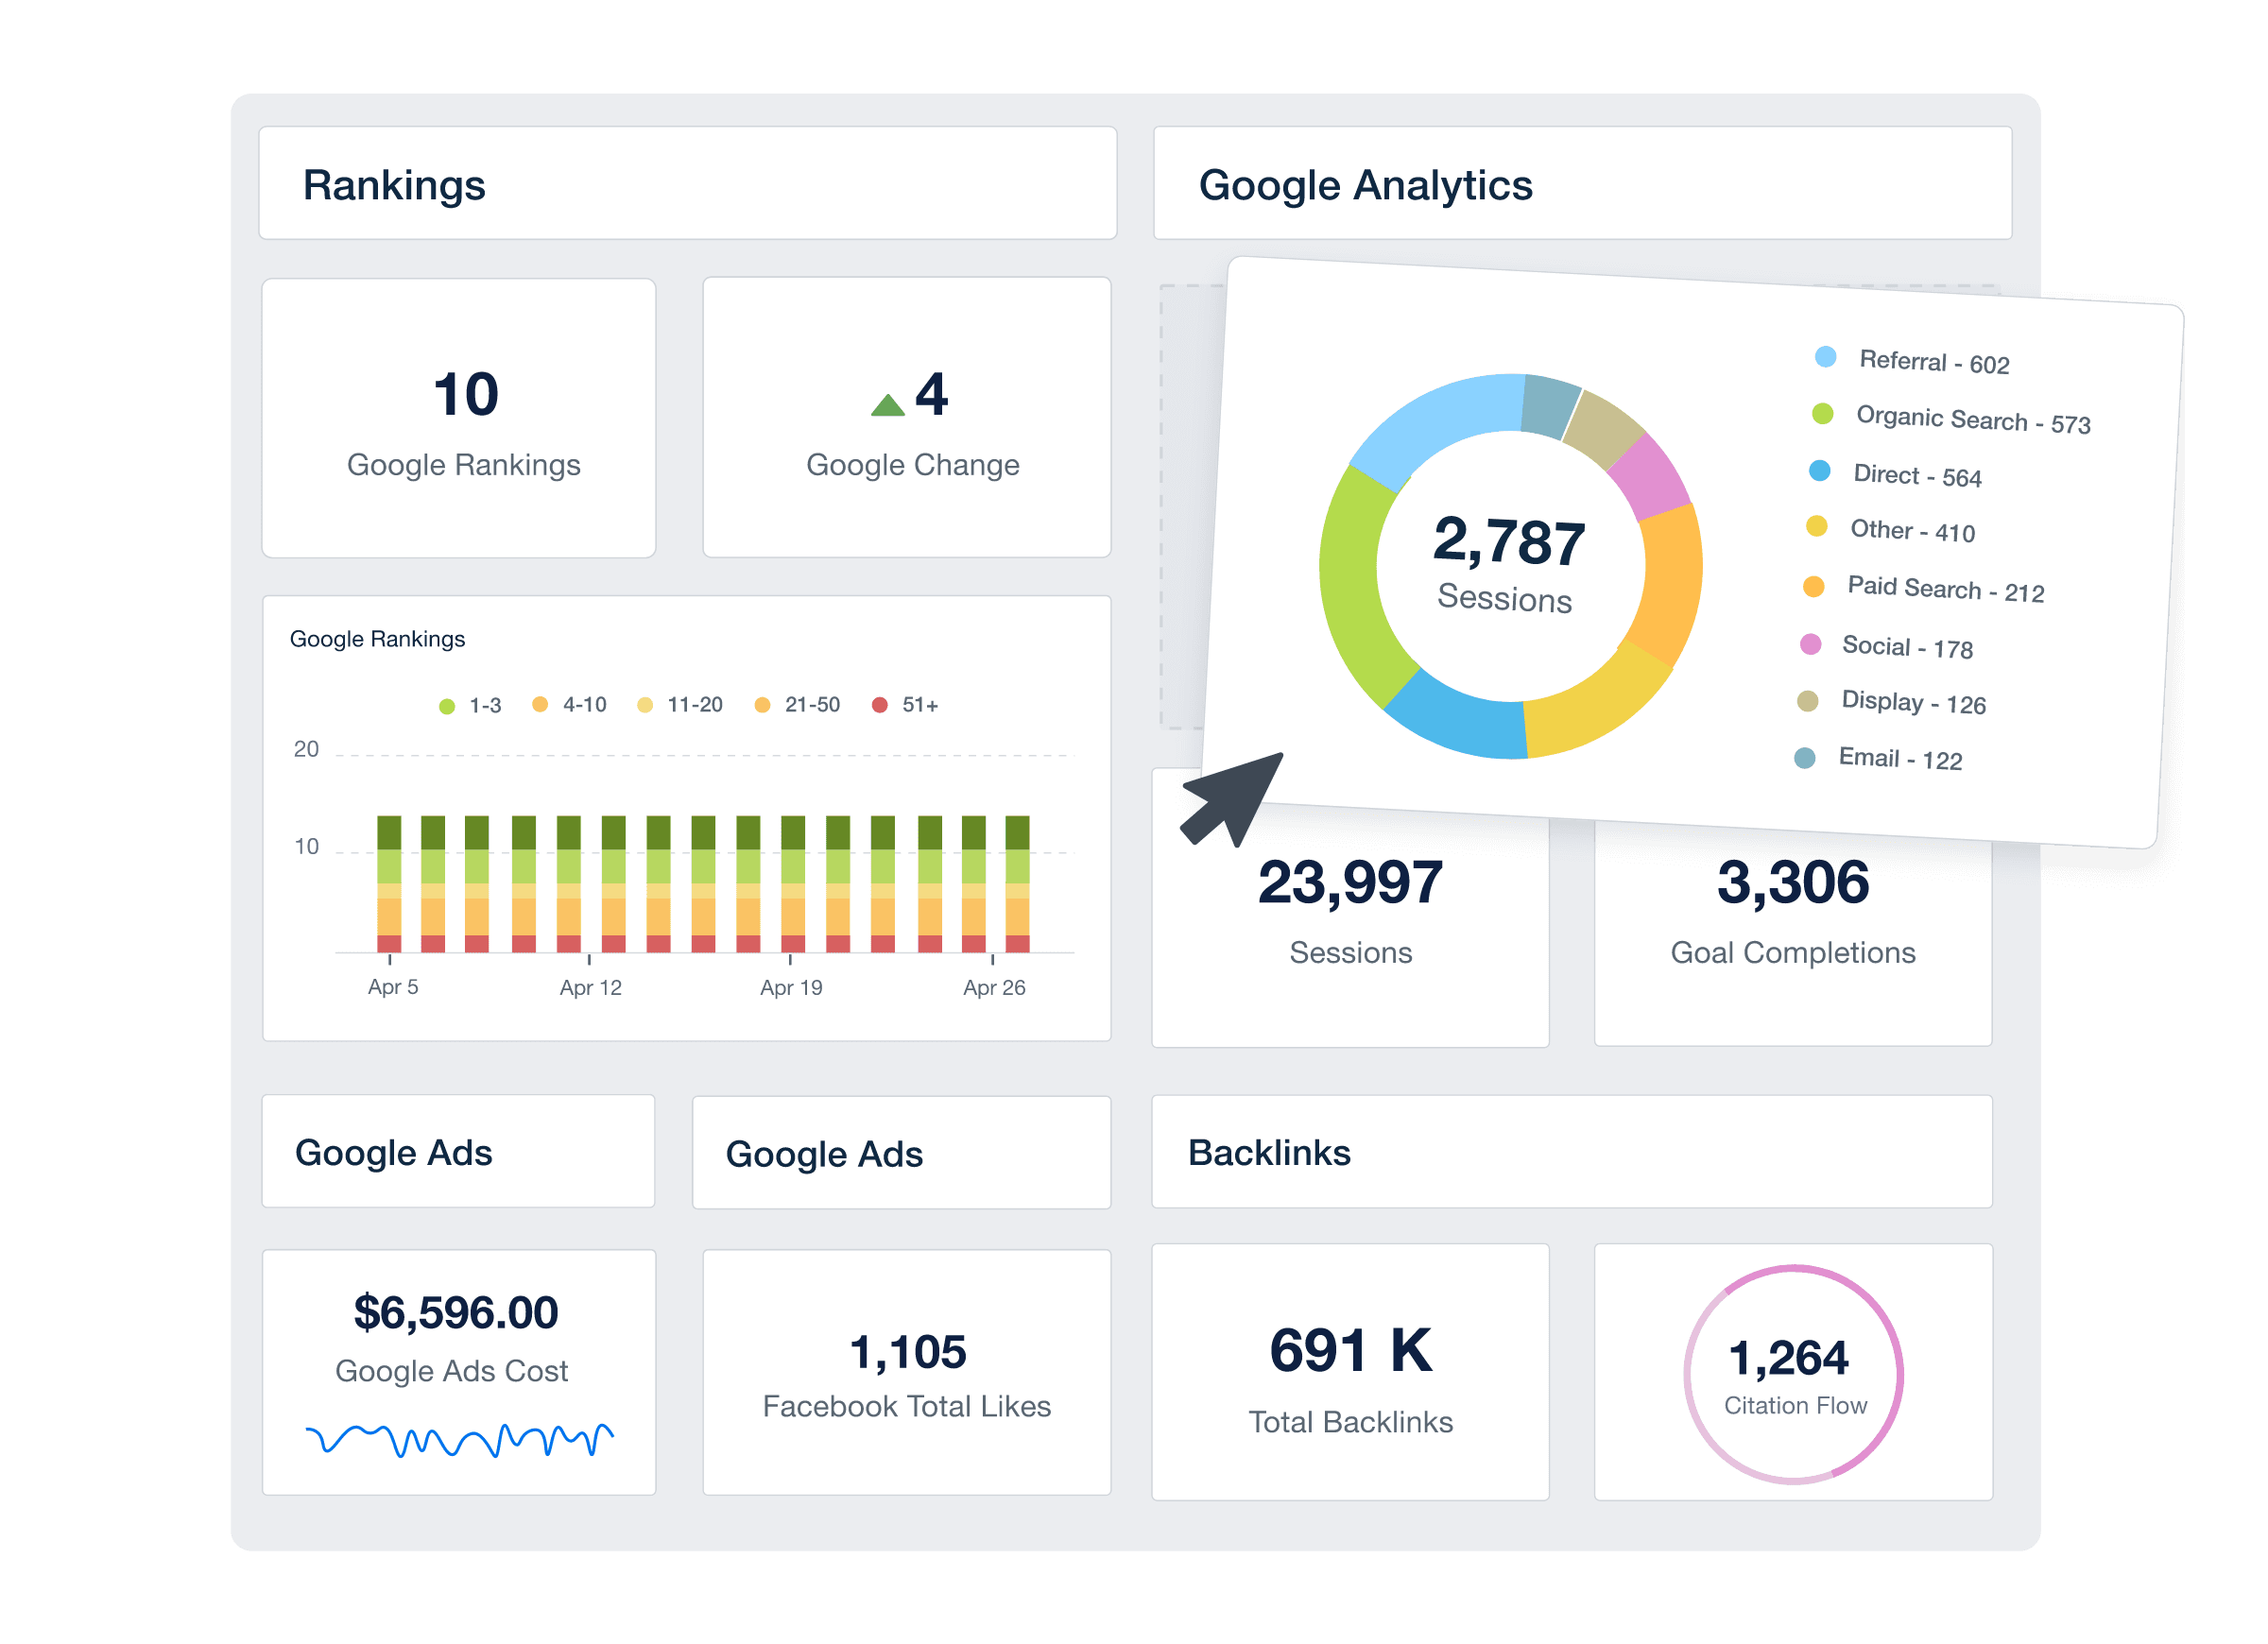
Whether tracking SEO rankings, Google Ads spend, or social media benchmarks, it takes just a few minutes to create a professional, clean visual form highlighting the client's key points—no coding or design work needed.
The data visualization provided by AgencyAnalytics report templates goes above and beyond the reports you can create in Google Sheets, and it's all at the click of a single button.
Graham Lumley, Director of Growth Marketing, Blackhawk
Pre-Built Templates for SEO, PPC, Social, and More
Instead of designing custom marketing dashboards from scratch, start with pre-built templates tailored to everyday marketing needs. SEO report templates focus on rankings, backlinks, and site health. PPC report templates track impressions, clicks, and conversions. Social media report templates highlight engagement rates and reach.
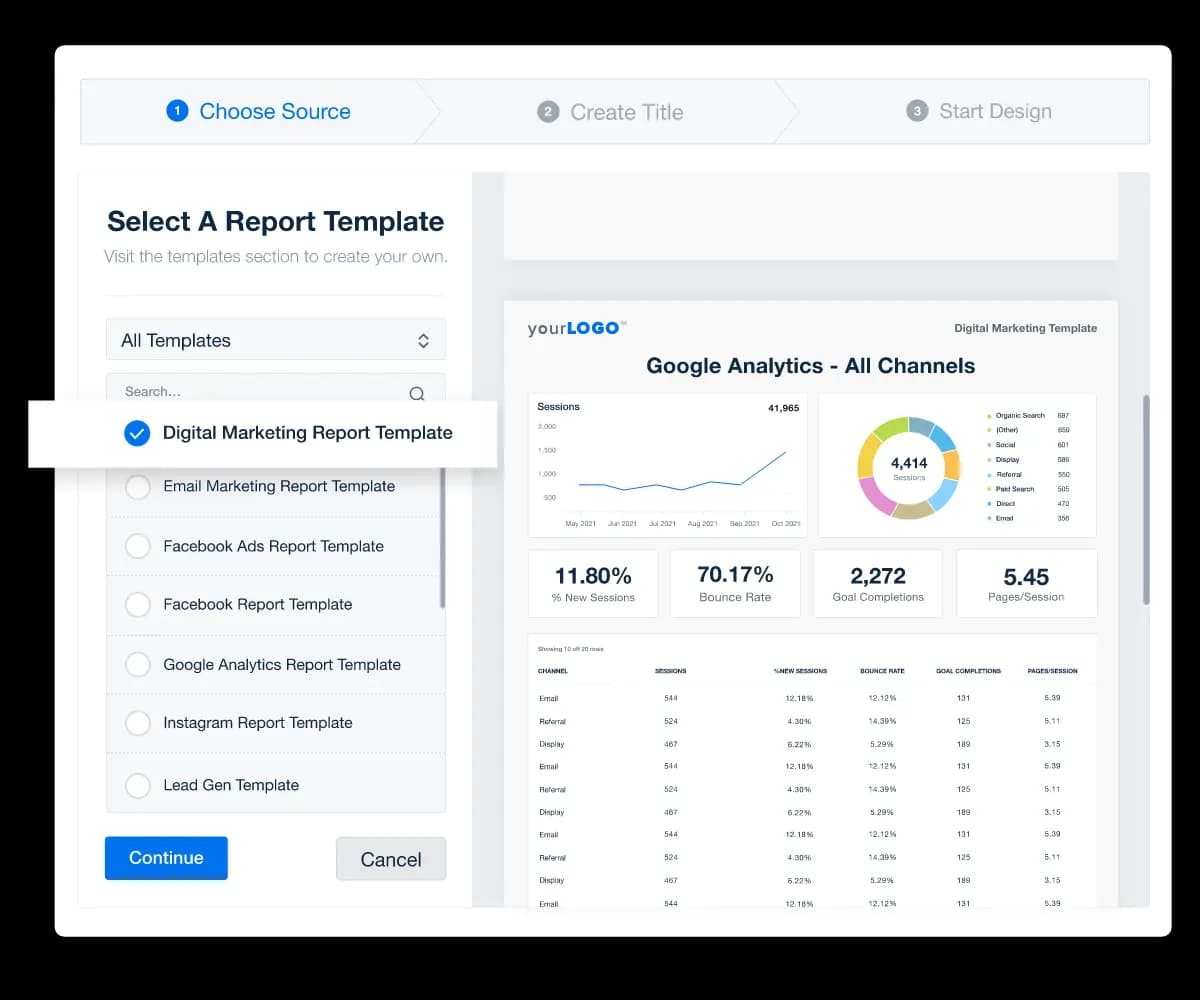
Each one is designed to display data in a way that drives business insights without extra effort.
Easy Integration With Client Campaigns—No Manual Data Entry Needed
Data visualization techniques only work when the numbers are fresh and accurate. AgencyAnalytics connects directly to over 80 marketing platforms, including Google Analytics, Facebook, LinkedIn, and many more.
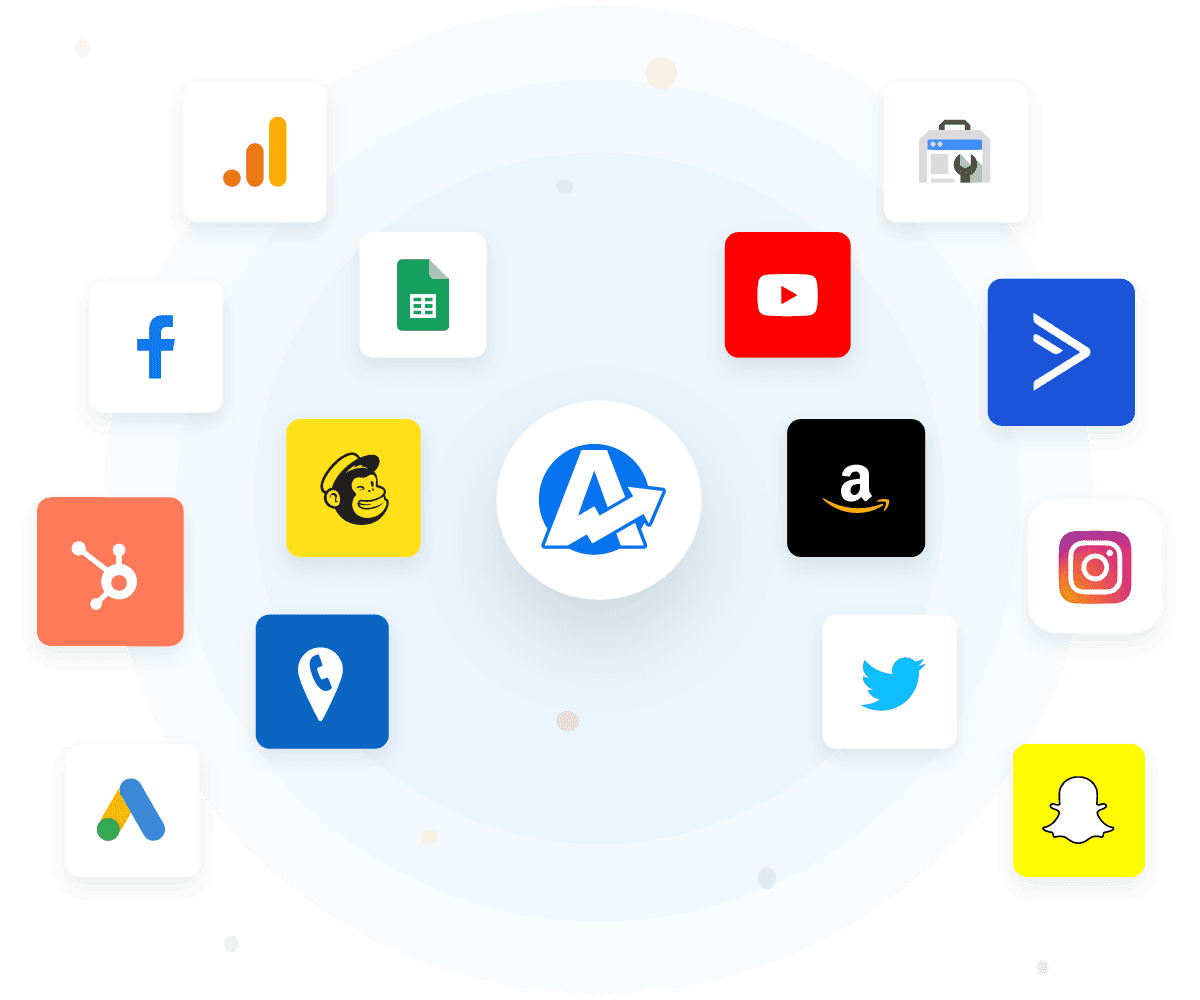
No need to manually pull numbers or manage spreadsheets. With AgencyAnalytics data visualization software, campaign data automatically flows into interactive data visualization dashboards, keeping reports current without lifting a finger. Try AgencyAnalytics free for 14 days!
Customizable, Client-Facing Reports That Clearly Highlight Results
Every client is different. AgencyAnalytics makes it easy to create customizable visualizations that match what each client cares about most.
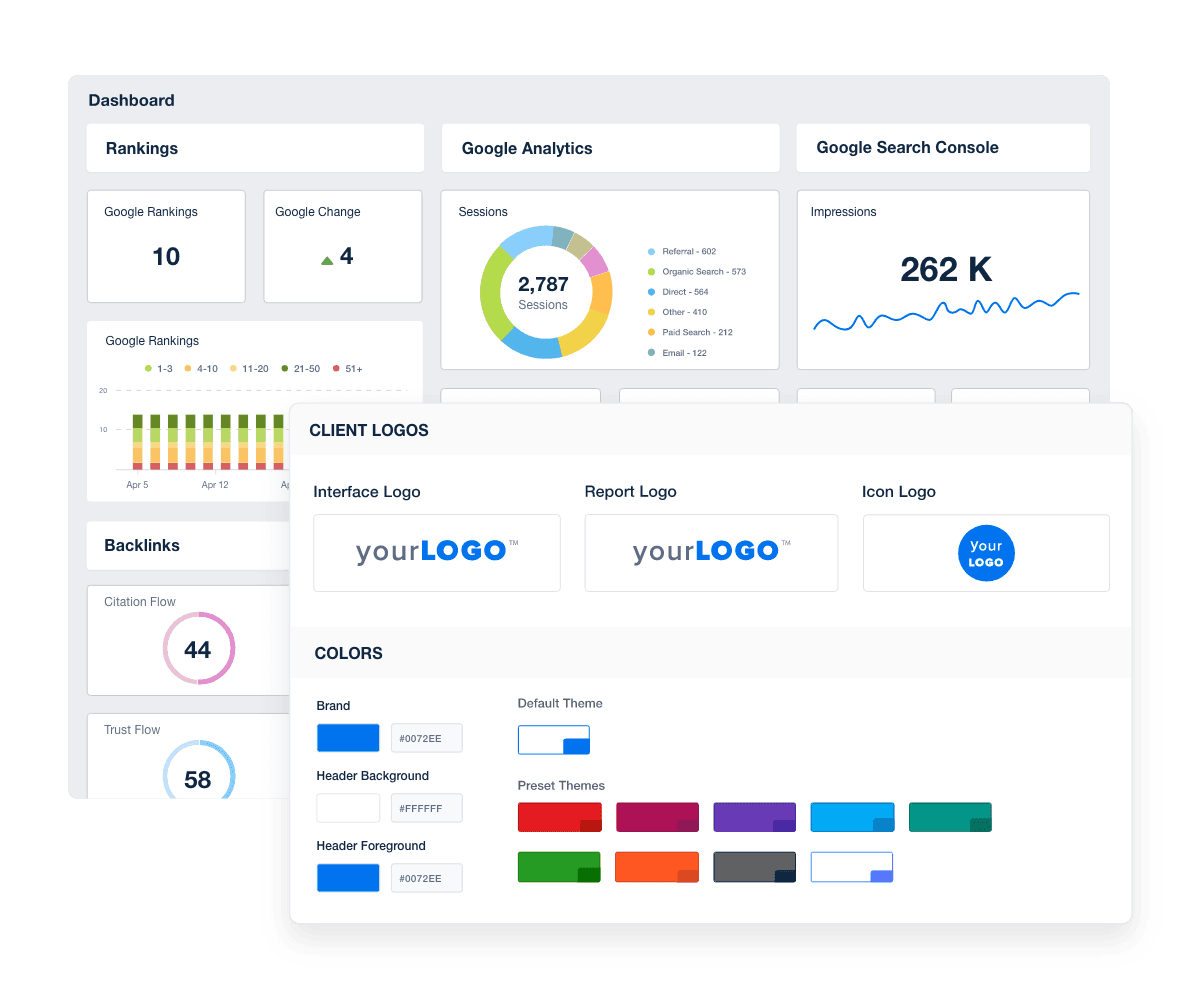
Plus, reports can be fully white labeled, organized by campaign type, and tailored to highlight key insights that matter most to the client's goals. Instead of getting stuck in endless rounds of edits, reports are ready to go, showing the full picture with a clean graphical representation that clients want to read.

AgencyAnalytics is a Godsend for digital marketing agencies. It allows us to show the impact of our work in a way clients understand, frees our time to do more for our clients, and makes us look polished and professional.


Written by
Paul Stainton is a digital marketing leader with extensive experience creating brand value through digital transformation, eCommerce strategies, brand strategy, and go-to-market execution.
Read more posts by Paul StaintonSee how 7,000+ marketing agencies help clients win
Free 14-day trial. No credit card required.


