Table of Contents
Table of Contents
- What Is a Marketing Dashboard?
- 4 Advantages of Live Marketing Dashboards
- What Is a Marketing Report?
- 3 Benefits of Static Marketing Reports
- Key Differences Between Reports and Dashboards
- Dashboards vs. Reports: Which One Should Your Agency Use?
- Optimize Client Reporting: Harness the Synergy of Dashboards and Reports
- Use Dashboards and Reports To Paint the Full Marketing Picture
7,000+ agencies have ditched manual reports. You can too.
Free 14-Day TrialQUICK SUMMARY:
Dashboard vs. Report: the great debate. Dashboards provide real-time, interactive data visualization, while reports offer detailed, static snapshots of data over specific periods. This article explores their key differences, helping marketing agencies decide the best option for presenting client metrics. Understanding the strengths of each promotes improved data analysis and client communication.
Picture this: it's 11 AM, and you're savoring a hot cup of coffee, reveling in the success of a well-executed marketing campaign, when a client asks your team for an impromptu metrics update.
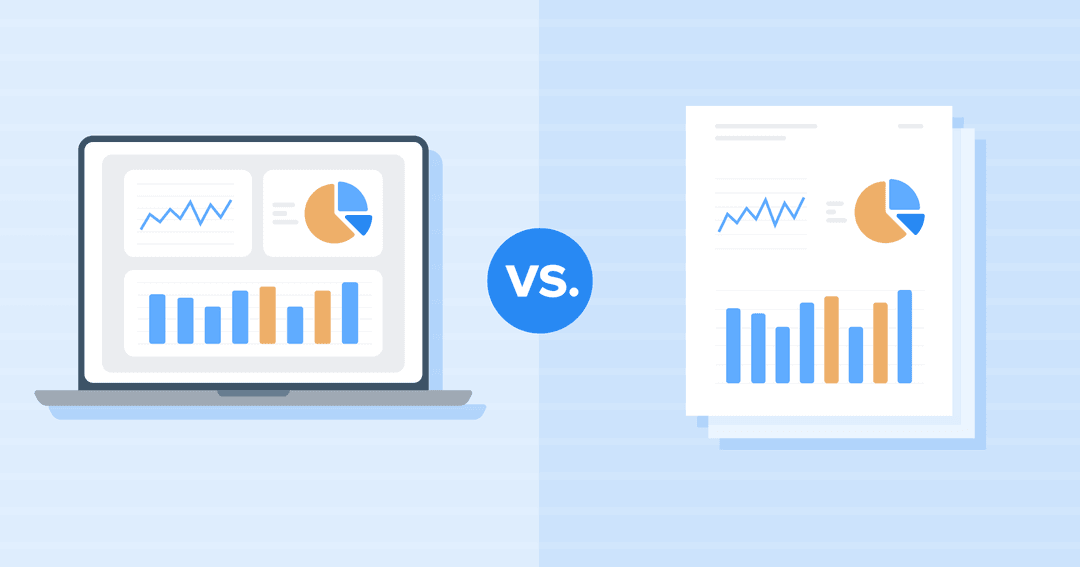
Since this is the third time this type of request has interrupted your attempts at infusing much-needed caffeine into your system, you start to wonder if your monthly client reporting process is actually meeting their needs. Should you have gone for a dashboard vs. report? While dashboards and reports deliver valuable detailed information to clients, they differ in their approach, format, and functionalities.
On the one hand, dashboards offer real-time insights that clients can interact with, providing up-to-the-minute data and intuitive data visualization. On the other hand, reports offer comprehensive insights in a structured and unchanging format at repeated intervals (most commonly monthly).
Can’t quite make up your mind between the use cases of reports vs. dashboards? In this article, we'll navigate the complexities of both options, examining their distinctive features and providing the necessary facts to make an informed decision.
What Is a Marketing Dashboard?
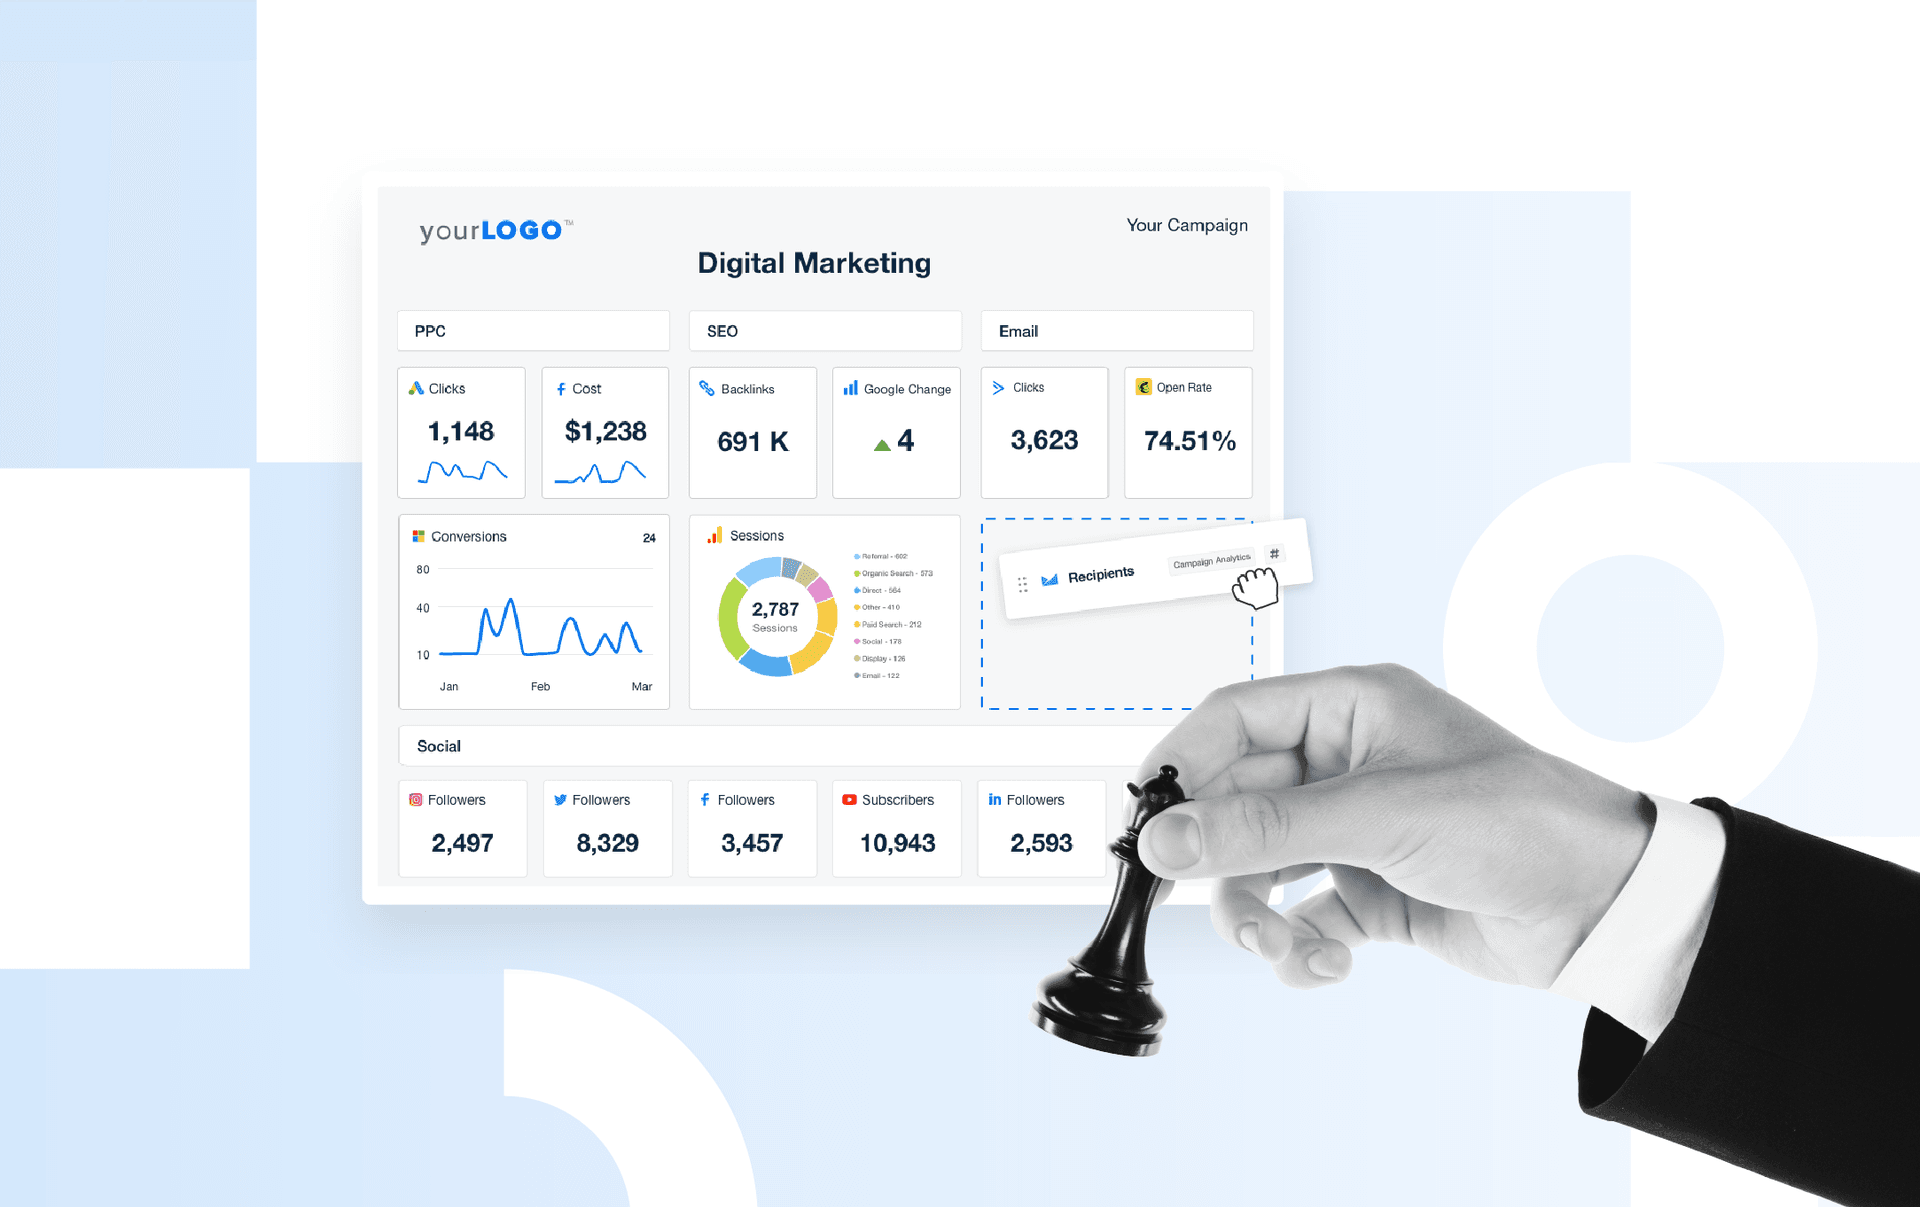
A marketing or BI dashboard is a dynamic and visual representation of your clients' performance.
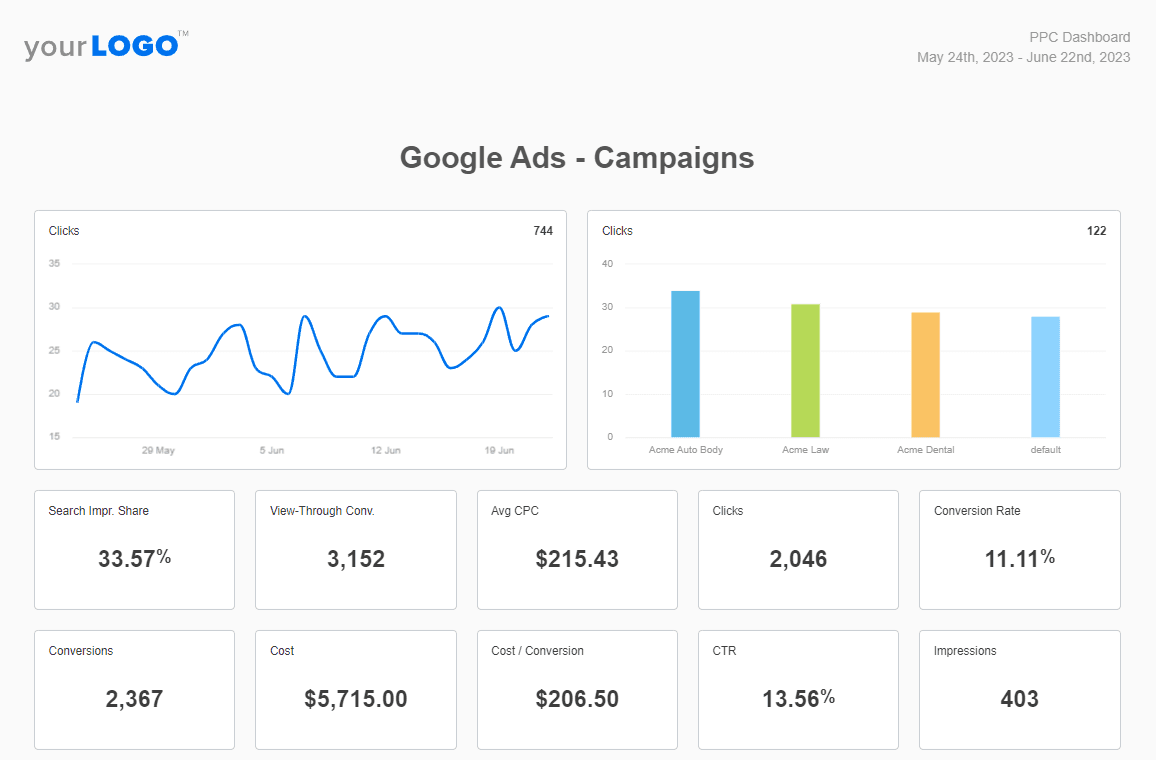
Business intelligence dashboards provide a live snapshot of key metrics, enabling timely decision-making based on up-to-date and detailed information. Plus, the data visualization enables understanding at a quick first glance. For example, here’s what a PPC dashboard looks like.
4 Advantages of Live Marketing Dashboards
There are more than a few reasons why a BI dashboard reporting tool is a must for agencies like you–let’s explore this further.
1. Interactive Data Visualization
With so many deliverables and clients to manage, you’ll need to know what’s happening at a moment’s glance. And no busy agency (or client) wants to sift through an ocean of numbers on the backend of marketing platforms just to get an answer.
That’s where data visualization comes in–the various graphs and charts within business intelligence dashboards are designed to give you visual cues of your clients’ data insights, so you’ll immediately know what’s happening.
Use your AgencyAnalytics marketing dashboards to their full potential by:
Changing date ranges to see historical trends
Toggling over graphical elements to see numerical data points
Exploring different data visualization formats (e.g., switching from a line graph to a pie chart)
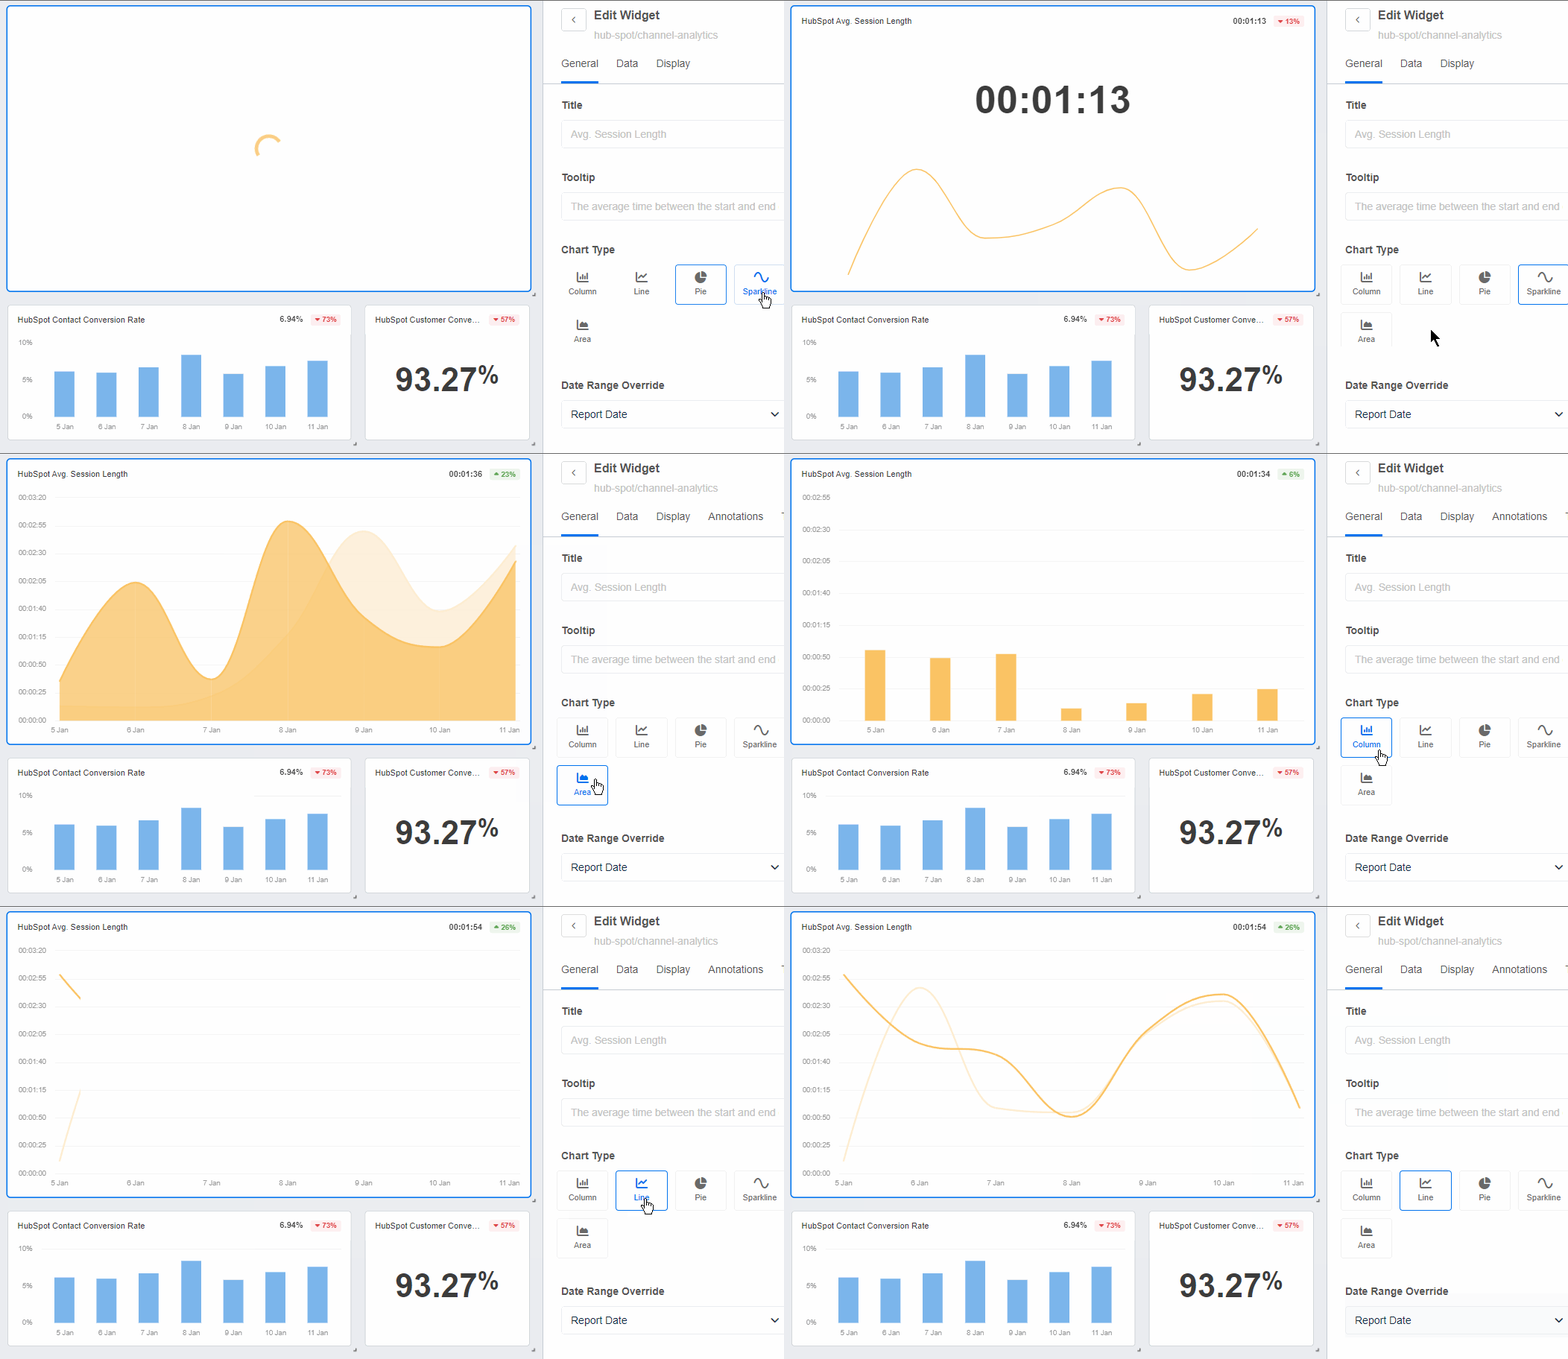
Access a range of eye-catching data visualizations that bring marketing data to life. Customize your clients’ dashboards and share easy-to-understand insights on AgencyAnalytics–try it free for 14 days.
2. Real-Time Data Insights
Dashboard reporting tools thrive on real-time data, which is another major plus. Dashboards provide you and your clients with an easy way to keep a constant finger on the pulse of key performance indicators. The most important data sets regarding ongoing campaigns are provided in a single view, with real-time updates enabling quick reactions to emerging trends or issues.
Let’s take an example–suppose your client is running time-sensitive PPC campaigns to get website signups for an upcoming seminar.
In these cases, it’s easy to build a PPC dashboard that includes Google Ads metrics and insights across their other PPC platforms. That way, your client will know if things are progressing as planned or if further adjustments are needed (e.g., increasing ad spend).
We utilize our dashboards for much more than reporting–we use them to keep our eyes on campaigns and their key performance indicators around the clock. We also think our clients should be able to access their insights as well. You can't hide behind dynamic data, so in a way, it pushes us to be the best we can be.
Ashlee Brown, Campaign Performance Manager at i76 Solutions
3. On-Demand Customization Capabilities
Your clients’ marketing needs aren’t one-size-fits-all. So why should their reporting dashboards be? With just a few clicks, easily create custom dashboards that best represent their marketing efforts and specific needs.
Whether clients need detailed data on each individual campaign or a top-level summary of spend and ROAS, customize the BI dashboard design and select the appropriate data visualization option to highlight exactly the data set each client needs to see.
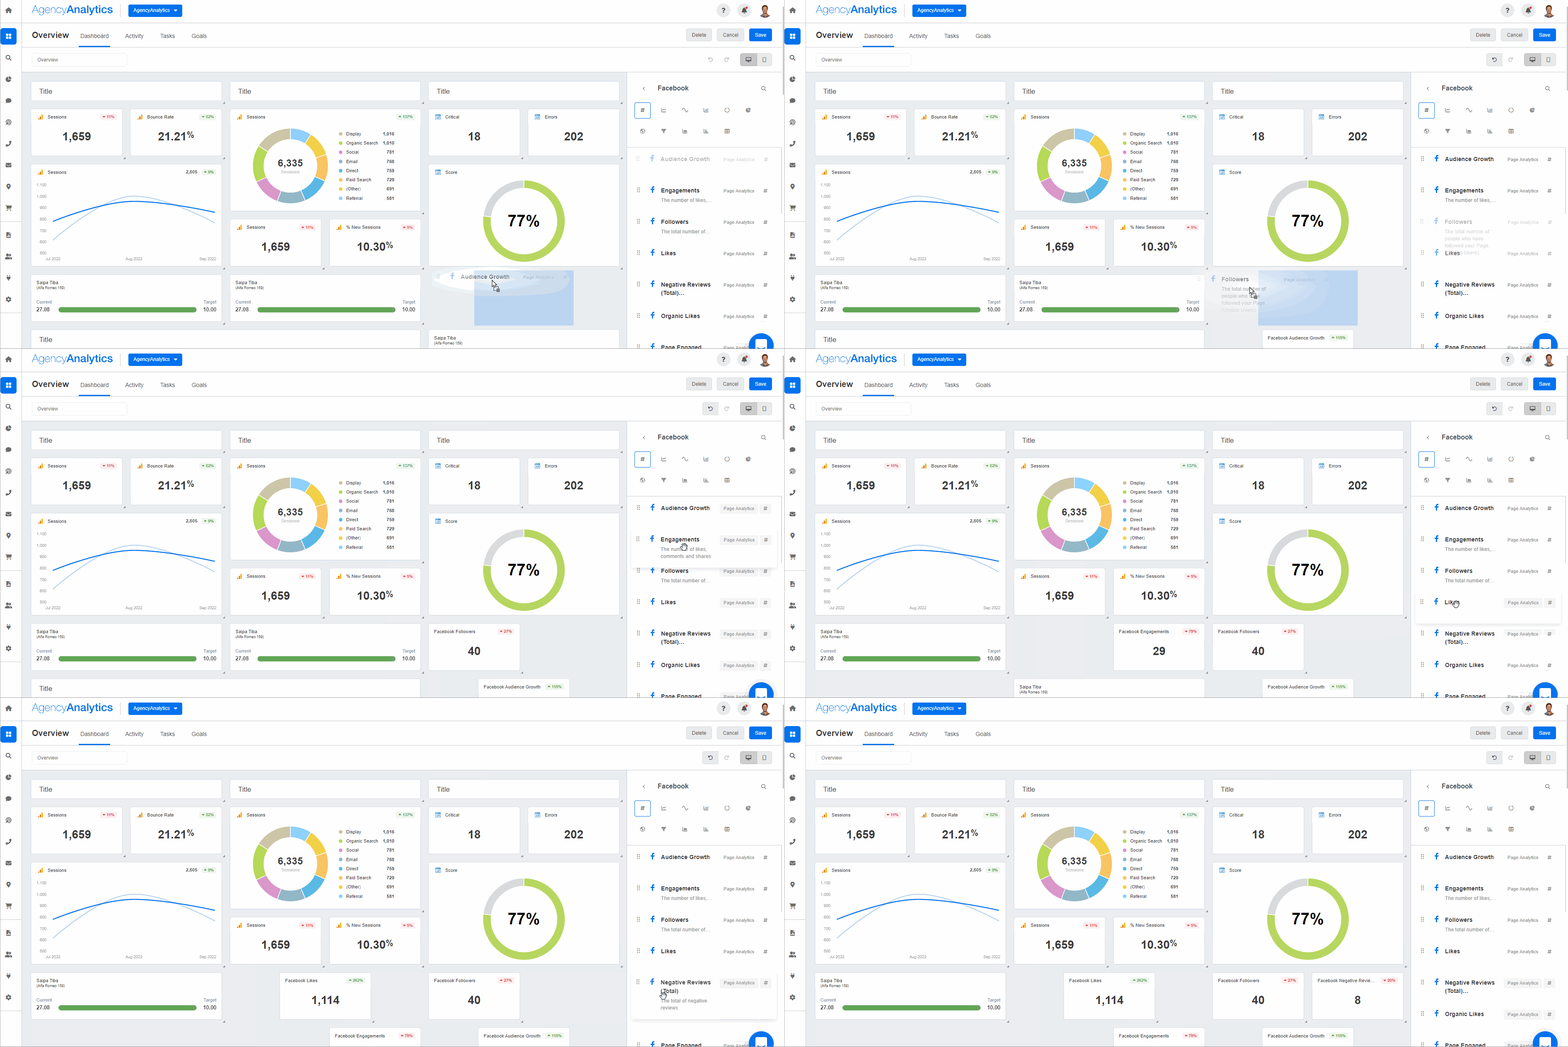
Create custom BI dashboards as unique as your clients’ goals. Share tailored insights and report on what matters most–try AgencyAnalytics free for 14 days.
Client dashboards and custom metrics are extremely valuable. We save a lot of time each month by sharing a dashboard where our clients can regularly check in and see status updates from our team. The ability to add custom metrics also makes things easier for us to aggregate key performance indicators across different channels.
Bryan Lozano, Vice President of Operations at Ad-Apt
It’s as simple as:
Creating custom metrics that reflect their business goals. This is especially handy for enterprise-level clients that need tailored or consolidated data insights
Using dynamic, visualized goal progress to see how your clients’ marketing campaigns are coming along
Inputting custom date ranges to see historical trends and previous marketing performance
Embedding content to provide more context (e.g., adding published posts to a social media dashboard for reference, video explanations of results)
Dragging and dropping widgets so your clients see the most important data insights at first glance
Adding white labeling that includes your clients’ brand collateral for an extra touch of professionalism
My clients are not overly technical, and I've decided that providing access to their dashboard would not be an effective way to show them how their SEO is progressing. Instead, I send them their customized Dashboard along with a Loom video discussing the highlights.
Kelly Fitzgerald, Founder at Savvy Marketing Services
4. Client Login Access for Increased Data Transparency
There’s no agency-client relationship without trust. And what better way to create data transparency than granting login access to live reporting dashboards?
It’s a mutually beneficial scenario. Your clients will get access to the detailed data insights they need to see. On the other hand, it saves your agency time from answering follow-ups and increases the chances of client retention.
Larger clients are usually more knowledgeable and love having access 24/7 to review data. With AgencyAnalytics, our clients get to do just that by accessing their reporting dashboard at any time.
Brad Fogel, CEO of Operation Technology
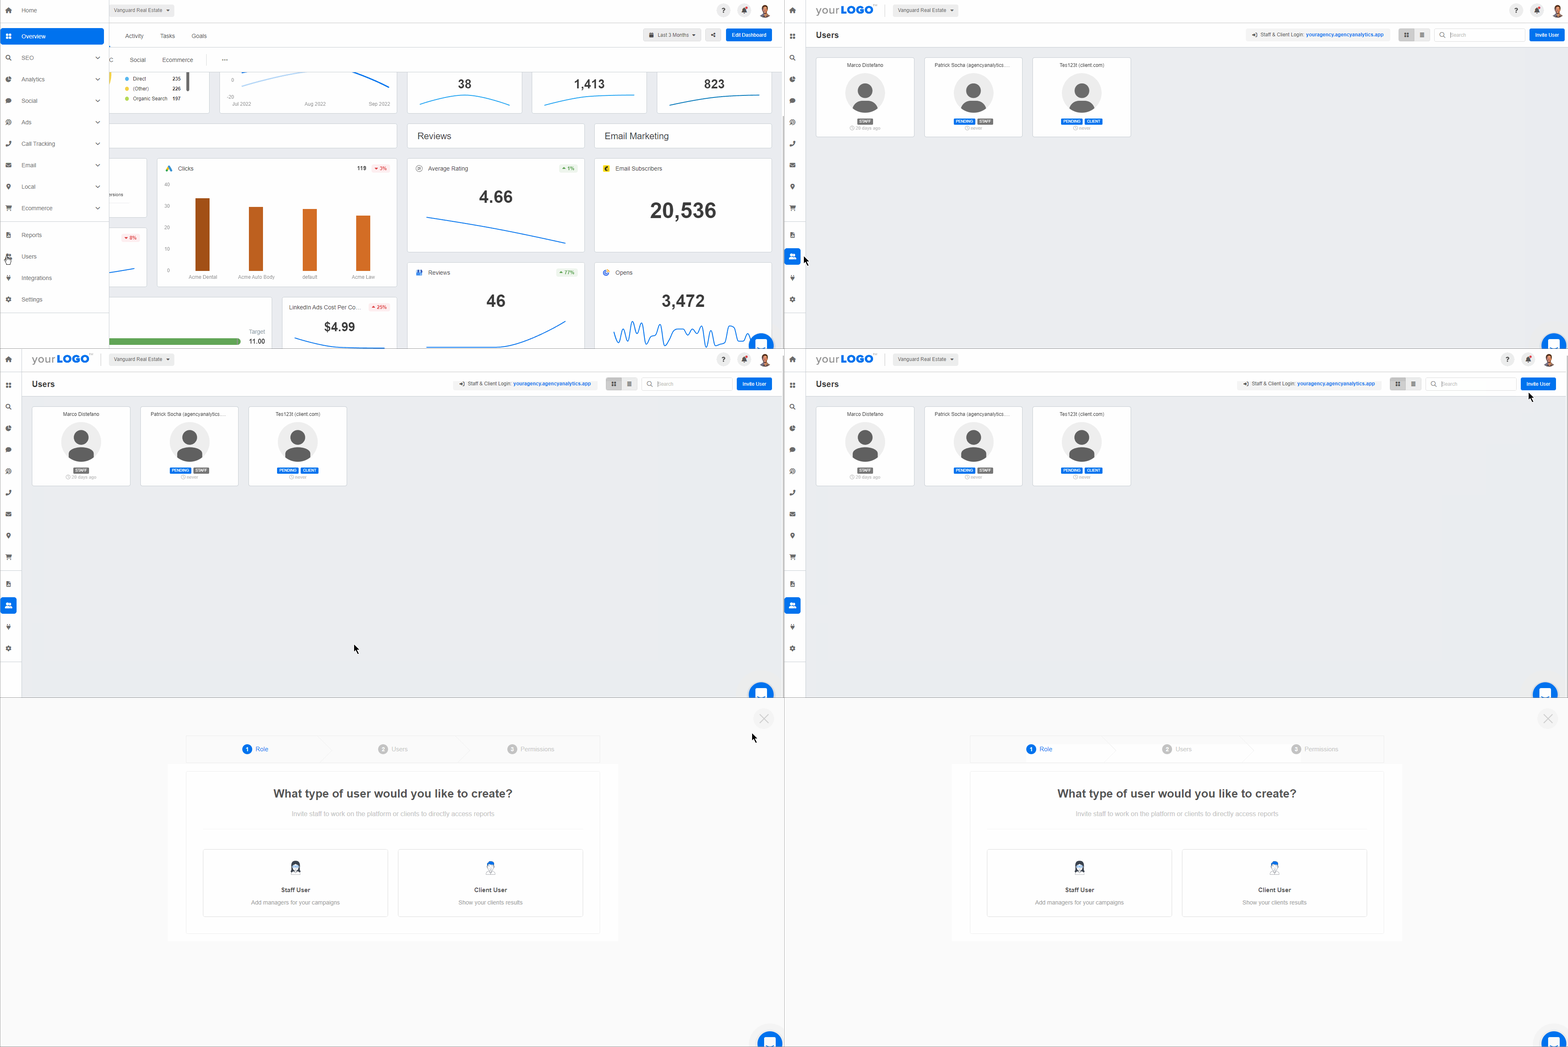
Keep transparency on the table by granting access to live client dashboards on AgencyAnalytics–start your free 14-day trial today.
Use AgencyAnalytics to:
Create an unlimited number of custom user profiles
Set user permissions to ensure your clients don’t get lost in a flurry of data
We want to be totally transparent with our clients. AgencyAnalytics allows us to provide our clients with a live dashboard where they can have complete insight into what we're doing without needing full access to the ad platforms where they could potentially interfere with performance.
Michael Wisby, CEO of Two Trees PPC
But even if you’ve opted to grant client login access, remember to keep the line of communication open in case your clients need further context.
Agency Tip: Looking for recurring revenue streams? Use client login access as an add-on service. This approach diversifies your product offering and extends your agency’s value proposition.
While dashboard reporting software is certainly useful, there are also downsides, such as:
Data overload, especially if your clients have limited marketing expertise. Yes, detailed data is powerful, but sometimes less is more (at least when it comes to sharing their most relevant insights)
Less control over client access to real-time data. This could lead to more inquiries or concerns since results may not have sufficient time to materialize. As a result, this has the potential to affect the overall narrative around campaign performance reviews
What Is a Marketing Report?
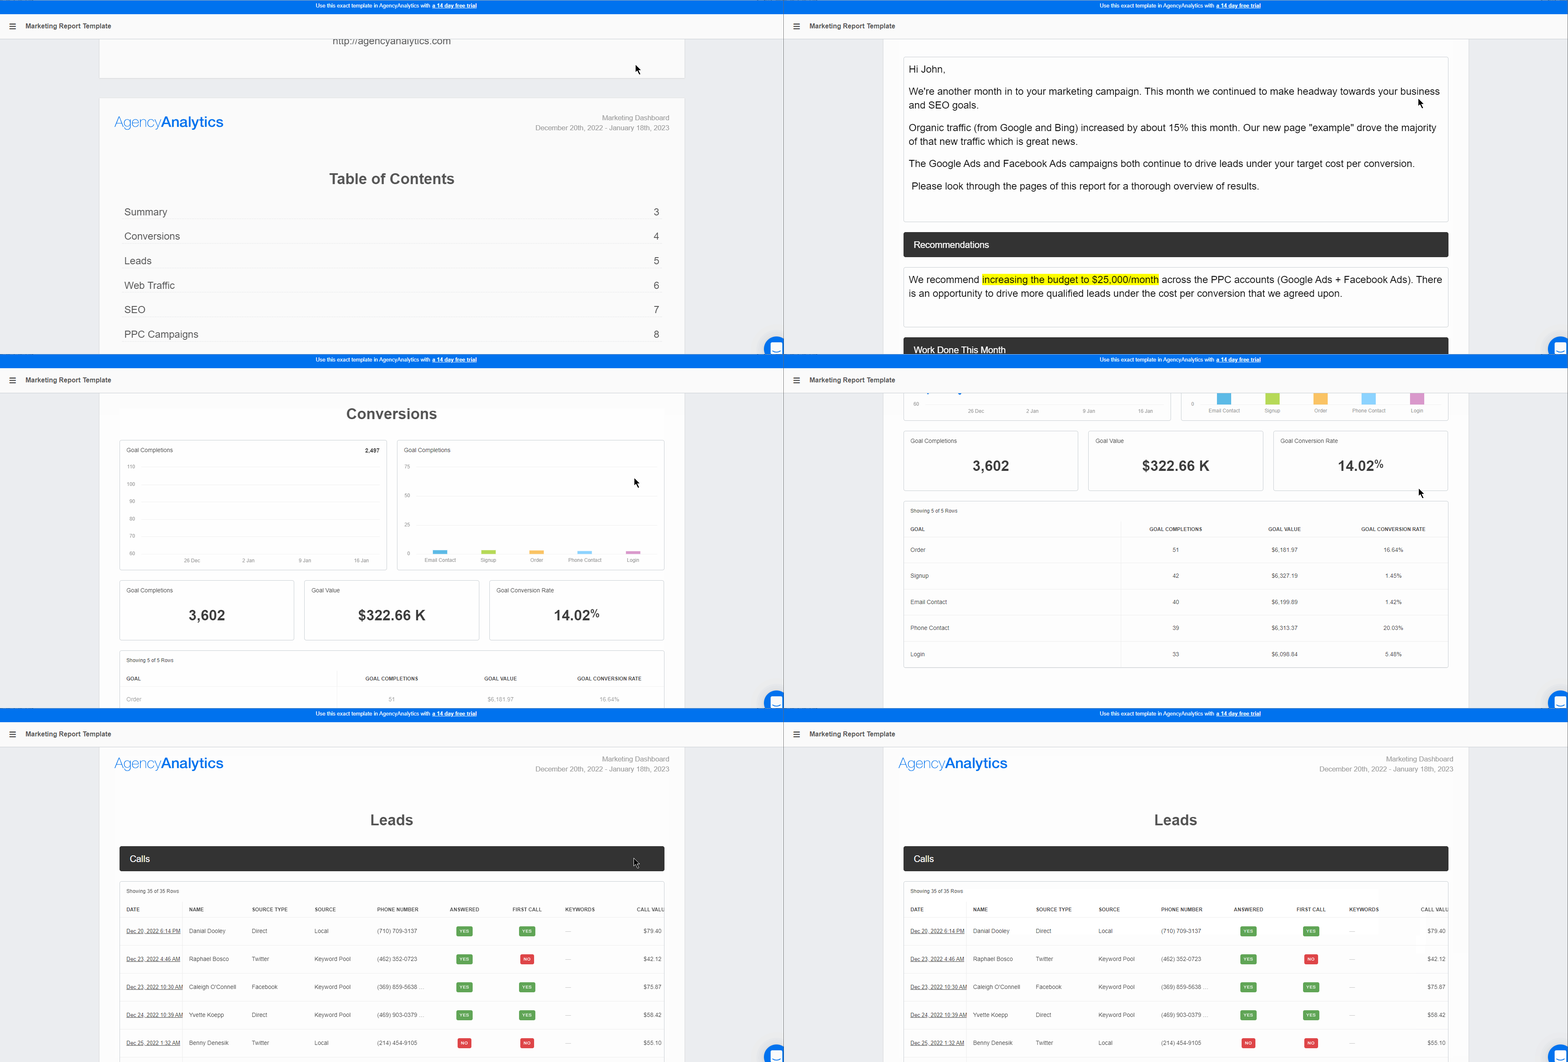
Similarly, when you create a marketing report, you give your clients an overview of their marketing performance. But instead of an interactive interface, marketing reports are:
Static documents (usually in the form of an email or downloadable PDF), typically spanning across multiple pages
Historical overviews of marketing performance for specific periods (e.g., monthly, weekly)
Detailed and granular, honing in on specific data points or campaigns
Wondering what it looks like in action? Take this marketing report template, for example.
3 Benefits of Static Marketing Reports
How exactly do marketing reports benefit your clients? Let’s explore this further.
1. Detailed Performance Overviews at Regular Intervals
Whether campaign-specific insights or an overview of multi-platform performance, reports provide comprehensive, granular insights.
For example, let’s say your client ran a monthly SEO campaign with the following goals:
Increasing SEO traffic to 8,000 website visits
Improving their search rankings for two specific keywords
Acquiring ten new, relevant backlinks
It’s no secret that SEO efforts take time to yield results. In this case, choosing a reasonable reporting cadence gives your agency enough time to run campaigns and share results that show some traction.
Sending reports monthly not only helps provide clients with an overview of what was achieved and the progress made within a month but also gives campaigns time to set up and normalize. Although it is nice to check in on a campaign weekly, sometimes it is better to get a macro perspective of how the campaign went in order to determine its success.
Ariene Dionela, Digital Media Account Director at Connections Marketing
All you have to do is:
Package their monthly results into a customizable SEO report template
Share any notable updates (e.g., whether goals are on target)
Outline your recommendations moving forward
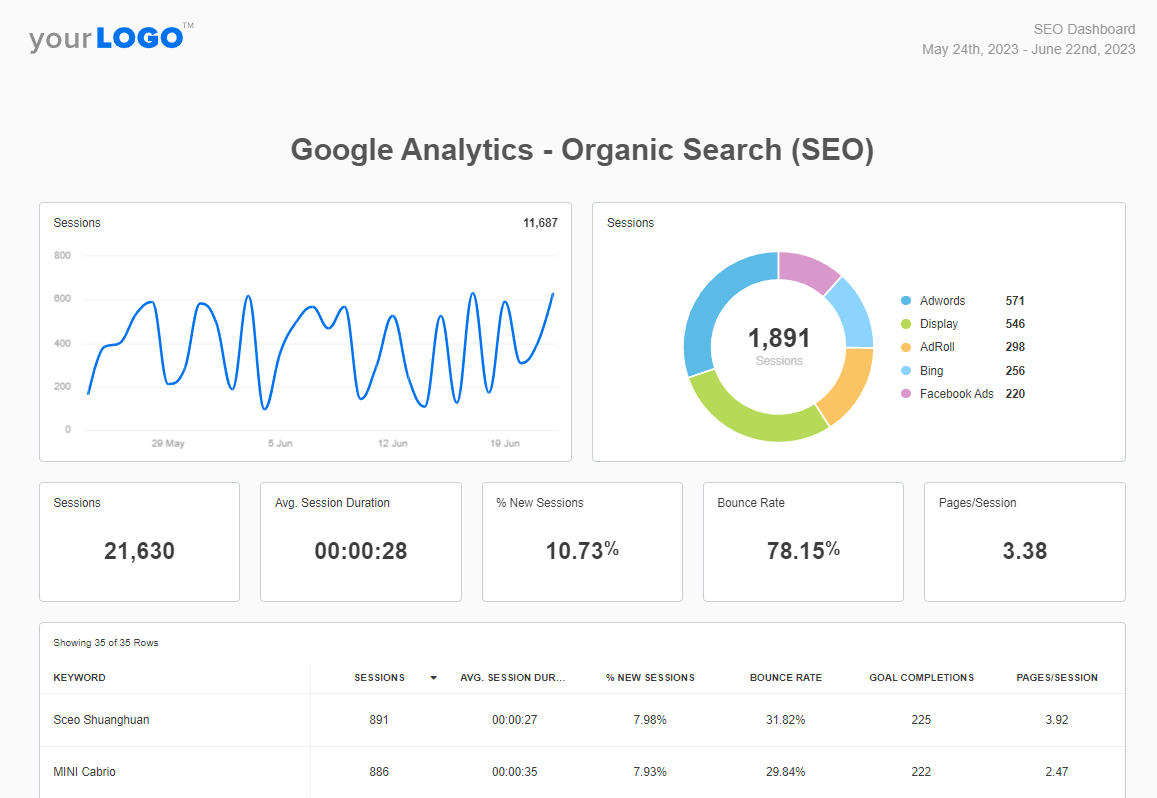
Access pre-built report templates, create a standardized reporting process and save billable time. Increase your agency’s efficiency by investing in AgencyAnalytics, free for 14 days.
2. Fixed Snapshots of Marketing Performance
Because of their static nature, reports are fixed measures of performance for a specific time period. It allows your agency (and clients) to use multiple pages to really dig into the heart of the data set and perform in-depth data analysis.
As a result, clients are:
Adequately informed about the strengths and weaknesses of different campaigns and channels
Better equipped to make strategic decisions (e.g., long-term planning)
Able to see the ROI of their marketing efforts and make adjustments if necessary
Sending client reports is an essential part of any digital marketing campaign. It allows clients to track progress and ensure that their investment is paying off. Without reporting, it would be difficult to know whether a campaign is successful. By providing regular reports, businesses can see that their agencies are working hard to deliver results.
Guy Hudson, Founder of Bespoke Marketing Plans
3. Concise Summaries for High-Level Insights
Your clients may not have the time or capacity to do a detailed analysis of their marketing campaigns and instead simply want access to the results. That's where summary pages come into play.
Reports are especially useful here since they get straight to the point with an introductory report summary rather than having to read through multiple pages of data. When you create summary pages, high-level executive clients (or management teams) won’t have to spend time sifting through mounds of data to get the point.
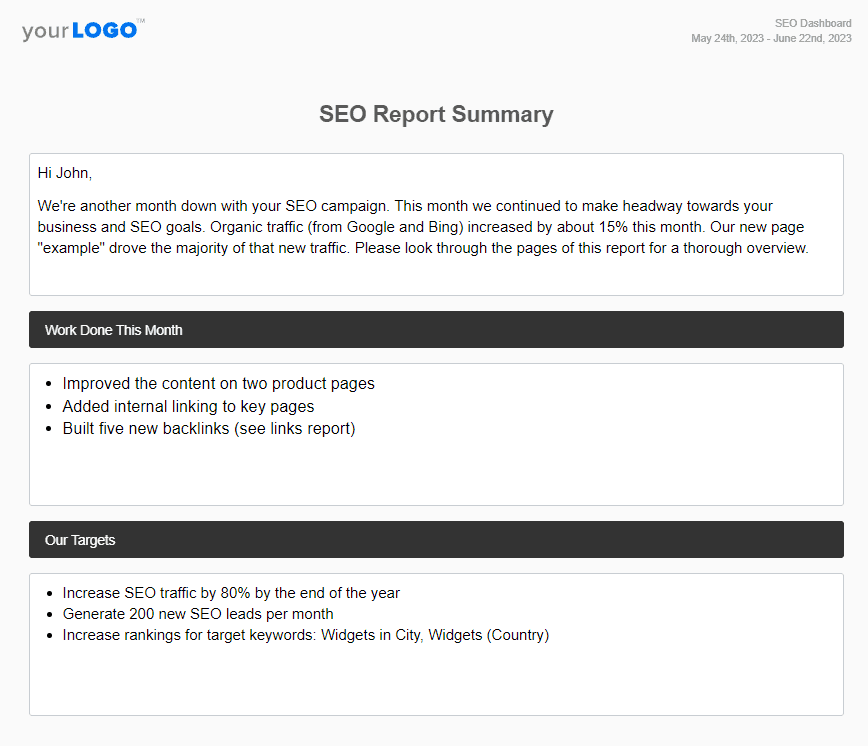
Add a touch of personalization to your client reports by including a high-level performance summary. Go the extra mile with customized, detailed analysis–access it on AgencyAnalytics, free for 14 days.
It also gives your agency the opportunity to infuse data storytelling, analyzedata, and contextualize performance. This leads to greater clarity and also enhances the overall client experience.
And with a range of easy-to-use marketing report templates to choose from, you won’t have to recreate the wheel each time a new client comes along.
For us internally, depending on the scope of the campaign & the deliverables, reporting practices vary. As a performance-driven agency, we work to ensure we're achieving our client's goals, so a quick review and summary go a long way for our clients.
Christopher Marrano, CEO of Blue Water Marketing
4. Gives Your Agency an Opportunity To Review Data Before Sending
Data without context has the potential to be misinterpreted. Luckily, creating marketing reports gives you enough time to understand the data more intricately before packaging it.
We always review the data, making specific recommendations that will be of value to the client. Data can be so in-depth and often needs context to evaluate how effective the campaign is, what needs to be adjusted, and how it impacts the long-term goal.
Valerie Jennings, CEO of Jennings Social Media & MarTech
Like all things, marketing reports also come with their drawbacks, such as:
Lack of real-time data, which is inconvenient if your clients’ marketing results have a great degree of variability in a short time window
No on-the-spot customization, such as changing date ranges to see historical insights (e.g., month-over-month). This makes it more challenging to compare marketing performance over time
Key Differences Between Reports and Dashboards
While both reports and dashboards provide your clients with valuable insights, there are a few key differences–let’s explore them further.
Reports | Dashboards |
|---|---|
Static format–provides insights for a specific time and doesn’t include real-time data updates | Dynamic, highly interactive format. This means on-the-spot customization to highlight important metrics and fresh, continuously updated insights |
Provide in-depth, granular overviews of marketing campaigns or plans | May cover a broader range of marketing efforts; often formatted to view cross-campaign performance side-by-side |
Generated periodically based on your clients’ needs or preferences (e.g., monthly, weekly) | Gives clients on-demand, 24/7 access to their live data, which is better for everyday analytics |
Information is spread across multiple pages to provide the ability to dig into the data set but can be harder to digest on mobile devices. | Information is provided in a single screen, often with multiple tabs for further exploration. |
Given these key differences, it's only natural you may be wondering: "How do I choose between a dashboard vs. report?” Don’t sweat it–here are some insights to help you make the best decision.
Dashboards vs. Reports: Which One Should Your Agency Use?
It's not about picking sides for the dashboards vs. reports debate or even limiting yourself to one option. It all boils down to what works best for your clients’ needs.
Here are a few instances where one works better than the other.
When To Use Dashboards vs. Reports
In these instances, dashboard reporting software gives an extra edge:
Creating dynamic live presentations. Nothing beats dynamic data visualizations, especially for your 1:1 agency-client meetings. Simply click “Present” on your AgencyAnalytics dashboard and use it as a live presenting tool for maximum impact. This also makes it easy to switch over to other dashboards, such as switching from SEO to Social Media, rather than opening up multiple reports.
When using the AgencyAnalytics platform, leverage its ability to deliver impactful data visualizations and presentations that effectively communicate the value of your clients’ marketing efforts.
Joseph LeBlanc, Marketing Specialist at Studio Eighty-Eight
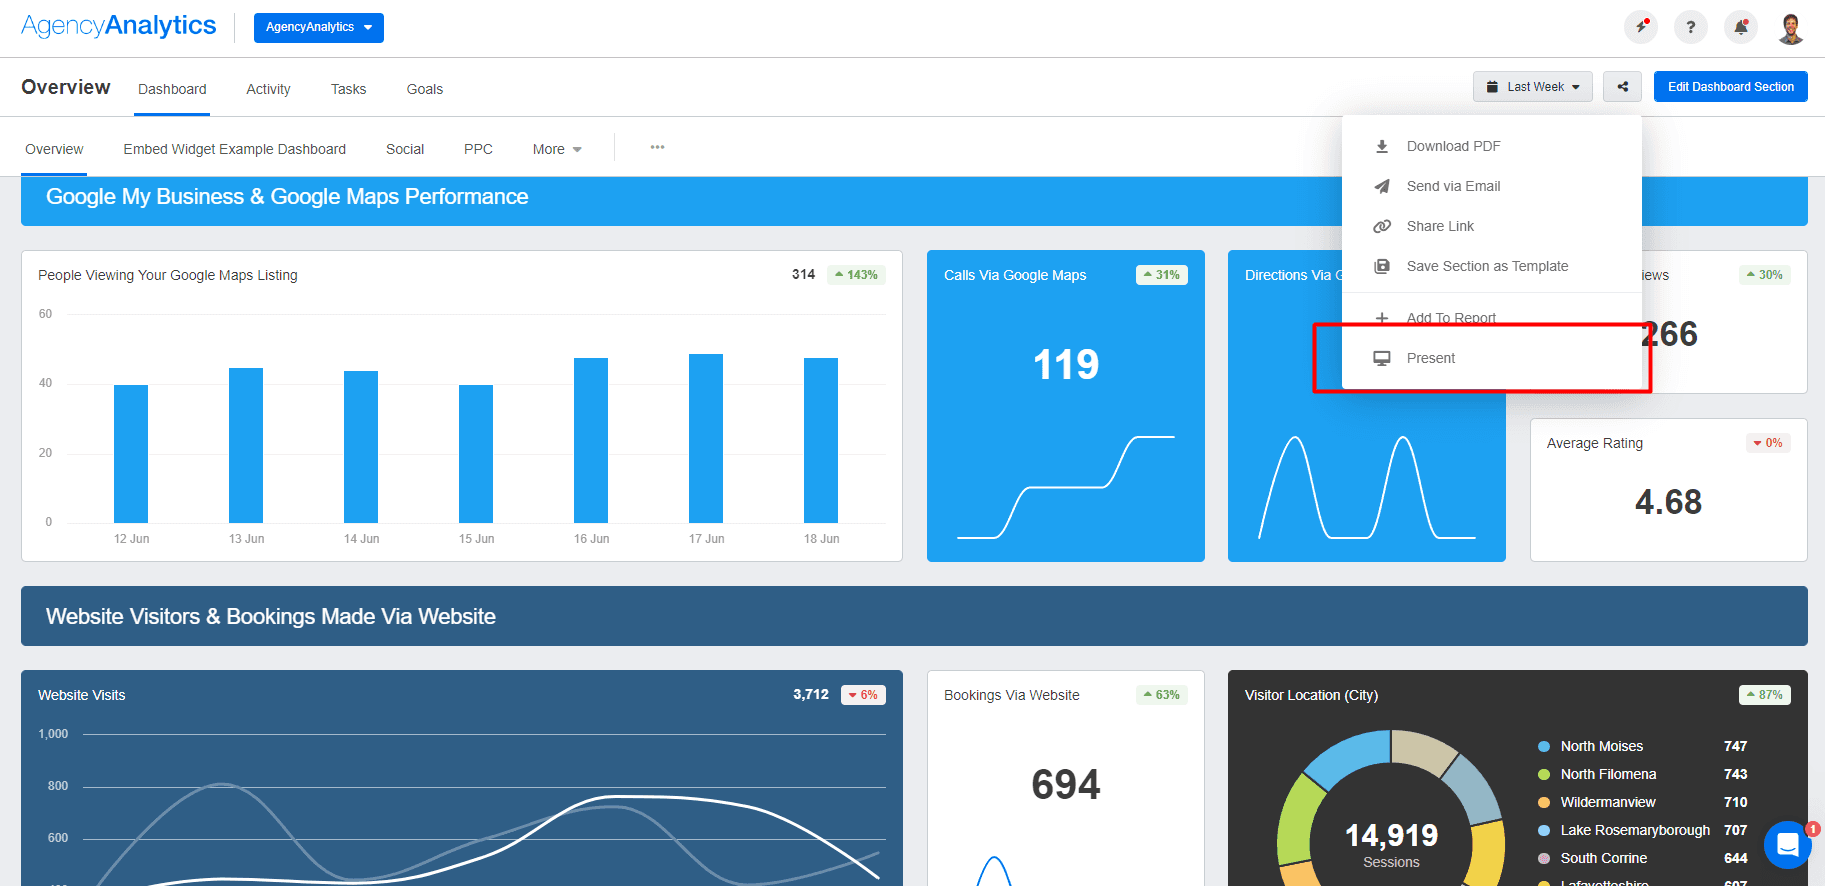
No more snooze-fest presentations. Use your AgencyAnalytics dashboards as live presentation tools–sign up for your free 14-day trial today.
Real-time data tracking, which is especially important for time-sensitive projects. As updated data filters in, use it to communicate progress, analyze data sets, and pivot strategically when necessary
Giving clients with extensive marketing experience more autonomy. If your clients have a technical understanding of how their campaigns work, sharing their live dashboards will keep them in the loop. It’ll also help them to partner with your agency more effectively, which builds trust in the process
If a client has digital marketing experience, it can be beneficial to give them access as they can analyze business performance and make their own decisions for other marketing channels based on the data.
Guy Hudson, Founder at Bespoke Marketing Plans
When To Use Reports vs. Dashboards
On the other hand, a report may be better suited to your clients’ needs in these instances:
For strategic decision-making and in-depth insights. Reports specifically showcase your clients’ most important key performance indicators, which also prevents them from ending up in a data overload. Because of this, they’re beneficial for clients that require marketing results for long-term planning (e.g., quarterly reviews for budget allocation)
To provide concise overviews of marketing performance. Reports work well to give high-level snapshots of what progress was made, in addition to notable trends and recommendations moving forward. They’re also static measures of historical performance that your clients can access at any time
When significant time is needed to generate results. Clients with limited marketing experience may not know the intricacies of campaigns or how long it takes to make significant strides. In these situations, where they are relying on your agency for the business intelligence and not just the metrics, it may be better to share marketing reports after enough time has elapsed to see significant updates
If you report too often, it's difficult to see results. It's not helpful to watch data day-over-day, and sometimes not even helpful week-over-week. However, month-over-month is a more accurate picture. It's much easier to be more consistent with looking at data compared to previous periods so that you know precisely how well you're performing for clients.
Nathan Hawkes, President at Arcane Marketing
Optimize Client Reporting: Harness the Synergy of Dashboards and Reports
It’s easy to get the best of both worlds. Here’s how to use dashboards and reports for a comprehensive approach to client reporting.
Share Real-Time Progress and Report on Historical Performance
Sometimes, it’s not about one or the other, it's about the business users. Since reports and dashboards offer many of the same features and use much of the same source data, much of it comes down to presentation. Your clients may benefit from real-time data access in a well-designed dashboard in addition to more streamlined, concise single-page reports that just covers only the highlights. That way, they’ll keep on the pulse of their marketing campaigns and also get a detailed breakdown of the results.
As an agency, the client's active campaign dashboard and final report showcase our work. It's important that we present campaign metrics accurately in an easy-to-digest format so we can easily identify insights that lead to actionable campaign optimizations, whether in real-time or as a takeaway for future campaigns.
Ashlee Brown, Campaign Performance Manager at i76 Solutions
Plus, taking this twofold approach gives your clients all the metrics they need to make informed decisions. That way, they’ll know the intricacies of their data and decide if further clarification is needed.
As Terrence Gordon, CEO of Pl8ted, shares, “We like to put some onus back on the client. A scheduled report comes with a nice note reminding them to log into their dashboard if they wish to dig more granularly into detailed data. It's up to them to come up with questions that we are more than happy to answer.”
How Agencies Use Reports and Dashboards in Real Life
While most agencies using the AgencyAnalytics use a combination of dashboards and reports, they’re used in different ways. Take these data insights from our recent Agency Benchmarks Survey:
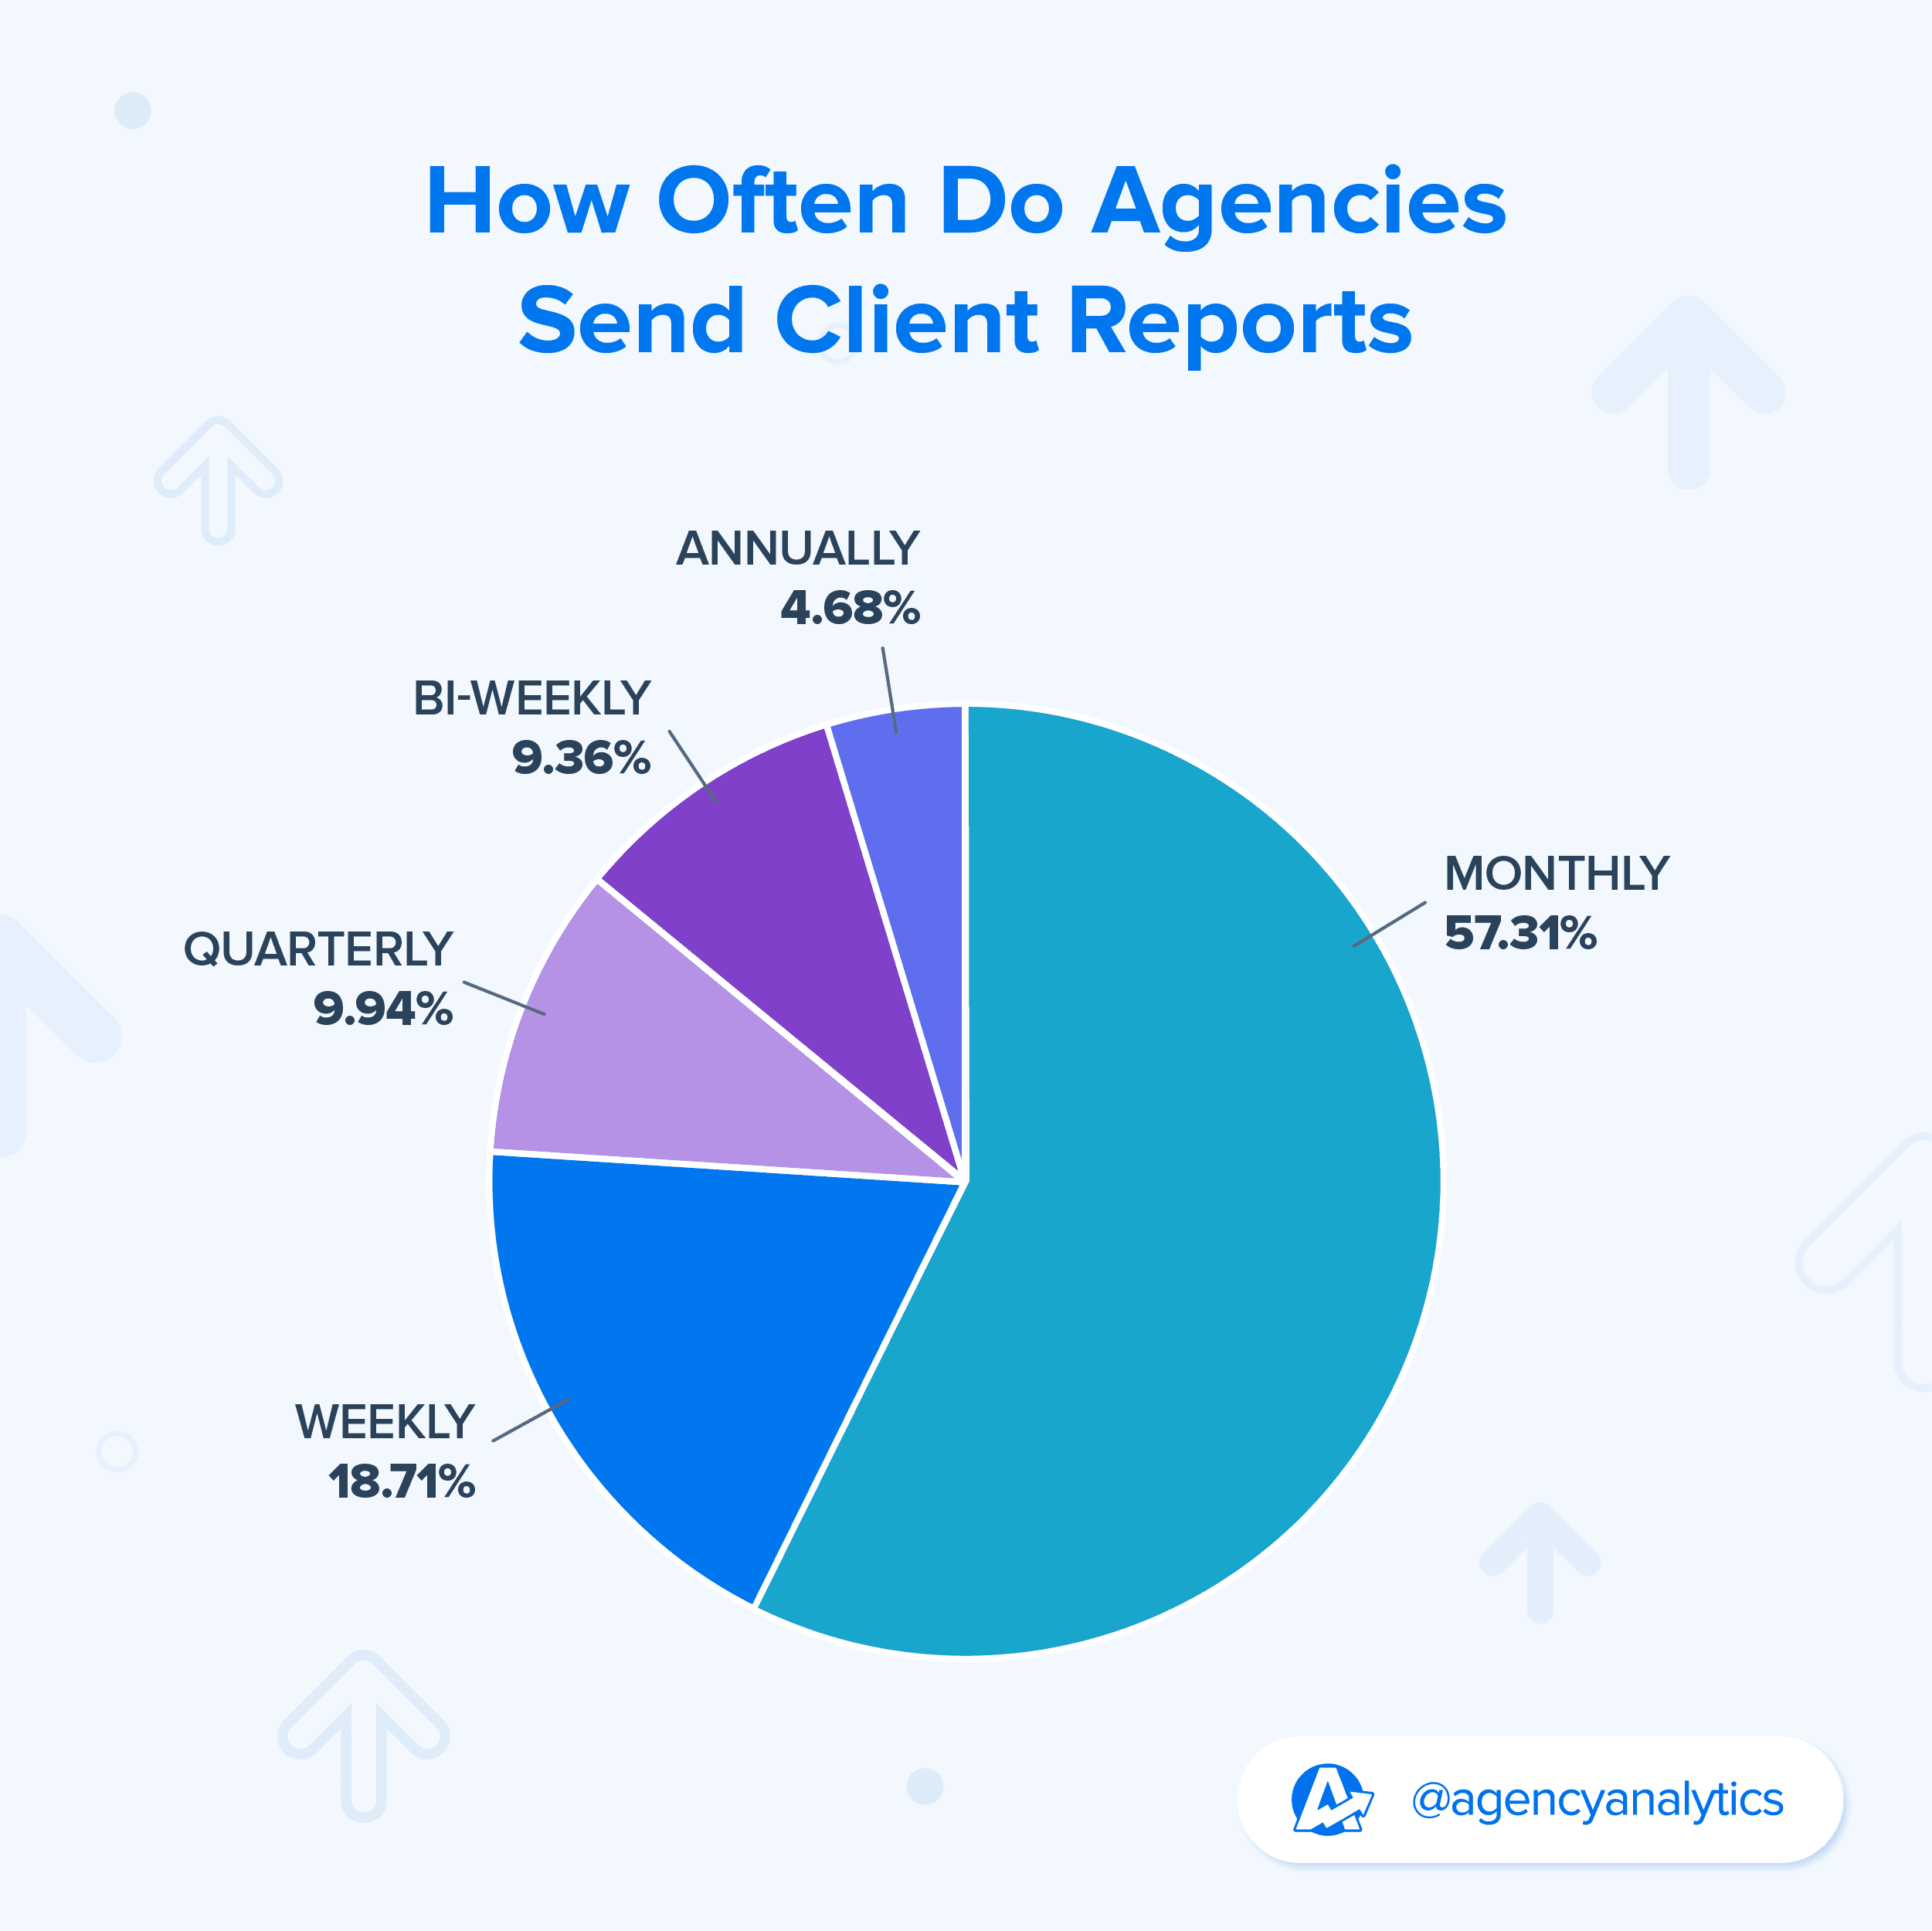
For client reporting, 61.7% of agencies mostly send static reports to clients, compared to 38.3% who create dashboards for their clients.
For campaign management, 84.4% of agencies heavily rely on live dashboards to keep internal teams informed vs. 16.5% who use report pages
The data suggests that reports are often a preferred option for sharing data with clients, as it will likely avoid any misinterpretation of real-time data.
Live dashboards are a great way for your internal team to monitor performance and make any tweaks in the background. That way, your client reports will be full of data insights that were continuously monitored and optimized over time.
Convert Dashboards into Reports in Minutes
Here’s a fun fact: It’s easy to flip AgencyAnalytics dashboards into reports within minutes! That way, clients will have the option to export dashboard data into a downloadable format. All you have to do is ensure that the “Share Dashboards & Report” toggle option is on when setting user permissions (which it is by default).
This feature is handy for clients to store regularly-updated dashboard reports on their internal drives for reference.
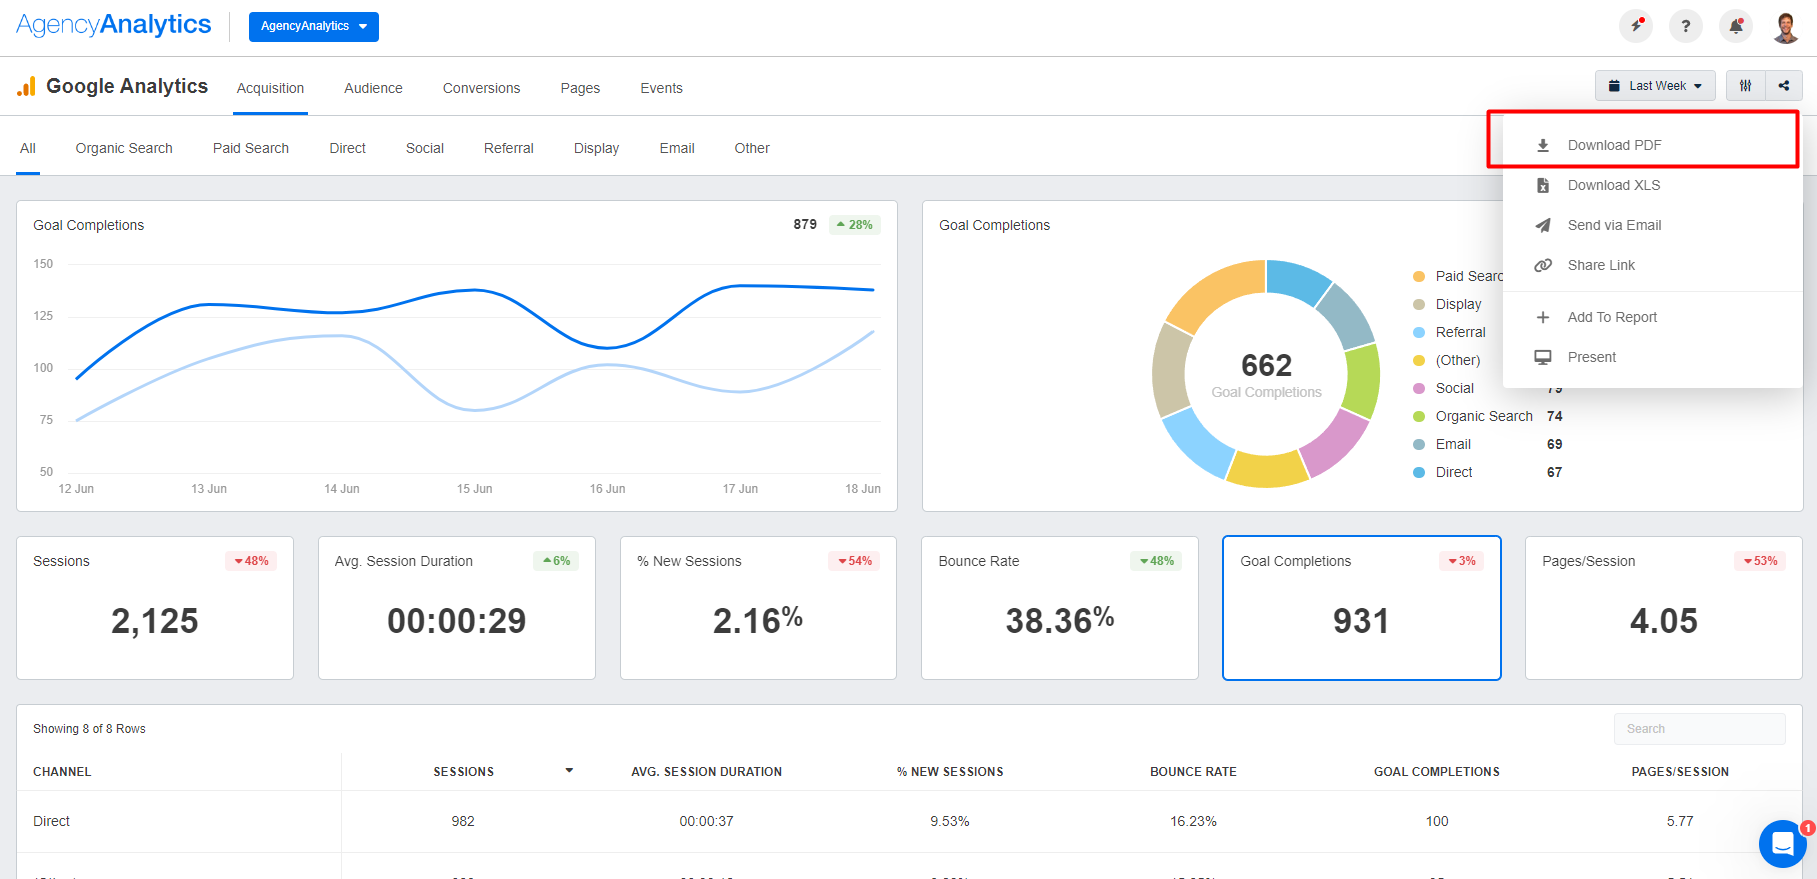
Flip dashboards into reports in just a few minutes. Customize your reporting approach to suit clients’ needs–it’s free on AgencyAnalytics with a 14-day trial.
Report Scheduling: Set It & Automate It
No need to write Post-It reminders or succumb to the woes of manual reporting. With the report scheduling feature, all you have to do is:
Build a report from scratch, choose a pre-built marketing report template, or duplicate an existing one
Choose a reporting frequency (e.g., daily, weekly, monthly)
Set a sending date and time
Add a subject and create a customized message
Save changes, and you’re good to go!
One of the most significant benefits of using AgencyAnalytics has been the automation of our reporting process. The scheduling feature enables us to send recurring reports to clients without any manual intervention, freeing up our team's time to focus on more critical tasks. This has not only increased our efficiency but also improved client satisfaction.
Alex Faiers, Founding Director at Addictivity
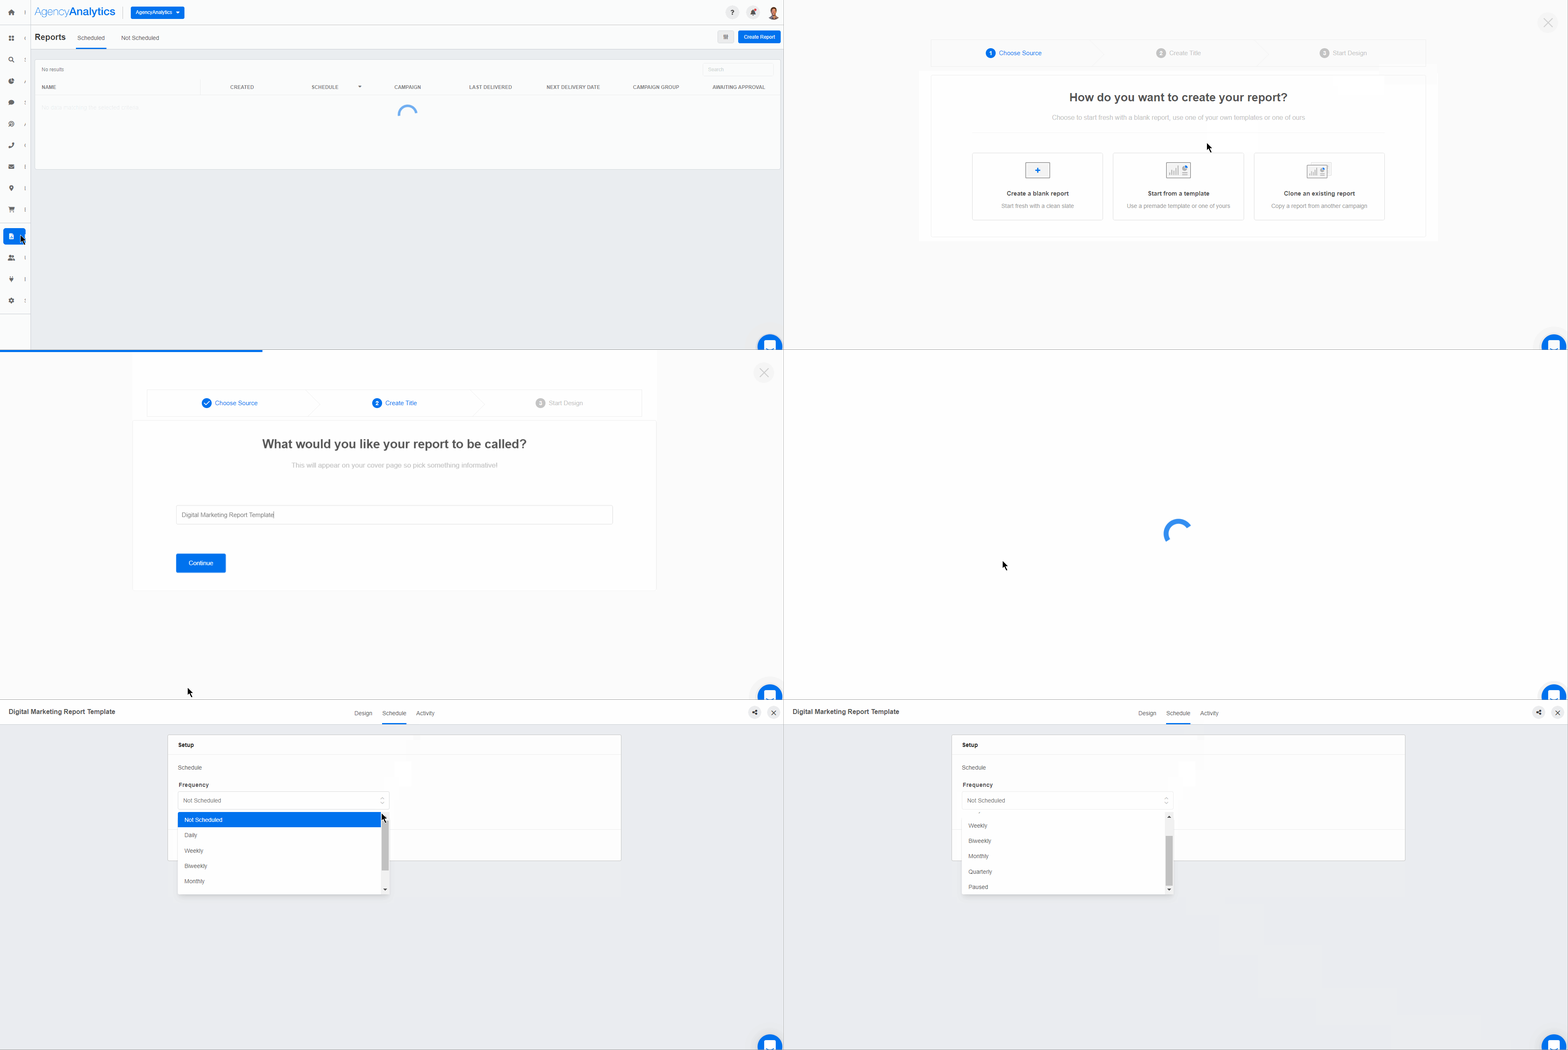
Create it, customize it, and automate it. Schedule your clients’ reports like clockwork and be on with your busy day–check it out on AgencyAnalytics, free for 14 days.
If your agency prefers to tailor reports before sending them out, use the “Require Approval” feature. This gives your agency a notification before automated marketing reports are sent (in case you want to review, tailor, or add personalization).
Use Dashboards and Reports To Paint the Full Marketing Picture
While there are key differences between reports vs. dashboards, there’s one common thread–tracking marketing performance. After all, data is a lifeline, and it’s the only way to understand your clients’ marketing efforts more intricately. Whether you’re granting login access to an SEO dashboard or sharing PPC metrics in an end-of-month report, AgencyAnalytics helps you to streamline the entire data-tracking process.
No need to reinvent the wheel each time. Access over 80 marketing integrations and seamlessly filter this data into dashboards or reports. The result? More billable time in your busy days and happier clients.
AgencyAnalytics’ interface is visually appealing and incredibly simple to navigate, allowing even the most non-technical team members to create comprehensive reports in no time. The customizable reporting dashboard presents essential KPIs and metrics at a glance, ensuring that our clients can easily understand the results of our marketing efforts.
Alex Faiers, Founding Director at Addictivity
Whether you’re creating static reports or dynamic dashboards, AgencyAnalytics has got you covered. Invest in a reporting tool designed specifically for agencies–it’s free for 14 days.

Written by
Faryal Khan is a multidisciplinary creative with 10+ years of experience in marketing and communications. Drawing on her background in statistics and psychology, she fuses storytelling with data to craft narratives that both inform and inspire.
Read more posts by Faryal KhanSee how 7,000+ marketing agencies help clients win
Free 14-day trial. No credit card required.


