Table of Contents
It goes without saying–data is your greatest ally.
In fact, it’s what you rely on, day in and day out. Whether you’re fine-tuning a client’s PPC campaigns or advising on SEO tactics, every move is grounded in hard facts and numbers (at least it should be). And when your client has specific goals to hit, your agency needs to offer more than surface-level insights.
That’s where parameters and statistics come in. They aren’t just concepts from your long-ago data science class, though. In fact, they’re a reliable way to predict macro trends, optimize real-time campaigns, and measure performance.
From calculating an ecommerce client’s conversion rate to forecasting average revenue for a specific segment, this data analysis empowers clients to make more informed decisions. It provides both high-level overviews and granular insights, offering a well-rounded perspective on marketing performance.
In this article, we’ll explore the difference between a parameter and a statistic, along with agency-specific examples to consider.
What's the Difference Between a Parameter and a Statistic?
While the words parameter and statistic are closely related, they’re distinct terms. More specifically:
A parameter is a numerical measure that describes a characteristic of an entire group (i.e., a population). For instance, this may be a client’s customer base, target audience, or total market.
Also called a population parameter, this value offers meaningful insights at a macro level, representing a fuller scope of data.
For example, a parameter may be average monthly churn rate for all users in a SaaS client’s entire customer base over the past year (e.g., 3%).
On the other hand:
A statistic is derived from a sample proportion of a larger population, which is meant to provide granular information about a specific subset.
Building on the above example, say your client’s database is segmented according to subscription tiers (e.g., basic, premium, and enterprise plans). A statistic could represent the average churn rate of premium users who signed up in the last quarter through a specific marketing channel.
Wondering about other applicable scenarios? Here are a few more to consider.
Metric Example | Population Parameter | Sample Statistic |
|---|---|---|
Average CLV of all customers over their lifetime (e.g., $10,000 across the entire customer base). | Average CLV from customers acquired through Facebook Ads (e.g., $7,500 from the sample). | |
Overall website conversion rate for all visitors (e.g., 4% across 1 million site visitors). | Conversion rate from a month-long Google Ads campaign (e.g., 5% from 10,000 visitors). | |
Market Share | Your client’s total market share in the retail industry (e.g., 15% in the global market). | Your client’s market share in North America (e.g., 20% based on a regional sales sample). |
Average satisfaction score of all customers for an ecommerce product (e.g., 8.5/10 across 20,000 surveys). | Satisfaction score from customers using a specific product (e.g., 9/10 for 2,000 customers that used Product A). | |
Total ROAS across your client’s total marketing efforts (e.g., 400% from $1M ad spend). | ROAS from a Facebook Ad campaign (e.g., 350% from $50,000 spend on a PPC campaign). | |
Average CTR across a client’s history of email campaigns (e.g., 3% across 100,000 emails). | CTR from a Black Friday email campaign (e.g., 5% from 10,000 emails sent). | |
Total Revenue | Total revenue for a client’s shoe company in a fiscal year (e.g., $50M annual revenue). | Revenue generated from a specific product (e.g., $2M from a new sneaker launch). |
Why Population Parameters and Sample Statistics Matter for Data-Driven Agencies
So, why should this level of data analysis matter to agencies?
Clients rely on your expertise beyond a couple of campaign setups. Ideally, they value a true partnership with your agency–one that yields long-term success and sustainable growth.
Using these insights is your agency’s way of saying, “Hey! We don’t just make decisions on a whim; we’re driven by hard data and evidence.” It shows that you’ve sat with the numbers, analyzed their meaning, and developed valuable findings.
More specifically, your agency should use parameters to:
Identify Broader Trends: Understand overall customer behavior (such as long-term purchasing patterns) and predict possible outcomes.
Assess Overall Performance: Measure key metrics (like the ones above) to get a clear picture of your client’s overall business health.
Develop Long-Term Strategies: Use macro-level data to set long-term goals. This may include increasing customer retention, building brand awareness, or expanding market reach.
On the other hand, statistics are useful to:
Make Deductions About Segments: Analyze data from specific customer segments (e.g., first-time buyers or high-value customers) and drill down into niche behaviors. Then, tailor your client’s strategies to engage these groups better.
Improve Personalization: Leverage statistics to create personalized marketing, such as offers for niche customer groups.
Optimize Marketing Campaigns: Use statistical data from A/B tests or targeted campaigns to refine ad placements, creative content, or messaging.
By balancing parameters and statistics, your agency adopts a dual approach–one that’s simultaneously broad and strategic. This combination shows clients that you’re capable of thinking long-term while delivering immediate, relevant results.
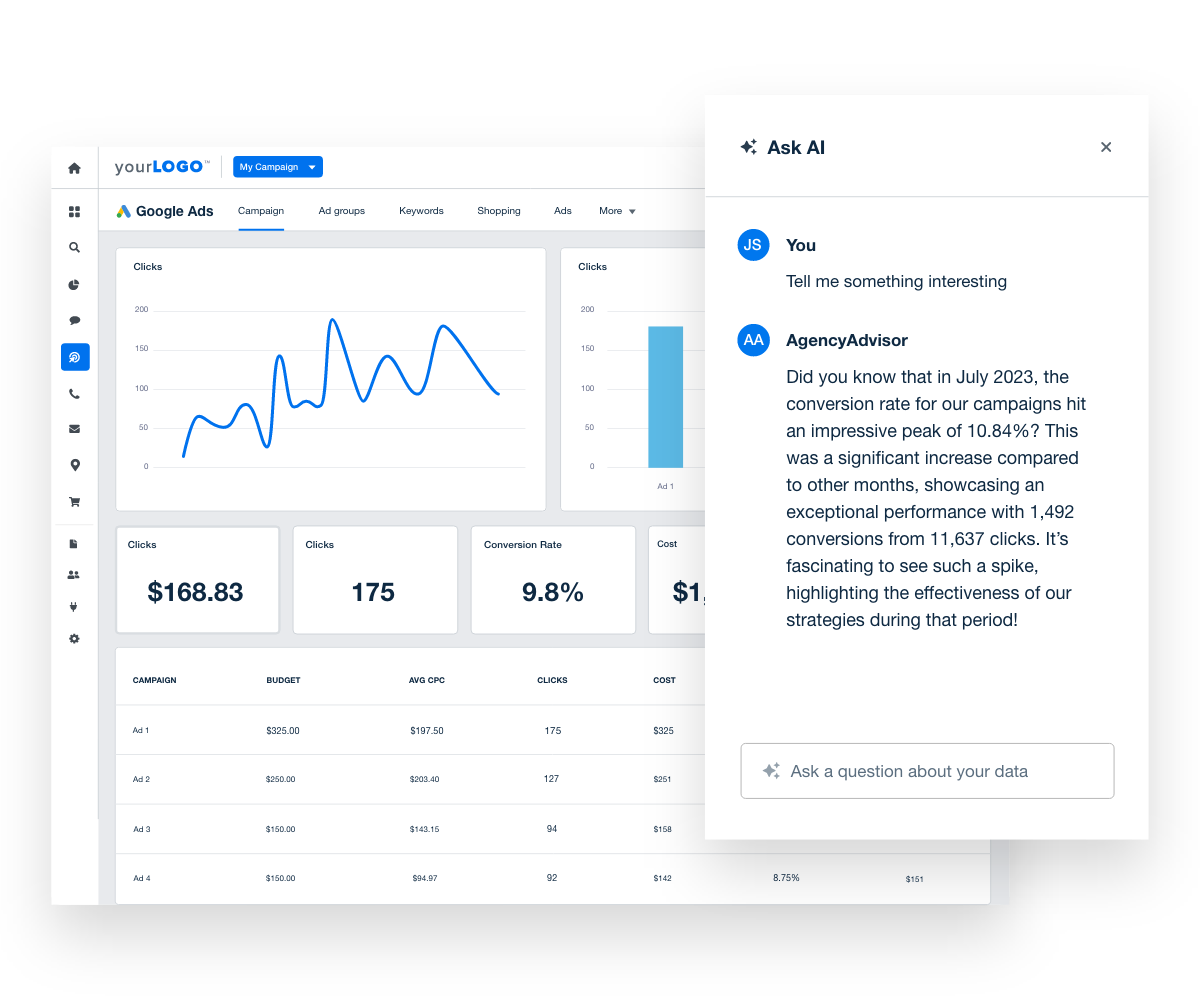
Looking for a time-efficient way to share historical trends and recent campaign results? Check out the AskAI feature in AgencyAnalytics! Identify wins, optimization opportunities, and more–sign up for a free 14-day trial today.
How To Use Parameters and Statistics in an Agency-Specific Context
Now that we’ve covered these fundamental concepts, let’s explore some agency-specific use case examples.
Get Big-Picture Insights, Even in the Absence of Entire Population Data
A true population parameter is useful for assessing the bigger picture.
That said, this data isn’t always readily available, especially for clients with broad target markets, large historical databases, or gaps in data (hey, it happens). That means it may be difficult–or downright impossible–to determine an exact population proportion, which makes it necessary to rely on sample data.
For instance, consider the following real-world scenarios that make it difficult to estimate parameters.
Challenge | Description |
|---|---|
Incomplete Data Across The Whole Population
| Realistically, the agency might not have access to data across an entire target market or customer base. For example, users may abandon a site before site tracking kicks in, which means this information won’t be captured. |
Impact of Privacy Regulations | Platform regulations (e.g., Apple’s privacy updates) may often restrict the type of data collected. This makes detailed tracking of user behaviors more difficult. |
Data Integrity Issues | Issues with tracking setups (e.g., missing UTM parameters) could lead to incomplete or skewed datasets, which reduces accuracy. |
Intricacy of Large-Scale Campaigns | Large-scale campaigns with many touchpoints (e.g., hundreds of millions of micro-interactions) will make full data collection impractical. |
Hope isn’t lost, though. In fact, the use of inferential statistics can fill this gap, providing a way to deduce macro trends in the absence of full data scopes. To elaborate further, this form of statistical analysis involves techniques like sampling and confidence intervals. In turn, it becomes easier to estimate population parameters that aren’t always accessible.
Impress clients and save hours with custom, automated reporting.
Join 7,000+ agencies that create reports in under 30 minutes per client using AgencyAnalytics. Get started for free. No credit card required.
Already have an account?
Log inSo, when might an agency rely on statistical inference?
Let’s say your client has 100,000 social media followers across Instagram, Facebook, and TikTok. They want to estimate the overall engagement rate (a parameter) for all of these followers, but analyzing every single post across these platforms (i.e., the entire population) would be incredibly time-consuming… not to mention unrealistic.
Instead, your agency might choose a random sample of 500 posts from the three platforms (e.g., 200 from Instagram, 150 from Facebook, and 150 from TikTok). This approach reflects the distribution of your client’s social media posts over time. After analyzing the sample data, your agency may end up with an average engagement rate of 4%. This information helps your client gauge their overall social media brand presence and assess how well content resonates with followers.
To expand further, consider more advanced statistical methods, such as a sample standard deviation. This numerical measure will show the average difference in engagement rates between individual posts in your sample.
Instead of calculating the population standard deviation–which would require analyzing every post across all platforms–this approach provides a reliable estimate without that extra hassle. For example, the findings may indicate that the engagement rate fluctuates by about 1%. This information helps your client understand variability in content performance and whether specific posts drive engagement more than others.
Develop Internal Benchmarks To Assess Campaign Performance
Using inferential statistics is an ideal way to create internal benchmarks and make predictions about campaign performance.
For example, say your agency has a legacy client that has been running Facebook Ads for several years. Over this period, they’ve accumulated significant conversion value data across multiple age groups.
Using the approach described earlier, your agency may decide to have a sample drawn from previous campaigns. If your client has consistently targeted a 25 to 34 age group for the past three years–with an average conversion value of $100–use this as a benchmark for future campaigns targeting the same age group. Once this metric stays in a reasonable range (like $85 to $115), it means the campaign is performing as expected.
By leveraging benchmarks, your agency is better equipped to make future projections and identify areas for optimization.
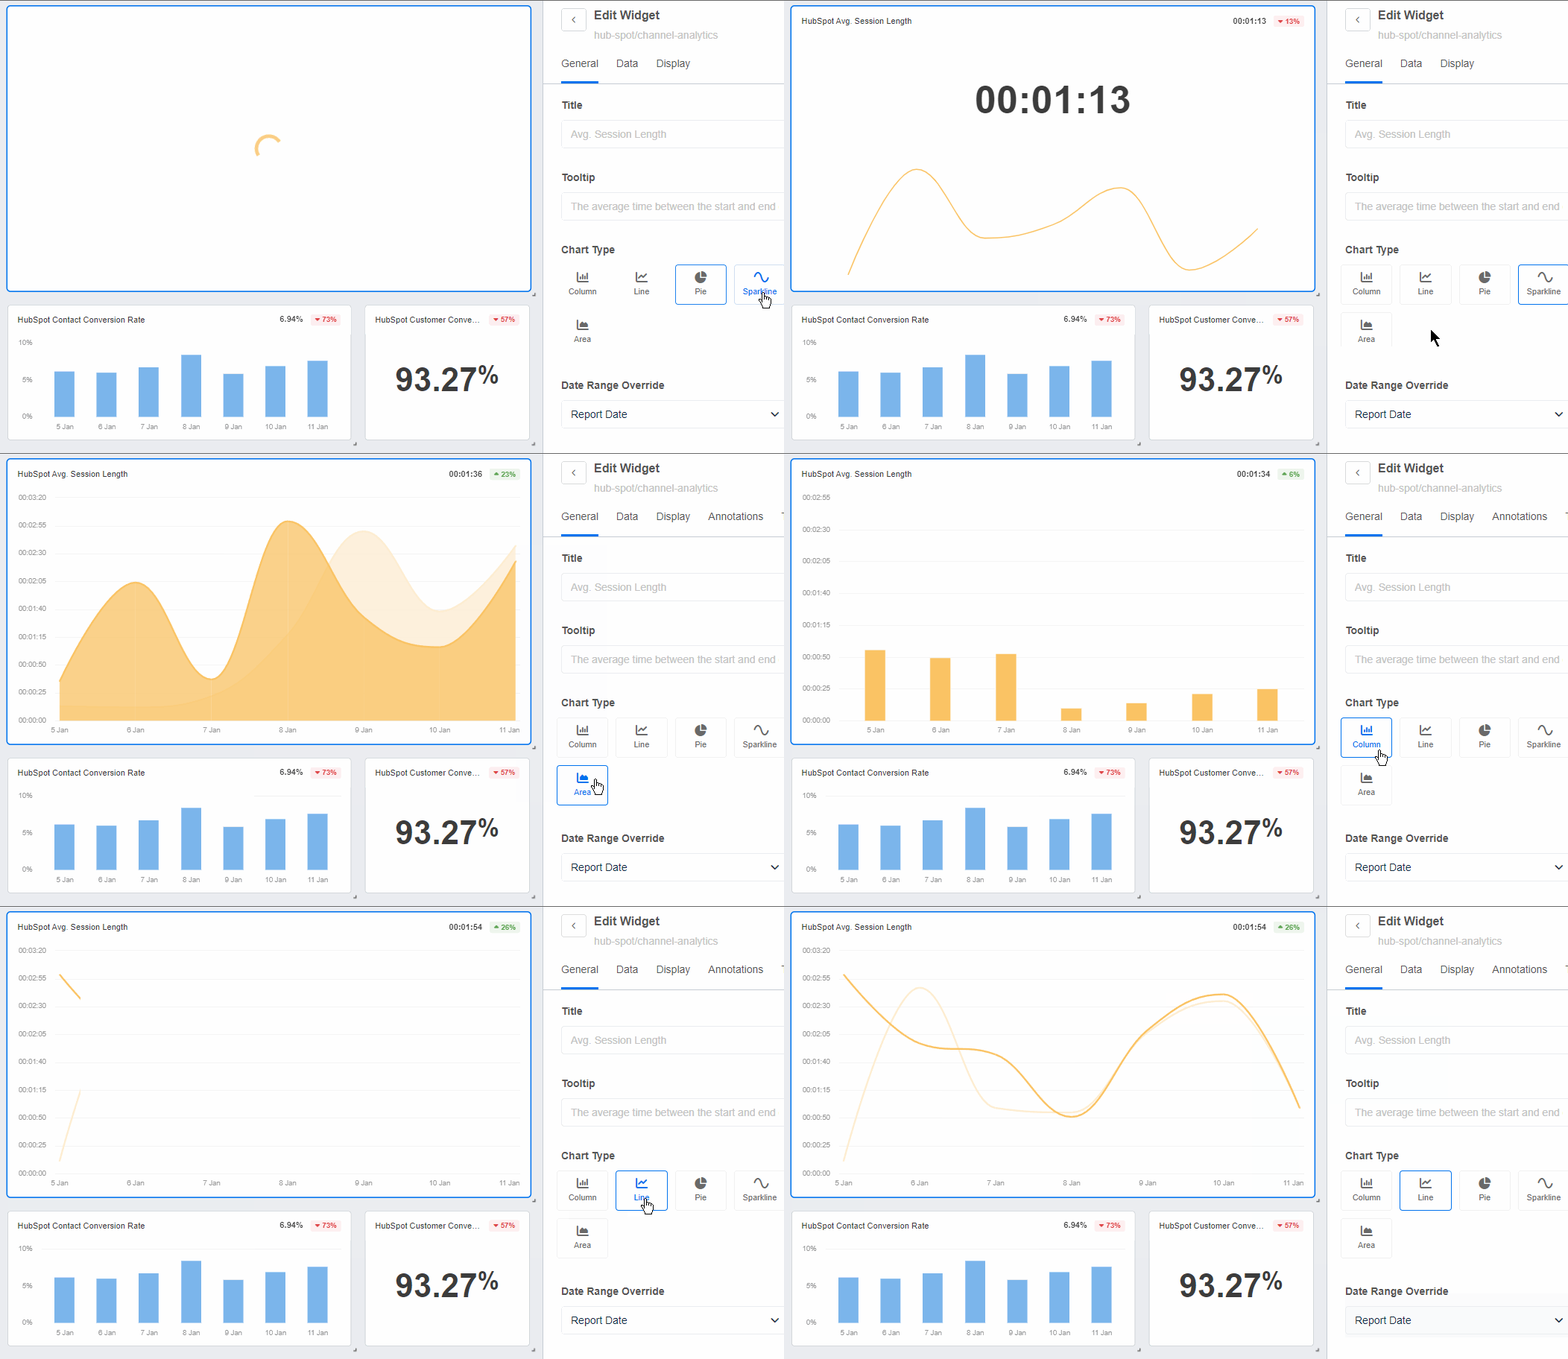
Access statistical analyses and easy-to-understand visualizations. Monitor campaign performance, all while sharing solid data interpretation with your clients–explore AgencyAnalytics, free for 14 days.
Use Statistics and Parameters To Fuel Data-Driven Decision Making
Parameters and statistics are more than numerical values.
In fact, they help your agency to provide real value beyond a couple of campaign results or surface-level insights. To sum things up, use these concepts to:
Balance Big-Picture Thinking With More Immediate Decisions: Parameters reflect a total population, which provides a big-picture view of a client's audience, campaign performance, or industry. In contrast, statistics allow agencies to extract insights from smaller samples of that data, which should be used for more short-term decisions.
Draw Conclusions Without Relying on Full Data From Entire Populations: Through carefully executed sampling methods, your agency can extrapolate insights from partial data. To get the most from this exercise, use a representative sample that reflects the broader group.
Create Benchmarks To Evaluate Campaign Performance: Use this data to its full capacity, especially if you have clients with a wealth of historical insights. Take a sufficient sample size of a broader population and develop your own internal benchmarks. Then, use these data points to ensure campaigns are progressing well.
With so much at stake, your agency needs a central hub for all those rich data insights.
No need to rely on complex spreadsheets or other outdated methods–use AgencyAnalytics instead! It’s a way to automate data retrieval, track emerging trends, and identify opportunities for real-time campaign optimization.
We needed a place where clients could look at stats that are easily digestible. The AgencyAnalytics reporting platform provides great visuals for our clients–they're beautiful and easy to read.
Rachel Jackson, Lead SEO, Wit Digital
From AI-generated insights to white label reporting, AgencyAnalytics has everything you need–all in one place. Sign up for a free 14-day trial today.

Written by
Faryal Khan is a multidisciplinary creative with 10+ years of experience in marketing and communications. Drawing on her background in statistics and psychology, she fuses storytelling with data to craft narratives that both inform and inspire.
Read more posts by Faryal KhanSee how 7,000+ marketing agencies help clients win
Free 14-day trial. No credit card required.


