Table of Contents
QUICK SUMMARY:
Google Ads metrics show how well campaigns perform and where to improve. The most important ones—like CPC, CPA, and Quality Score—help agencies measure efficiency, optimize budgets, and prove ROI. This article delves into the top Google Ads metrics to measure performance, inform optimizations, and prove ROI. It also highlights why a dedicated reporting tool is essential for simplifying data management and uncovering actionable insights.
Running Google Ads campaigns means juggling a constant stream of numbers. Impressions, clicks, conversions, costs.. you name it. Even seasoned marketers may feel overwhelmed by this sheer volume of available data. Google Ads is a complex platform, after all, and digging into every metric simply isn’t practical. The key is maintaining clarity and focusing on the ones that directly impact performance.
While some data points provide insight into campaign health, others distract from what really matters. So the question remains: How do you determine which Google Ads metrics are worth focusing on? And more importantly, how should you use them to improve performance and set KPIs that reflect your client’s business goals?
If you’re not sure where to begin, don’t worry. This article covers the most important Google Ads metrics agencies should track, along with the best ways to assess ad quality and ensure ROAS. We’ll also share the importance of using a dedicated PPC reporting tool to consolidate data across multiple clients in one place.
What are Google Ads metrics?
Google Ads metrics are key indicators that show how your client’s campaigns are performing. They measure what happens when an ad appears on a search results page and how users interact with it—whether through impressions, clicks, or other actions.
More specifically, Google Ads has a variety of metrics, ranging from impressions to conversions and practically everything in between. Some of these metrics–like CPCs, CPAs, and Quality Score–are useful for optimizing Google ad campaigns and improving ROI.
In contrast, other metrics—like impression share or budget limits—don’t always reflect true campaign performance. While they could highlight growth opportunities, they’re designed with the goal of encouraging advertisers to spend more for additional visibility. Therefore, increasing ad spend isn’t always the right move for every client or campaign.
The key is knowing which metrics truly matter, which we’ll dive into in the sections ahead. That way, you’ll keep the focus on practical insights, not fluffy or irrelevant data.
Vanity metrics tend to show some of the ignorance that you see in the industry from time to time. There are some who like to gloat, but don't have much to show. They are grabbing for shoestrings. Those who know the difference are able to actually make a difference. For example, a vanity metric might be showing that your Google Ads have a certain percentage of a click-through-rate (CTR). But an actionable metric might be the actual conversion rate. Or, even better, the cost per click as opposed to the actual cost per acquisition.
Nathan Hawkes, President, Arcane Marketing
Understanding Google campaign and ad quality metrics
Simply put, ad quality is a significant factor in campaign performance. Google rewards relevant ads with better placements and lower costs, while weaker matches end up paying more to compete in the same auctions.
Additionally, Google provides a built-in rating system that helps evaluate campaign quality at a glance–let’s explore in more detail.
How do you measure campaign performance or ad quality?
While there are many factors at play, there are a few reliable signals to measure and improve Google Ads campaign quality:
Together, they provide a clear picture of ad relevance, overall impact, and whether there’s a strong user experience after the click. None of this matters, though, without accurate conversion tracking, so remember to check whether it’s set up correctly.
Quality Score
Quality Score reflects the relevance and quality of your client’s keywords, ads, and landing pages. It’s scored on a scale from 1 to 10 and plays an important role in determining both cost-per-click (CPC) and ad rank in the auction. The more relevant your client’s ads are to searchers, the less they’ll pay, and the better placement they’ll earn.
Here’s a tip–look beyond ads themselves and invest in the underlying content that supports them. This holistic approach ensures maximum visibility for organic search results and paid efforts.
We focus heavily on content creation and the internal keyword side of local SEO. This supports our paid marketing strategies, ensuring high Quality Scores and efficient ad performance.
Bec Moloney, Senior Account Manager, Redsteps Consulting
That said, automation and AI-driven bidding strategies (like Maximize Conversions, Target CPA, or Target ROAS) now handle much of the heavy lifting, adjusting bids in real time based on dozens of signals. Because of this, advertisers don’t need to chase Quality Score numbers the way they used to.
It doesn’t mean Quality Score is irrelevant. Think of it as an important diagnostic tool, like a “check engine light” for campaigns. A strong score gives automation a solid foundation to work from, helping ads appear more often and at lower costs. A weak score, on the other hand, makes it harder for Google’s automation to deliver results efficiently.
With that said, Google continues to calculate Quality Score based on three core components:
Ad relevance: How closely your client’s ad copy matches the search terms and intent of the user.
Expected CTR: Google’s prediction of how likely people are to click the ad compared to others.
Landing page experience: The usefulness and ease of the page users land on, including speed, mobile friendliness, and how well the content matches the promise of the ad.
In short, while AI bidding now takes care of much of the optimization, Google still relies on the same Quality Score factors—ad relevance, CTR, and landing page experience—to drive performance.
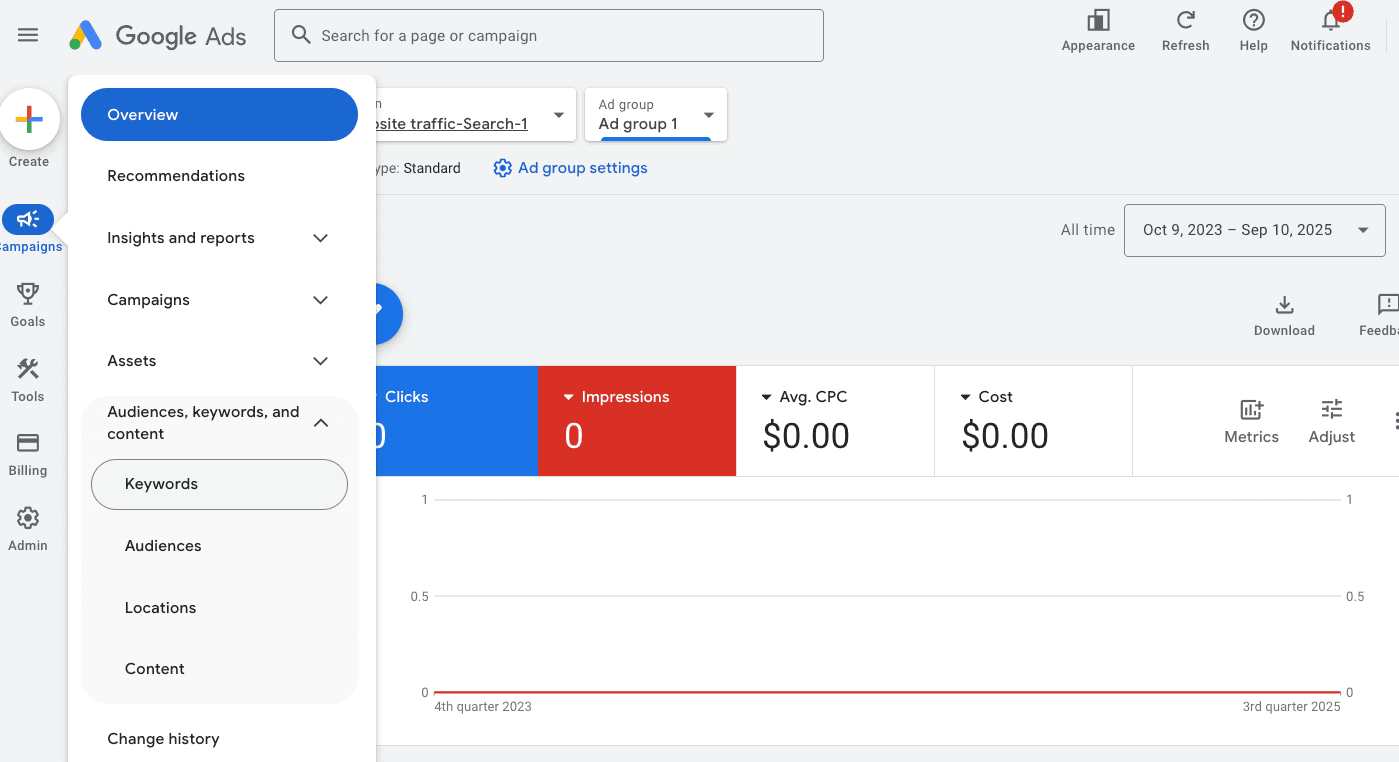
If Quality Score isn’t already displayed in your Google Ads account, setting it up is easy. First, go to “Campaigns” and then “Keywords” under the “Audiences, keywords, and content” section.
Next, click the “Columns” icon in the right corner. Then, scroll to “Quality Score” and ensure the first option is checked.
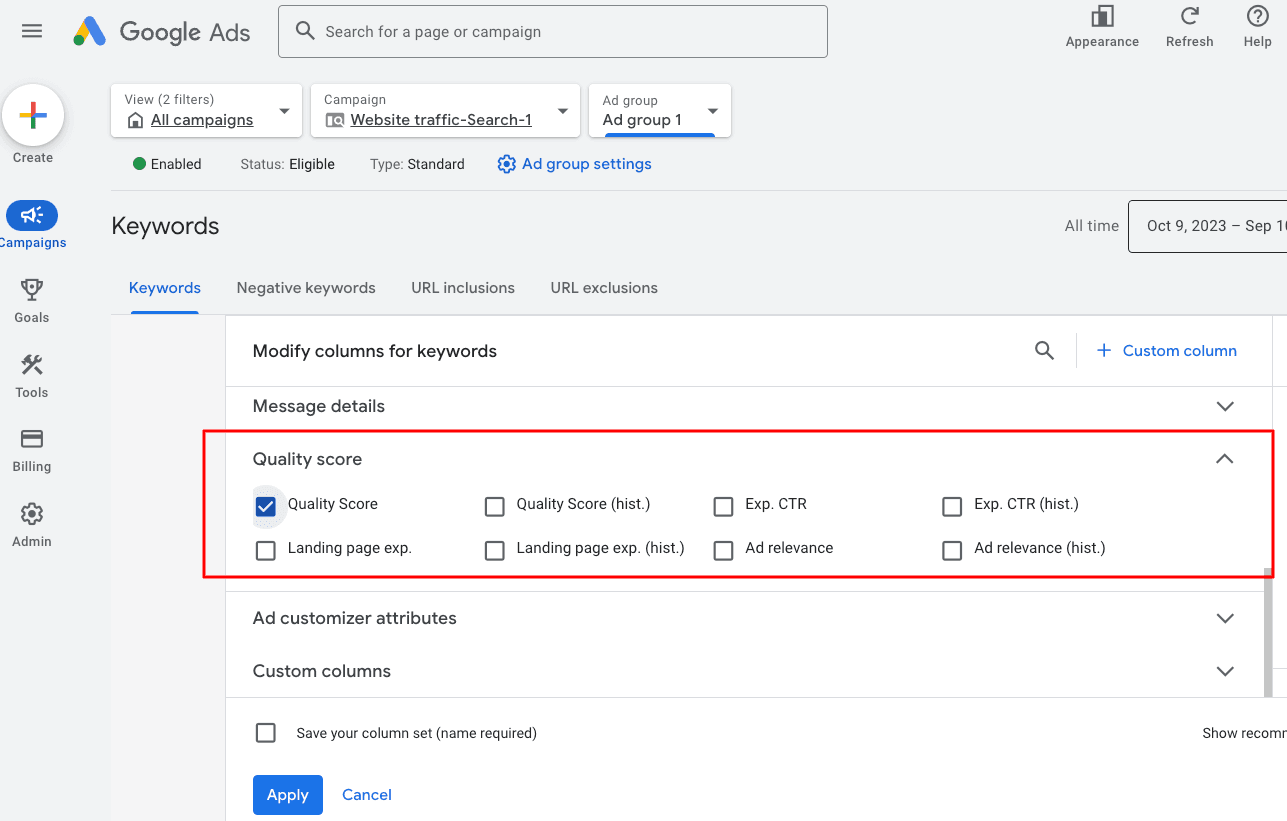
That's it! You’ll also have the option to include additional details, like historical data and expected clickthrough rates.
Clickthrough rate (CTR)
Although CTR is part of Google’s overall Quality Score calculation, it’s also one of the most direct ways to measure campaign quality. As a quick reference, CTR is calculated as total ad engagements divided by the number of impressions. For example, if your client’s ad receives 5 clicks from 100 impressions, their CTR is 5%.
A healthy CTR shows that the ad is relevant and engaging, which boosts Quality Score, lowers costs, and increases visibility. If an ad has a low CTR, it usually means one of two things:
The keyword isn’t aligned with search intent: Even if you think you’re bidding on the right keywords, a low CTR can reveal that the ad isn’t matching what users are truly looking for.
The ad copy isn’t compelling enough: If the keyword intent is spot-on but clicks aren’t happening, the problem may lie in the headlines or descriptions. In these cases, the ads may simply fail to grab attention or motivate potential customers to act.
To fix this, tighten keyword targeting, refresh the ad text so it mirrors search intent, and use responsive search ads to automatically test variations. Add extensions like sitelinks or callouts to stand out in the results, and make sure the landing page fulfills the promise made in the ad.
Landing page engagement (formerly bounce rate)
It’s not enough to know that someone clicked on your client’s ad—you also need to know what they did once they arrived on the site. That’s where Google Analytics (GA) data comes in. While Google Ads tracks impressions and clicks, GA reveals how visitors behave after the click.
Also, it’s worth noting that the old “bounce rate” has been replaced with engagement rate in GA4. Instead of just showing how many people left immediately, engagement rate highlights the estimated percentage of visitors who actually interacted with the page (e.g., staying at least 10 seconds, clicking through to another page).
Observing a low engagement rate? It likely means that:
The landing page didn’t match the visitor’s search intent.
The design, copy, or CTAs weren’t strong enough to keep them interested.
To avoid this, try to bring the user as close to the final product search as possible. As a rule of thumb, remember that you have less than 5 seconds to catch a user's attention and keep them on the page.
For example, if someone searches for men’s yellow tennis shoes, don’t send them to a generic shoe or men’s shoes page. Link directly to men’s yellow tennis shoes. That way, the landing page matches search intent and keeps visitors engaged.
Here’s a tip–don’t be afraid to use the Dog Whistle approach in your client’s landing page copy. Just like a real dog whistle is only heard by dogs, this style of messaging speaks directly to their ideal customer while quietly filtering out those who aren’t a fit.
In practice, that means making it immediately clear: “This is exactly what you were looking for.” At the same time, it signals to non-buyers—like tire-kickers or price shoppers—that the product or service isn’t meant for them.
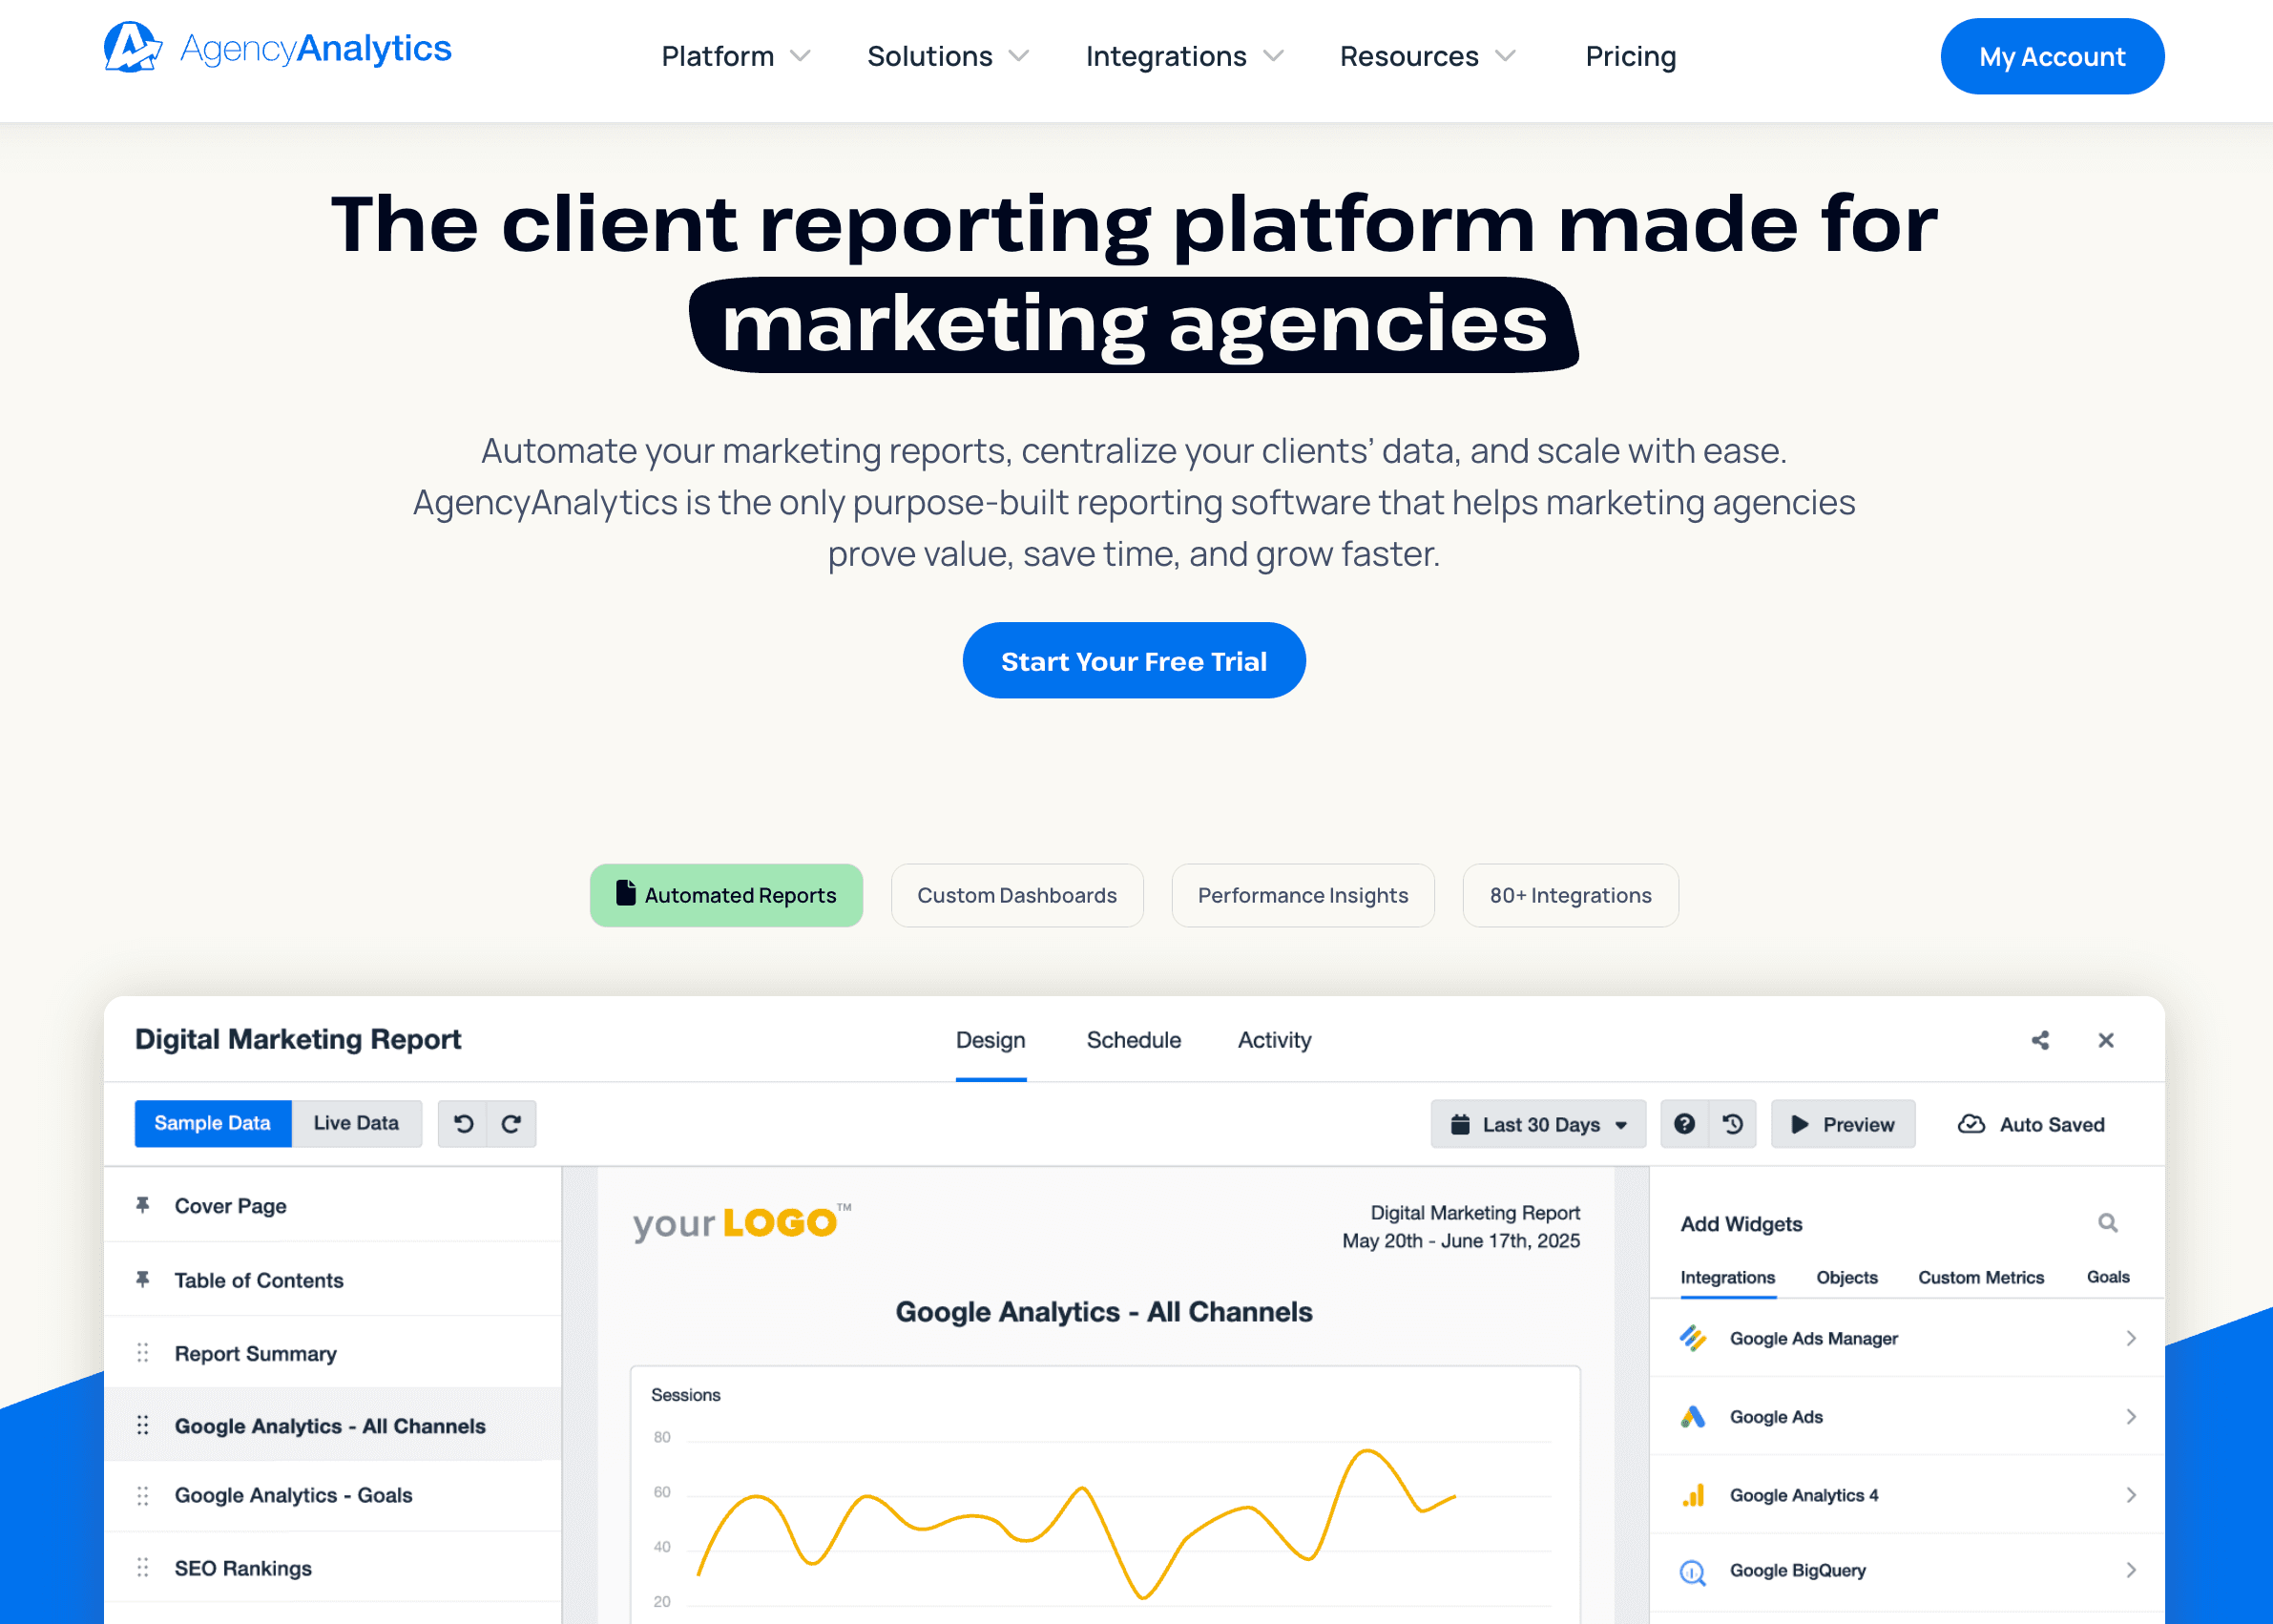
For example, the AgencyAnalytics homepage states up front that the platform is built for marketing agencies that need help with client reporting. That’s Dog Whistle copy in action: It resonates strongly with the right target audience while discouraging those outside it.
How do you improve Google Ad campaign quality?
At this point, it’s clear that campaign quality is more than pursuing a higher Quality Score. Instead, it’s about improving the underlying signals that both users and Google’s automation care about.
The good news? The same best practices that worked years ago are still effective today, with a few important updates. To bring it all together, here are the core areas that make the biggest impact (with a few reminders from earlier):
Create tightly themed ad groups: Group similar keywords together (think STAGs: Single Theme Ad Groups) so ads and landing pages align closely with search intent. This helps Google’s automation work with greater precision.
Continuously test ad copy: With Responsive Search Ads now the default, give Google multiple headline and description variations. While the system will automatically find the best combinations, it’s still critical to supply strong inputs.
Invest in dedicated landing pages: Pages that are fast, mobile-friendly, and aligned with the ad’s promise will perform better. Google’s Core Web Vitals—especially page speed and mobile usability—carry even more weight.
Use the right keyword match type: These settings control how closely a user’s search query must align with your keywords. Exact match only triggers ads for very close matches, phrase match allows slight variations, and broad match casts the widest net. While broad match once wasted budget, it now performs better when paired with smart bidding and a strong negative keyword list.
Leverage ad extensions: As previously mentioned, sitelinks callouts, structured snippets, and image extensions make ads more engaging. This may indirectly boost CTR and Quality Score.
In short, it’s important to align every step of the user journey: The keyword, the ad copy, and the landing page. Do that, and Google’s automation has a stronger foundation to work from, delivering more clicks, higher engagement, and better results.
Breaking down the 15 most important Google Ads metrics
Google Ads offers a flood of data, but only a handful of numbers truly impact performance.
Here is the list of key Google Ads metrics to track daily:
Google Ads Metric | Description | Usage Insights |
|---|---|---|
Impressions | The number of ad views divided across all eligible placements. | Gauges reach and visibility. High impressions suggest strong targeting, but low engagement may signal misaligned copy, ad format, or audience. |
Total clicks | Total clicks across all campaigns. | Core engagement metric. More clicks mean ads are resonating, but conversion data will often matter most. |
Clicks by campaign | The number of times specific campaigns were clicked on. | Useful for identifying top-performing campaigns and reallocating budget where needed. |
Click-through rate (CTR) | % of people who saw an ad and clicked. | A health check for ad relevance and appeal. A low CTR may indicate weak targeting or uninspiring ad copy. |
Average amount paid per ad click. | Essential for budget efficiency. High CPCs may require better ad relevance, improved Quality Scores, or adjusted bidding strategies. | |
Cost | Total spend across campaigns. | Ensures ad spend aligns with client budgets and ROI goals. |
Conversions | Number of desired actions completed (purchases, leads, phone calls, etc.). | The ultimate success metric; shows whether clicks are driving business value. |
Conversion rate | The % of visitors who clicked and converted. | Reflects traffic quality and landing page effectiveness. A low conversion rate reflects poor targeting or a weak page experience. |
Average cost per action (CPA) | The average cost to acquire one customer or lead. | Critical for measuring profitability. Rising CPA = wasted spend or inefficient targeting. |
Return on ad spend (ROAS) | The revenue generated for every dollar spent on ads. | Direct measure of efficiency and profitability. A top KPI for ecommerce and revenue-focused campaigns. |
Quality score | Google’s rating of keyword, ad, and landing page relevance. | No longer something to “chase,” but still a valuable diagnostic. Strong scores lower CPCs; weak scores reduce automation effectiveness. |
Ad rank | Average position of your client’s ad in the auction. | Determines visibility vs competitors; influenced by both bid amount and ad quality. A poor ad rank means ads show less often and in lower positions. |
Cost per thousand impressions (CPM) | The average cost per 1,000 ad views. | Best for brand awareness campaigns where visibility is the goal. |
View-through conversions (VTCs) | Users who saw but didn’t click an ad, then later converted. | Measures the impact of an ad that helps drive a conversion, even if it wasn’t the last interaction. For this to be tracked, ensure your client has an Active View enabled site. |
Impression share (IS) | Percentage of impressions your client’s ads received compared to the total they were eligible for. | Compares visibility to other advertisers’ shopping ads and search campaigns. |
By focusing on these core Google Ads metrics, you’ll gain a clear view of campaign performance, make smarter decisions, and deliver reports that highlight real business impact.
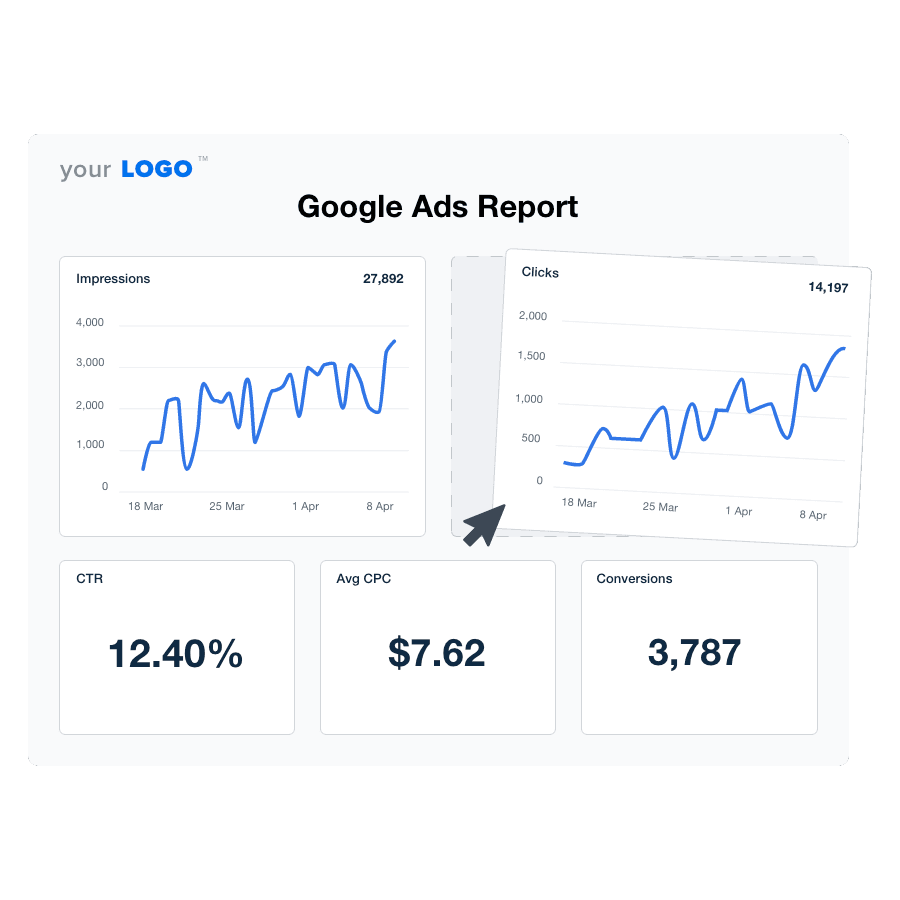
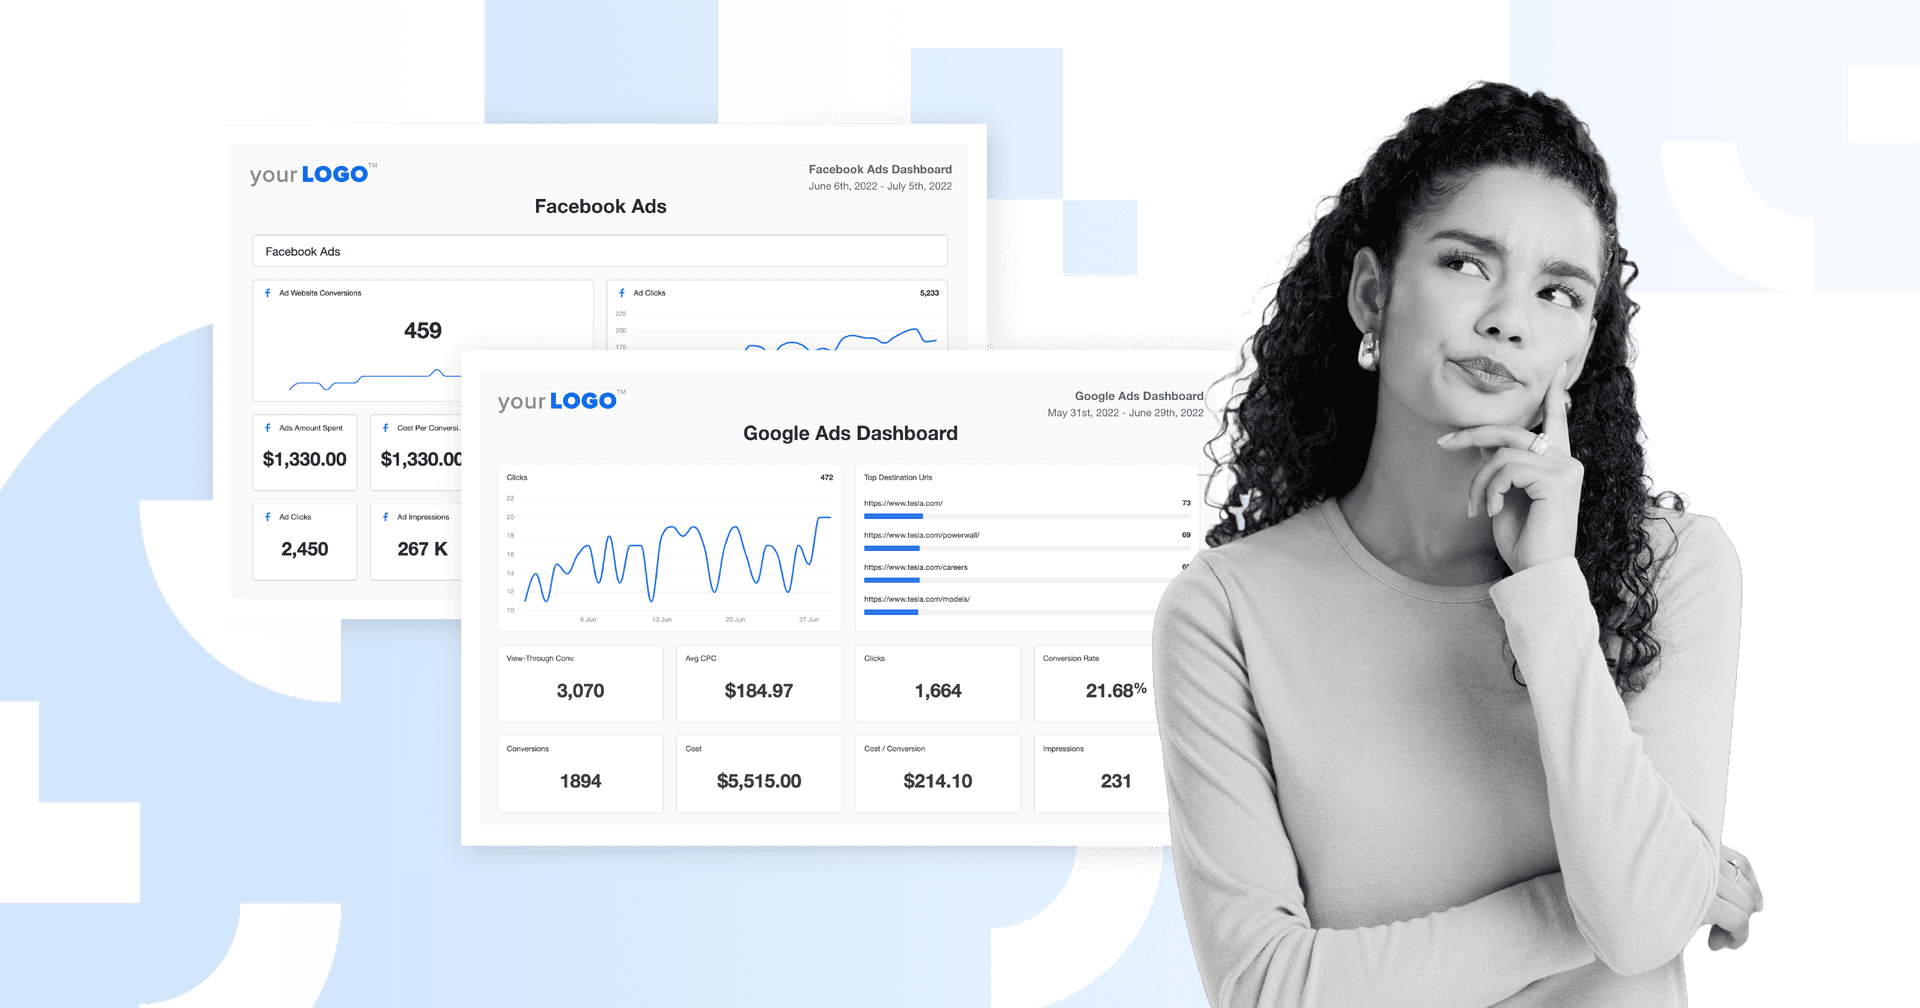
Use the pre-built Google Ads dashboard template to present your client’s data in an easy-to-understand, visually appealing format. Try it for yourself with the AgencyAnalytics 14-day free trial.
Importance of KPIs and data-driven decision making
While KPIs and metrics are closely related, they aren’t always the same thing. For quick reference:
A KPI is a metric chosen to measure progress toward a specific goal.
A metric is any data point you can track, but not all metrics directly indicate success.
Read more about the difference between a KPI and a metric.
For example, say your client’s goal is to improve efficiency and generate more revenue from ad spend. While supporting metrics (like CPC, CPA, and conversion rate) add context, they don’t directly tie back to the business objective. In this case, an appropriate KPI would be ROAS, since it directly measures revenue earned for every dollar spent.
KPIs also make it easier to compare performance across campaigns or ad groups. For example, your agency might evaluate ROAS for ads on the search network against those on the display network. This type of comparison highlights where to reallocate budget, refine targeting, or double down on winning strategies.
Your client’s KPIs will also depend on their industry, goal, and campaign type. For example, search campaigns may be used to drive online sales for a retail client. On the other hand, display campaigns could be a priority for a B2B brand that wants to drive awareness and stay relevant to decision-makers.
Not sure what this looks like in a real-world context? Here are a few examples to contextualize things more.
Client Type | Google Ads KPI Examples |
|---|---|
Ecommerce client | Clicks, conversions, conversion rate, cost, CPA, revenue, ROAS |
SaaS client | Clicks, PQLs, cost, CPA |
Local services client | Impressions, leads, cost, cost per lead, conversion rate, revenue |
Brand-focused client | Impressions, impression share, CTR, clicks, cost |
Profit-focused client | Clicks, conversions, revenue, CPA, cost, ROAS, ROI |
Growth-focused client | Impressions, clicks, conversions, revenue, cost, CPA |
Agency Tip: Use a client onboarding questionnaire to identify which Google Ads metrics and KPIs are most important to your clients. Then, build campaign dashboards and automated reports to provide that data consistently.
Comparing Google Ads performance metrics against industry benchmarks
Google Ads benchmarks are like a cheat sheet for running smarter campaigns. They help agencies figure out what’s working, what’s not, and where there’s room to improve. Instead of guessing, you’ve got real data to back up decisions, and your clients will love that.
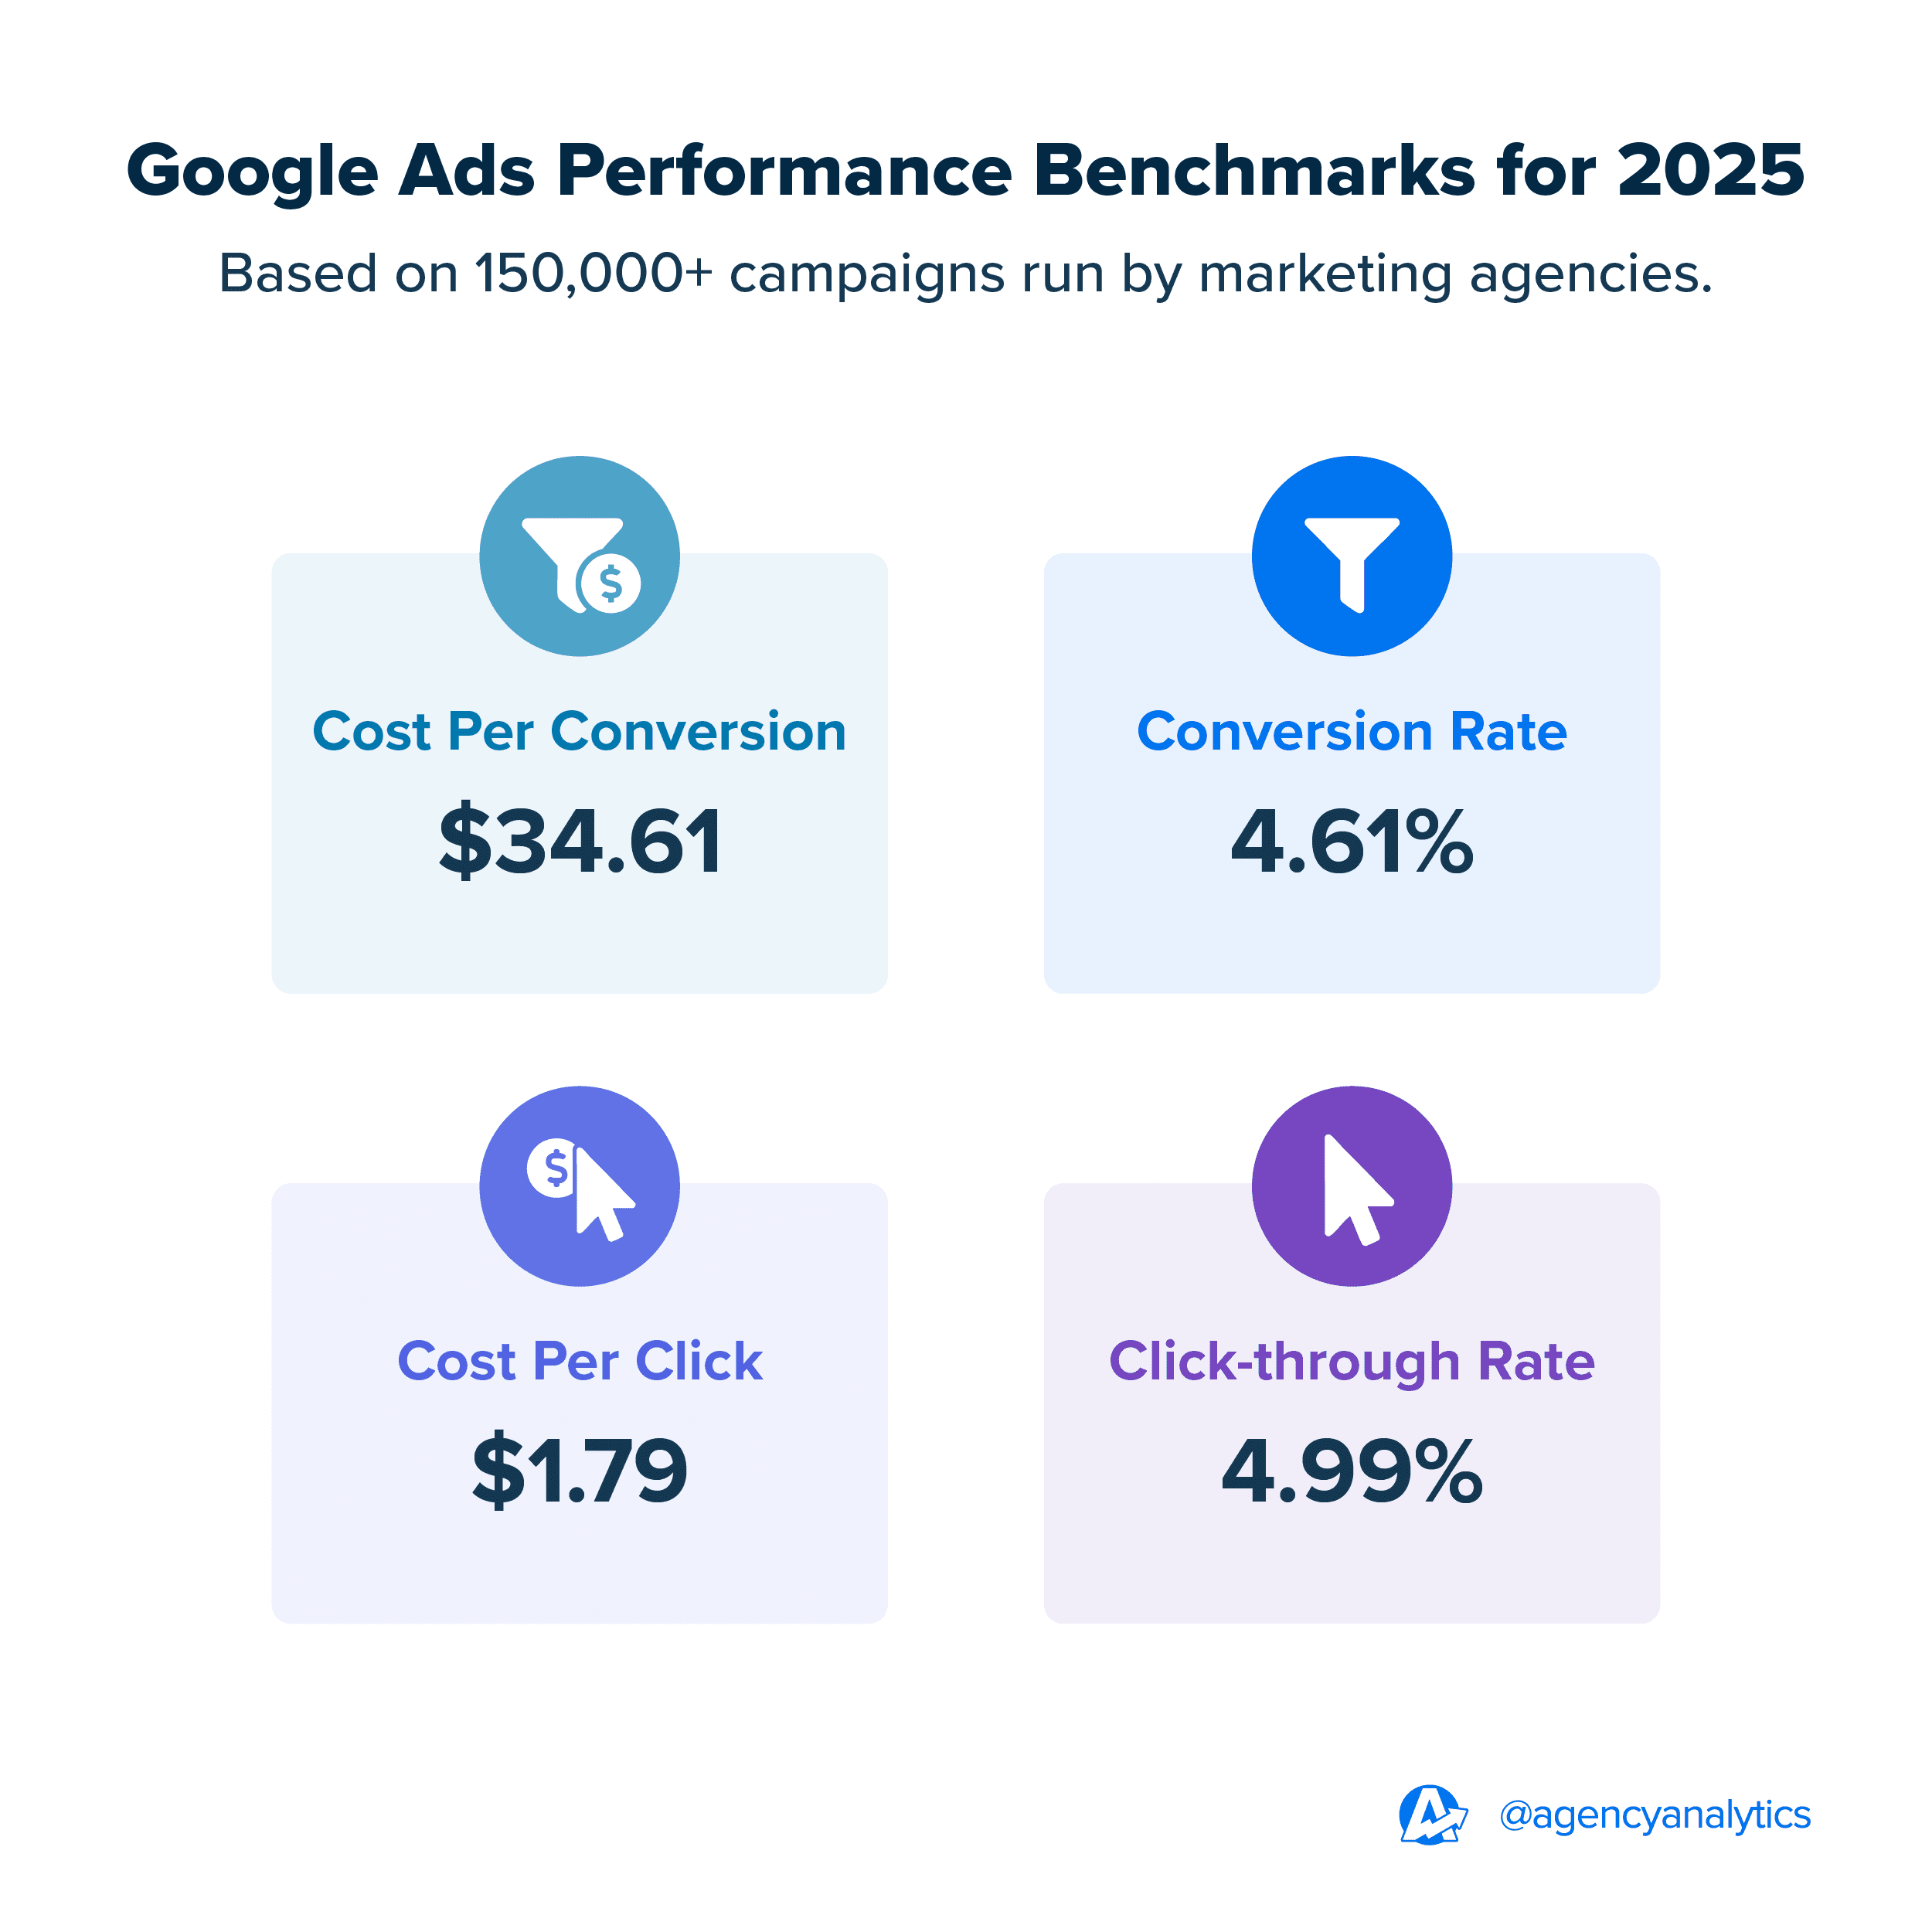
For quick reference, here are some handy Google Ads performance benchmarks straight from the AgencyAnalytics platform. They’re based on first-party data from 7,000+ agencies primarily located in the US, Canada, Australia, the UK, and New Zealand.
Here are some ways to interpret these Google Ads benchmarks:
Knowing that the median conversion rate is 4.61% gives a solid target to aim for—or exceed—when optimizing campaigns. It’s a clear benchmark that helps agencies identify whether their ads are converting effectively or if there’s room to refine their approach.
Similarly, a median cost per conversion of $34.61 provides a baseline to evaluate efficiency, guiding agencies in budget allocation and ROI improvements.
With a median CTR of 4.99%, you’ll have a reliable way to assess how well ads are capturing attention. This makes it easier to adjust messaging or creative and improve ad engagements.
Understanding the median cost per click (CPC) of $1.79 ensures you’re driving traffic at a competitive rate without overspending.
Plus, including these benchmarks in campaign reports reassures clients that their budgets are being invested wisely. Got a CTR above 5%? Celebrate that win with your client. Is your CPC lower than $1.79? Show them how much value they’re getting. And if a conversion rate needs work, benchmarks provide a clear starting point to tweak the strategy.
These numbers aren’t set in stone, either. They change by industry, season, and even campaign type. For example, an ecommerce advertiser’s shopping ads may have different CTRs than B2B search campaigns. That’s why it’s critical to compare results against the right peer group, not just the overall average.
Summary & key takeaways
Google Ads has a ton of metrics, and it could get overwhelming to try to track them all. By focusing on the most important ones, you’ll ensure that client campaigns are performing well and achieving the set goals.
By monitoring these 15 critical Google Ads metrics, your agency will be able to quickly adjust campaigns, bids, and ads to maximize their effectiveness. This will make it much easier to report on your successes to clients, quickly and easily. Instead of toggling between multiple Google Ads accounts or wrestling with a complex interface, use a platform like AgencyAnalytics to:
Centralize data: Pull all metrics into a single, easy-to-read Google Ads dashboard so you can skip logging into multiple accounts.
Track all PPC campaigns in one place: Monitor Google Ads data alongside metrics from Bing Ads, Facebook Ads, and 80+ platforms, all from one central hub.
Get smarter with AI-powered insights: Quickly generate instant insights about a client’s PPC performance–even generate an executive summary with top takeaways!
Benchmark against industry standards: Show clients how their campaigns compare to competitors, and identify where improvements should be made.
Access pre-built templates: Save hours by using a fully customizable Google Ads report template, which is easy to replicate across clients.
AgencyAnalytics report templates have significantly reduced the time required to create reports for our clients by 5X. After integrating Google Ads, Google Search Console, or any other of the dozens of platforms that connect with AgencyAnalytics, you can create a report in less than a minute that's ready to send to a client right away.
Graham Lumley, Director of Growth Marketing, Blackhawk
With the right reporting solution, you’ll spend less time buried in spreadsheets and more time delivering impactful results. Ready to try this Google Ads reporting tool for yourself? Explore AgencyAnalytics today, free for 14 days.
Curious about our other handy templates? Check out our most popular options below.

Written by
Paul Stainton is a digital marketing leader with extensive experience creating brand value through digital transformation, eCommerce strategies, brand strategy, and go-to-market execution.
Read more posts by Paul StaintonSee how 7,000+ marketing agencies help clients win
Free 14-day trial. No credit card required.


