Table of Contents
QUICK SUMMARY:
Google Ads benchmarks provide essential data for evaluating campaign performance and guiding optimization efforts. These metrics—such as cost per click, conversion rates, and click-through rates—offer insights into industry-specific trends. This guide, informed by data from 150,000 campaigns, equips marketers with 2025 benchmarks to refine strategies, optimize budgets, and improve results.
Success in Google Ads campaigns doesn’t happen by chance. It’s all about using data to sharpen your strategy and guide decisions. That’s where Google Ads benchmarks come in. Think of them as a GPS for your campaigns, helping you spot opportunities for improvement and figure out when you’re hitting it out of the park or need to switch gears.
Benchmarks show how results vary across industries, telling the story behind every click, conversion, and dollar spent. For agencies, understanding these numbers is key to assessing and improving your performance.
This guide breaks down the most important benchmarks, like what counts as a reasonable cost per conversion and why click-through rates might look very different in ecommerce compared to professional services.
And here’s an important note: these Google Ads industry benchmarks are the averages achieved by professional marketing agencies, often different from the benchmarks you might see for all advertisers out there.
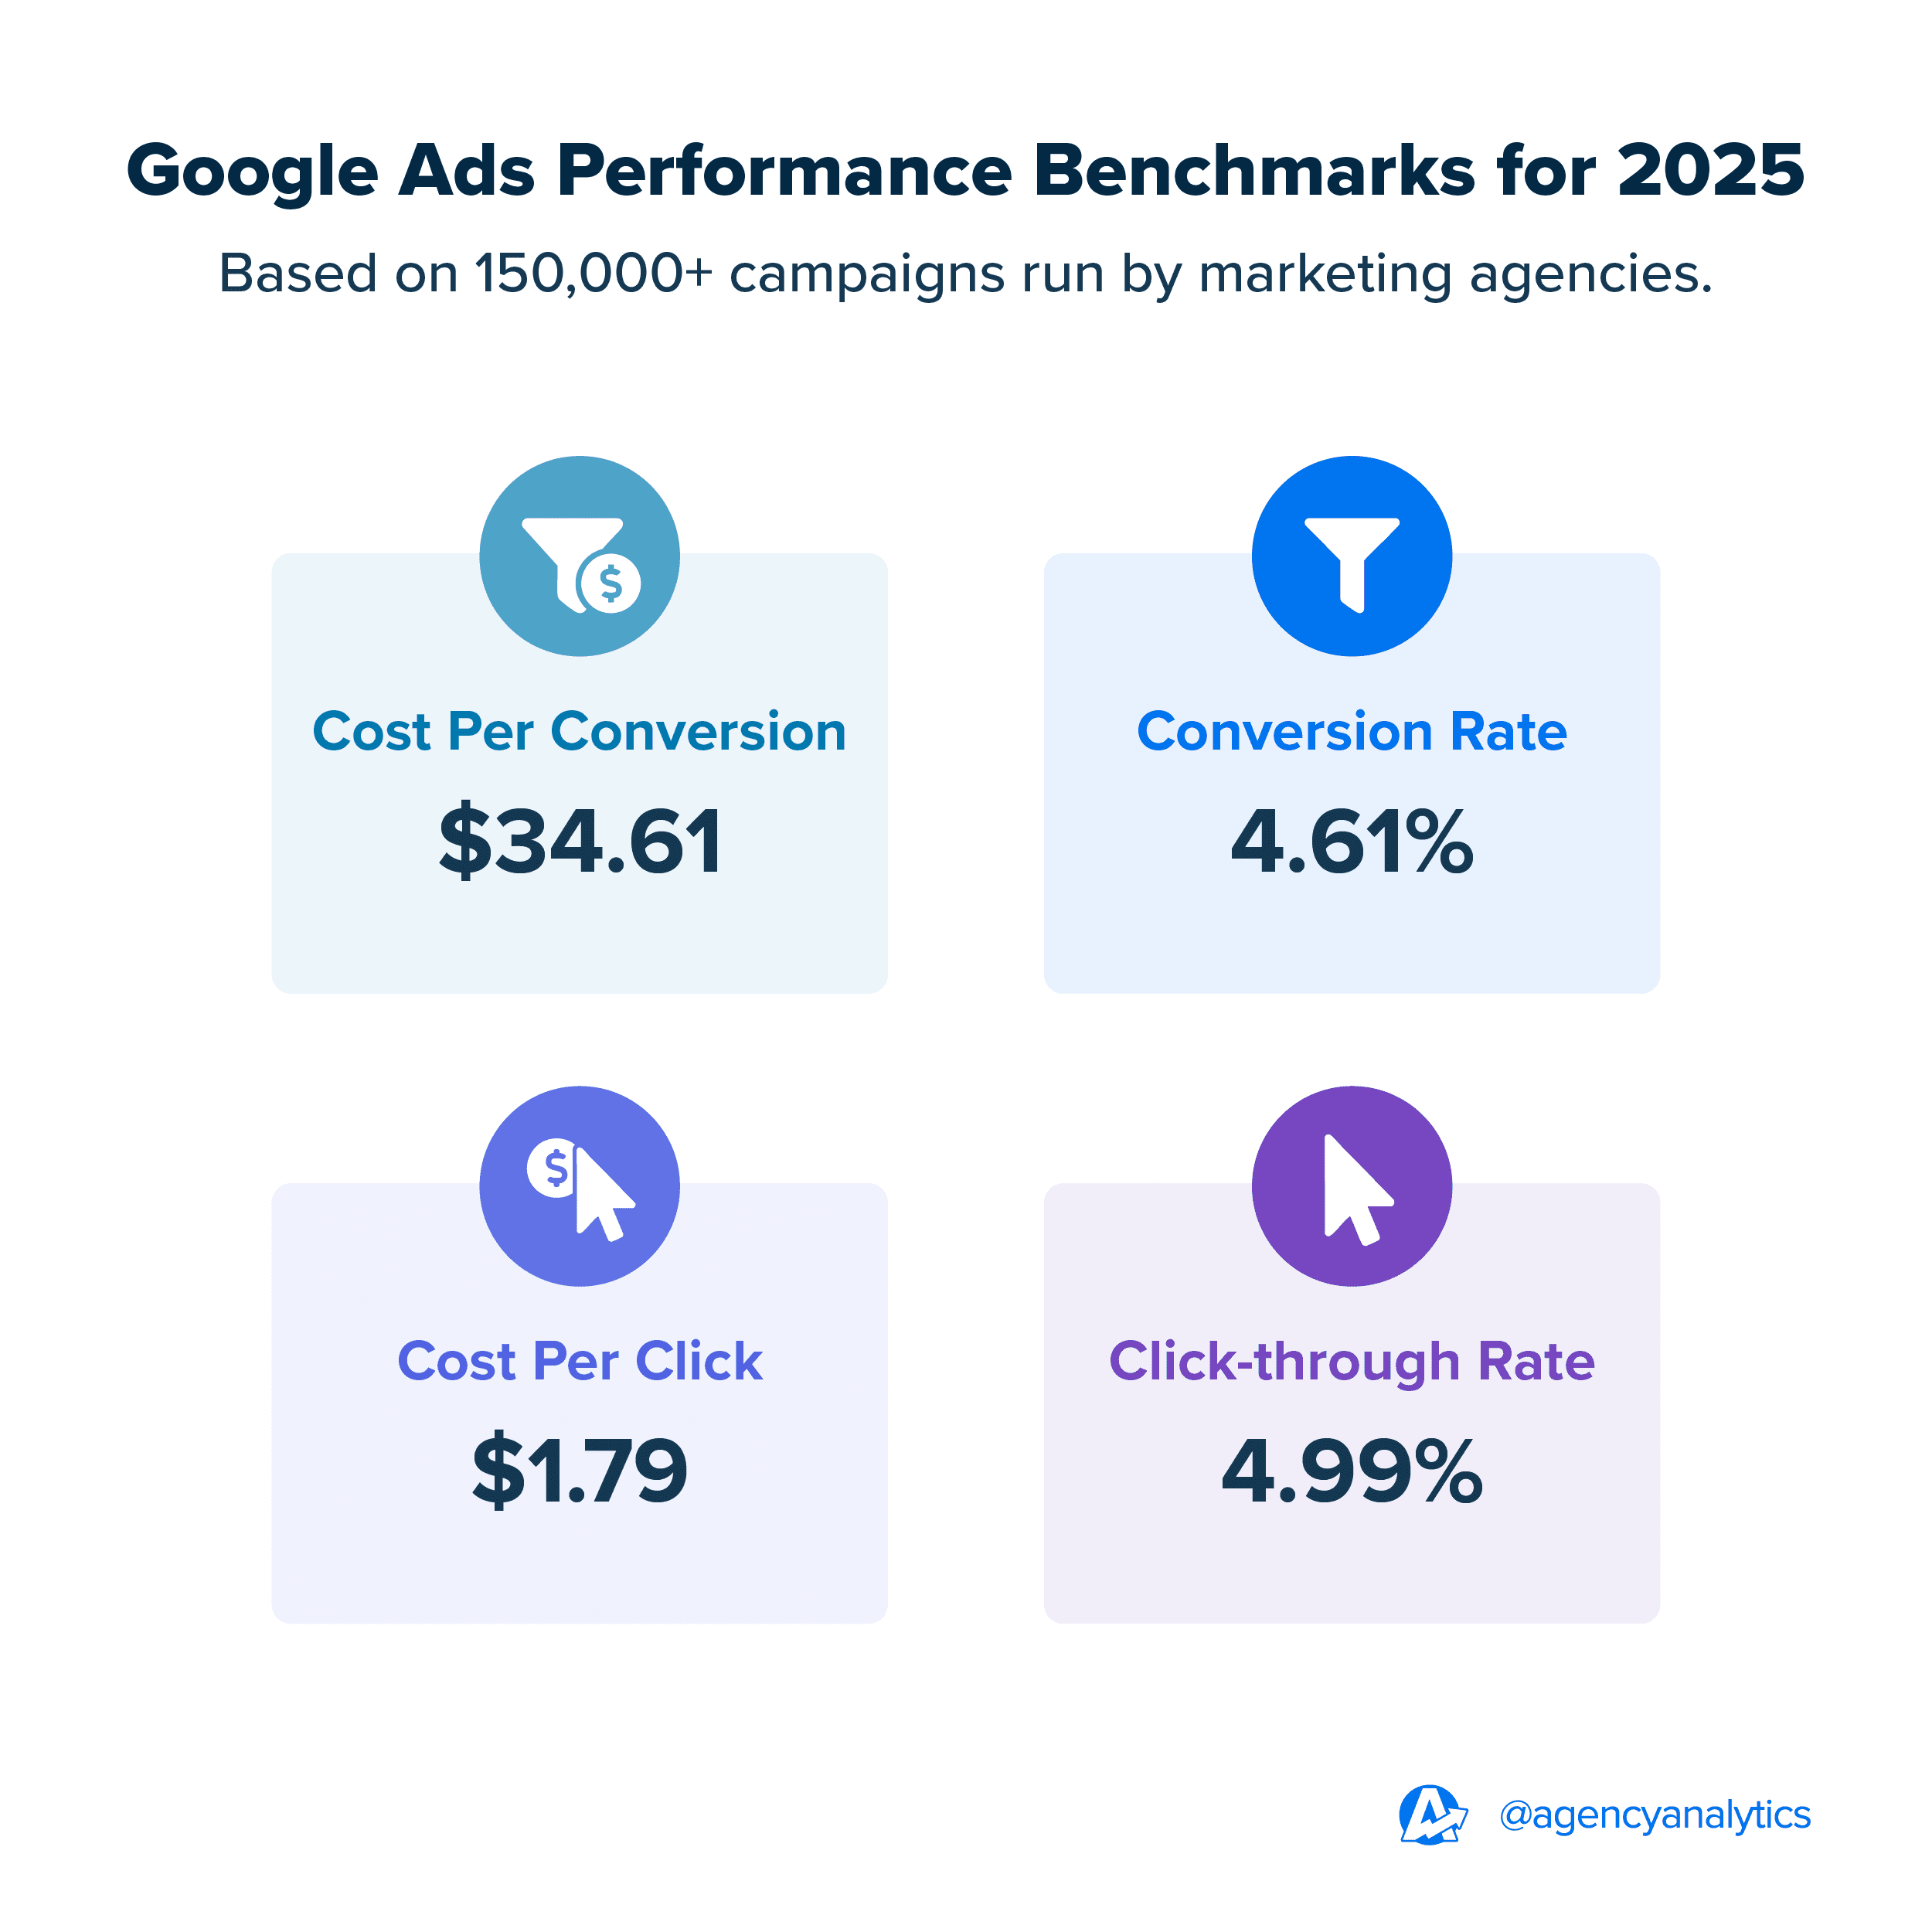
Here’s a sneak peek at where some of these benchmarks stand:
With so much on the line—client budgets, account performance, and maintaining a competitive edge—having reliable, industry-specific metrics to measure against brings clarity and focus to every campaign optimization effort.
This article breaks down key benchmarks like cost per click, conversion rate, and click-through rate based on over 150,000 campaigns run by 7,000 professional marketing agencies. Use this data to navigate campaign performance confidently and elevate your client’s advertising strategy.
Let’s get into what matters most: using benchmarks to level up your campaign planning and optimization approach.
Why Google Ads Industry Benchmarks Matter
Benchmarks provide data-driven context for evaluating campaign performance. They offer a clear reference point to measure how client campaigns perform against industry standards, highlighting successes as well as areas for improvement.
Whether you’re running search or display campaigns, benchmarks highlight what's working and where there’s room to grow. Use metrics like average conversion rates, CPC, and click-through rates to optimize performance, stay competitive and make adjustments when necessary.
Key Google Ads Metrics and Why They Matter
By breaking down these metrics within the context of industry norms, you'll set clear goals for search marketing campaigns, fine-tune strategies, and maximize client results.
Let’s break down the most important metrics that reflect how client campaigns are doing:
Average Cost Per Conversion: This metric ties directly to running a cost effective advertising strategy and improving client ROI, showing how much it costs to achieve a desired action.
Average Conversion Rate: This shows how many clicks turn into valuable actions—like purchases, form fills, or phone calls.
Average CPC (Cost Per Click): Lower CPCs mean more clicks for the same spend, which is (almost) always a win for your clients.
Average Click-through Rate (CTR): A low average click-through rate on search advertising campaigns could mean the ad isn’t grabbing attention, while a high CTR signals it’s hitting the mark.
Each of these metrics provides actionable insights, allowing campaigns to be assessed with valuable and relevant context.
Why Benchmarks Keep Clients Happy
Clients want to know their campaigns are on track, and benchmarks make it easy to prove. Showing how a campaign compares to industry standards builds trust and keeps clients in the loop. For example:
If a search campaign beats the average conversion rate, it’s something to celebrate with your client.
If CPCs drop below the industry average, it’s proof you’re stretching their budget further.
If the CTR is low, benchmarks provide a starting point to explain the improvement plan.
Using benchmarks in client conversations shows you’ve got their back and sets the stage for a strong, long-term partnership.
How Benchmarks Help Improve Campaigns
Benchmarks are used to measure progress and also guide it. Here’s how:
Fine-tuning Ads: If the average click-through rate isn’t cutting it compared to industry standards, it’s time to refresh the ad copy or try a new call to action.
Smarter Budget Use: Comparing average spend helps decide whether to adjust budgets or shift spend between campaigns.
Focusing on What Works: A high average conversion rate on one campaign signals where to double down and prioritize client budgets.
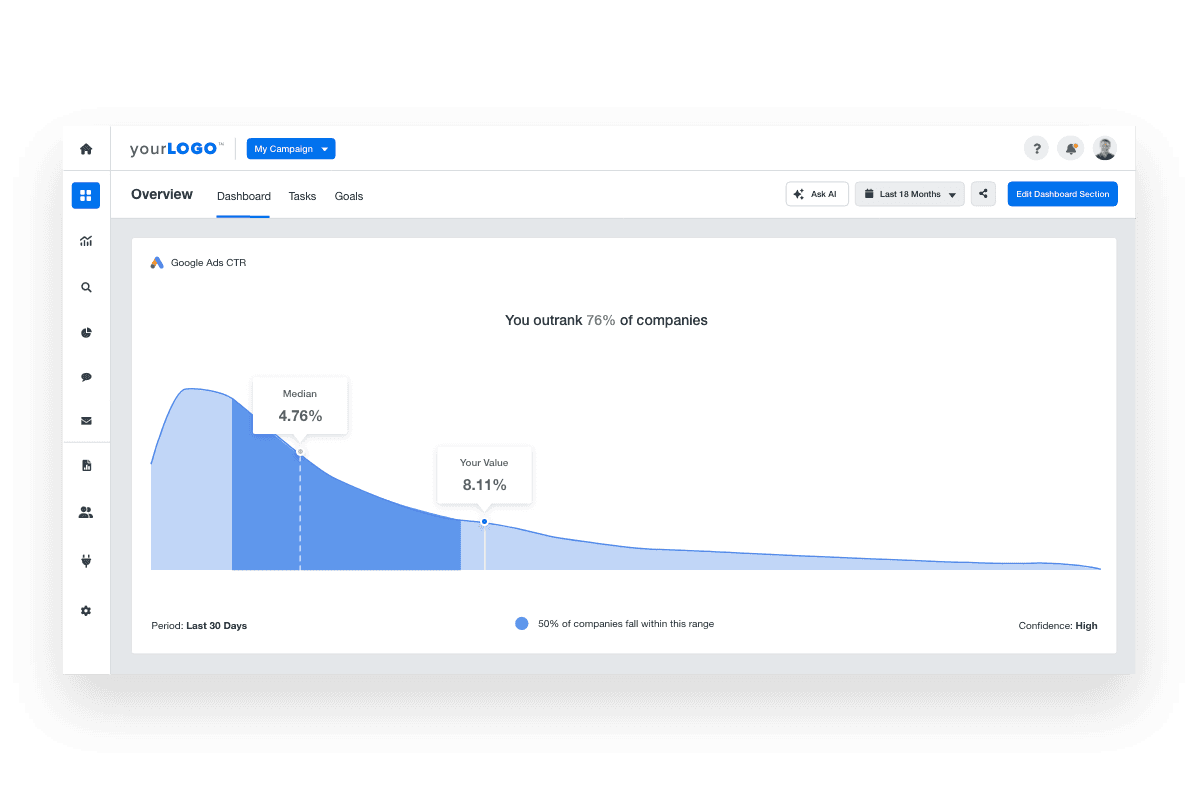
Want to show off how well your agency exceeds these industry standards? Automatically include benchmarks in agency dashboards and client reports. Get started with a 14-day free trial.
The Value of Industry Benchmarks
Industry benchmarks help you set meaningful goals, spot gaps, and zero in on what’s working. Whether you’re managing search, video, or display ads, benchmarks bring clarity to decision-making by aligning expectations with reality.
That said, benchmarks are only as useful as your ability to interpret them. Understanding the difference between averages and medians, avoiding common pitfalls, and relying on trusted sources like AgencyAnalytics performance insights turn generic data into a competitive advantage.
Average vs. Median Values: Which are Better?
When analyzing Google Ads benchmarks, it’s essential to understand the difference between average and median values.
Average Values: An average is calculated by adding all the data points and dividing by the total number of entries. While averages are helpful, they can be skewed by extreme outliers. For example, a single high-spending campaign could distort an industry average CTR, average CPC or average conversion rate, making the number less representative of typical performance.
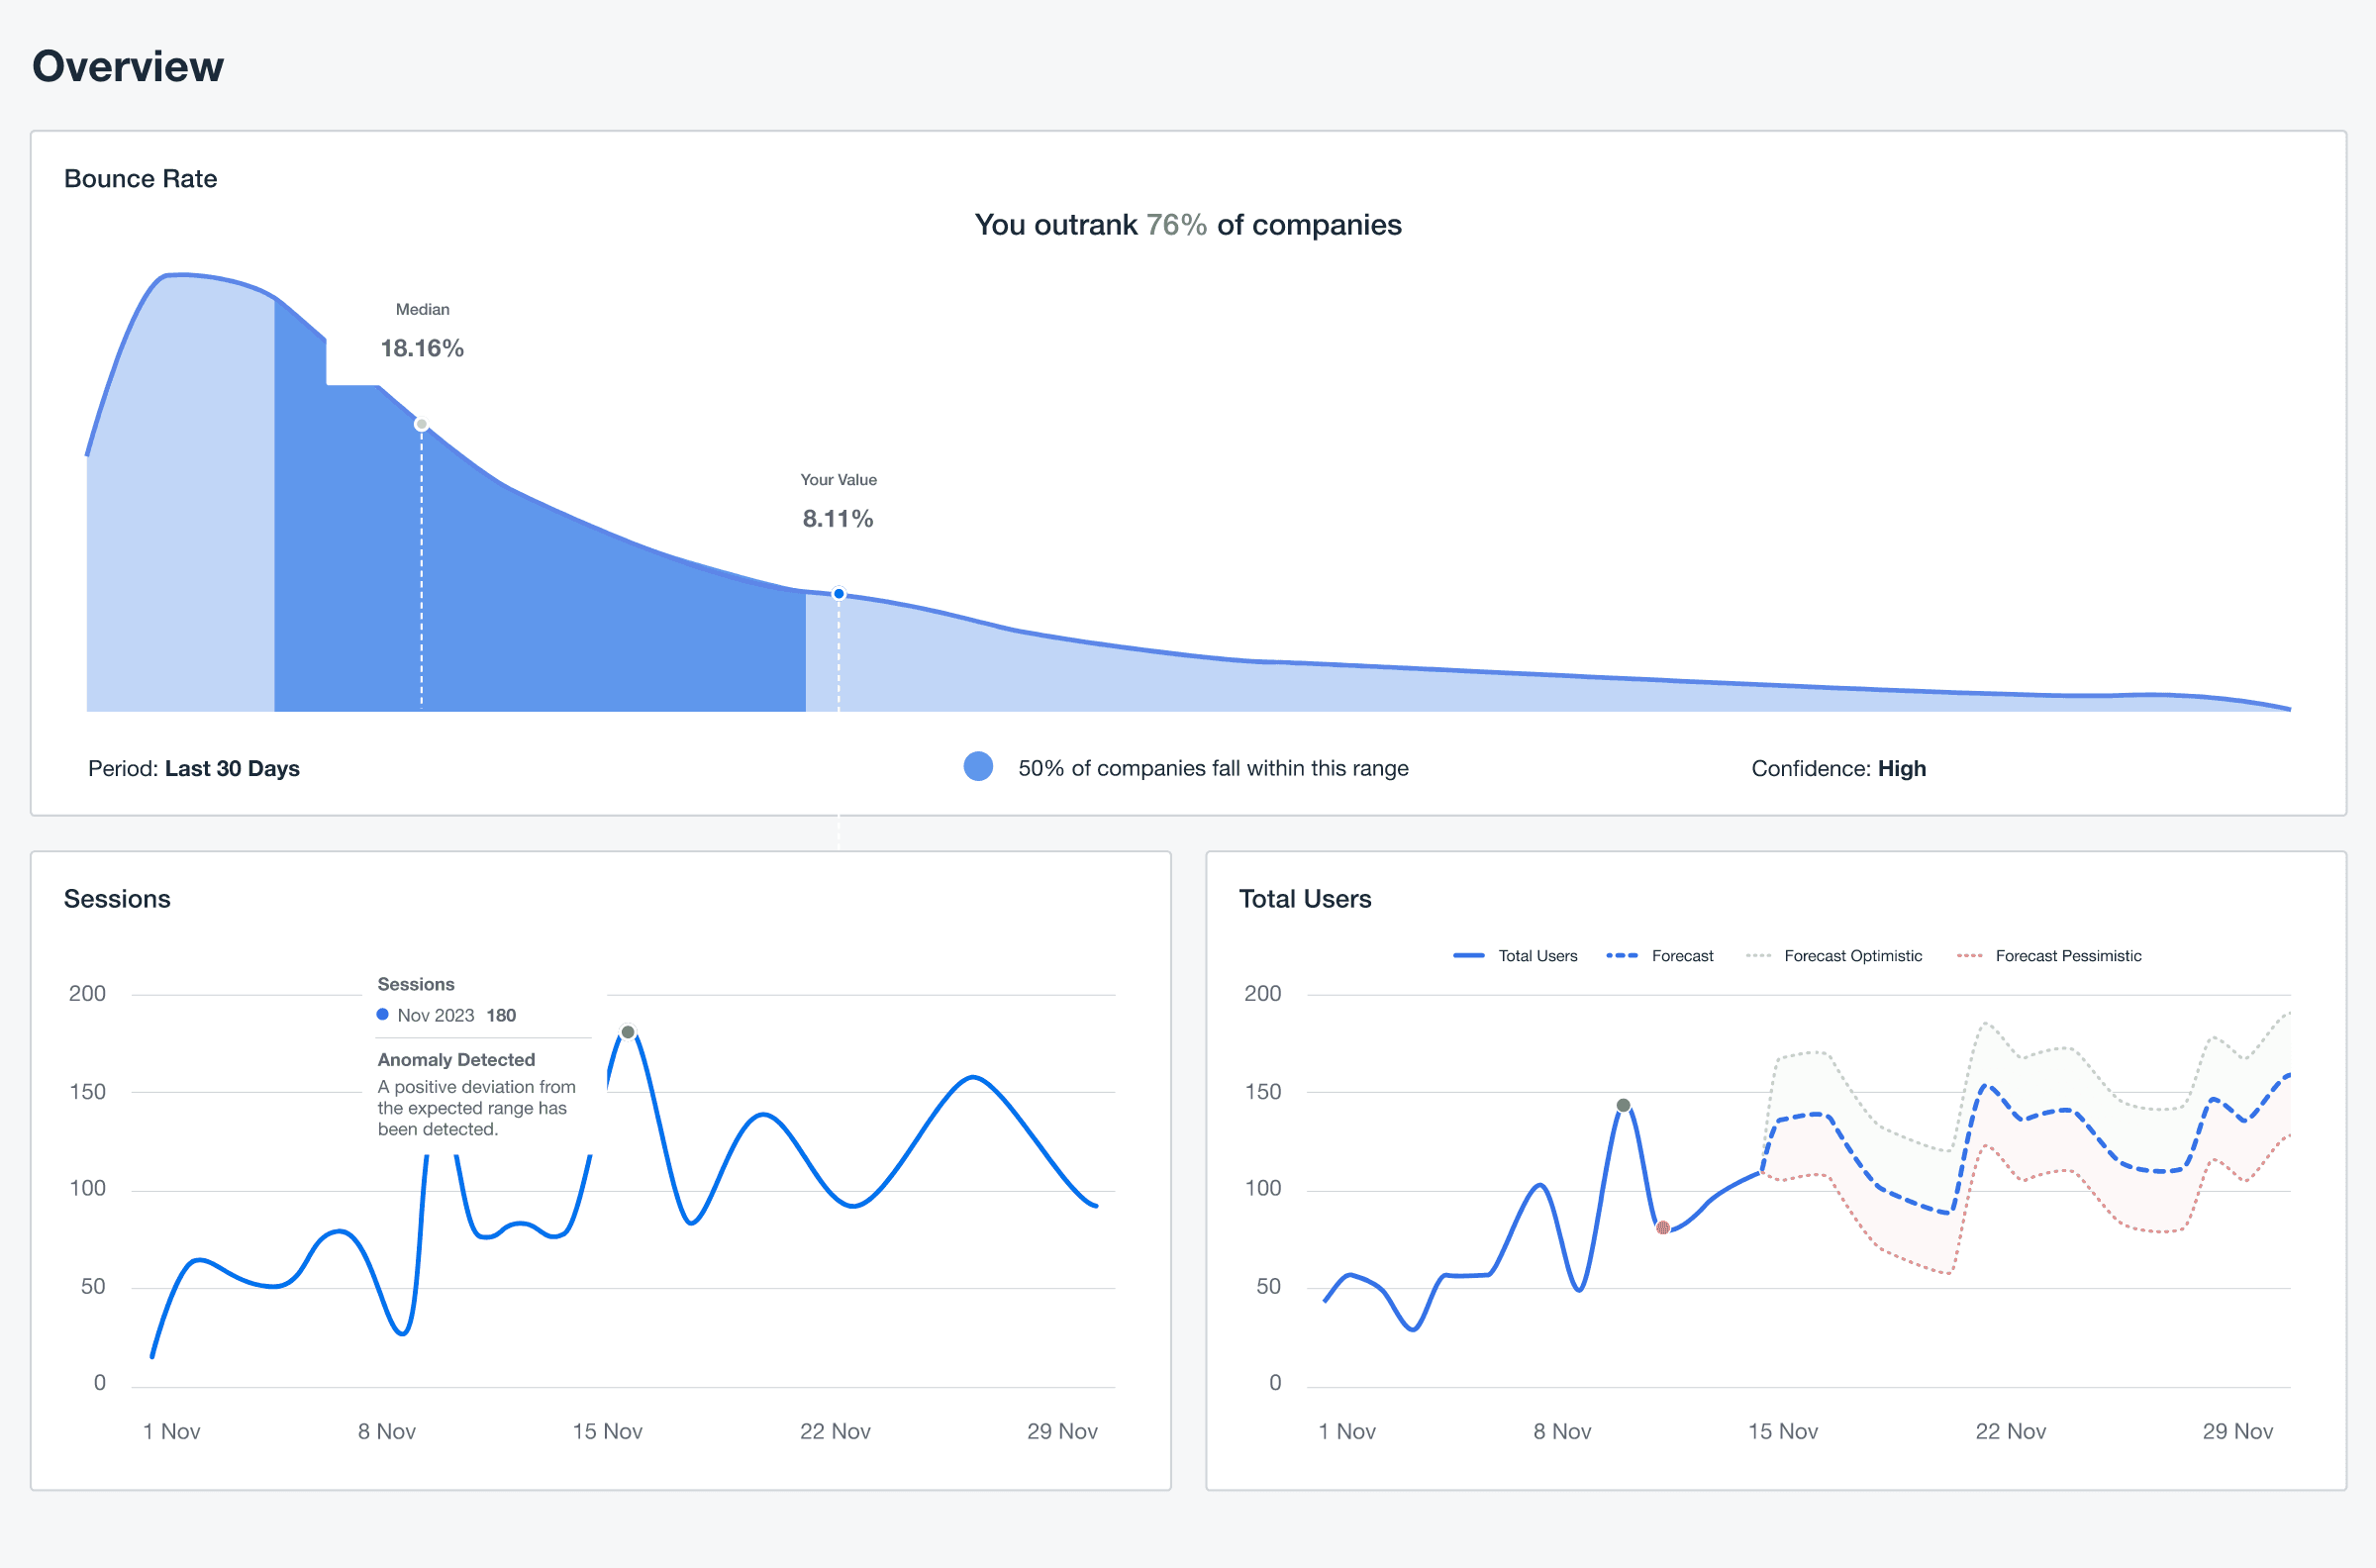
Median Values: A median represents the middle value in a dataset, with half the data points above and half below. This makes it a better indicator of the typical expected performance, especially in datasets with wide variances.
At AgencyAnalytics, benchmarks rely on median values to accurately reflect what’s achievable for most agencies. While many users instinctively seek averages, medians give a clearer picture by filtering out extreme data points that might not align with their clients’ experiences.
Common Misconceptions About Google Ads Benchmarks
Benchmarks are often misunderstood, leading to unrealistic expectations or improper comparisons. Here are some common myths to avoid:
Myth #1: Benchmarks Guarantee Repeatable Results: Benchmarks offer context, not promises. Meeting or exceeding the industry average CPA or other key benchmarks depends on factors like ad quality, audience targeting, and competition.
Myth # 2: Benchmarks Stay the Same Across Industries: Benchmarks like the average click-through rate or average CPC differ dramatically depending on the client’s industry and campaign type.
Myth #3: Benchmarks Don’t Change Over Time: Benchmarks will fluctuate based on market demands, seasonality, and competition. That’s why it’s important to tap into a search advertising benchmarks report that provides up-to-date benchmark data.
Clearing up these misconceptions ensures benchmarks are used as context and improvement tools, not just performance targets.
How Agencies Use Benchmarks To Improve Campaigns
For many agencies, the campaign process starts with setting realistic goals. Metrics like average conversion rate or average CPC provide a foundation for defining success. Instead of aiming blindly, agencies use these benchmarks to establish clear, achievable targets that reflect industry standards and the client’s unique position.
Set performance goals for clients using proven industry benchmarks as your guide. The goal and budget tracking feature measures progress, ensures transparency, and demonstrates how your agency is driving results. Start today with a 14-day free trial.
As campaigns run, benchmarks act as a measuring stick to identify weak points. For example, comparing a campaign’s click-through rate to the average click-through rate for similar campaigns quickly spotlights areas that aren’t performing as well as they should.
The same goes for cost per conversion—if it’s higher than benchmark data suggests is typical, it’s a signal to investigate where budgets might be leaking or where optimizations may make a real impact.
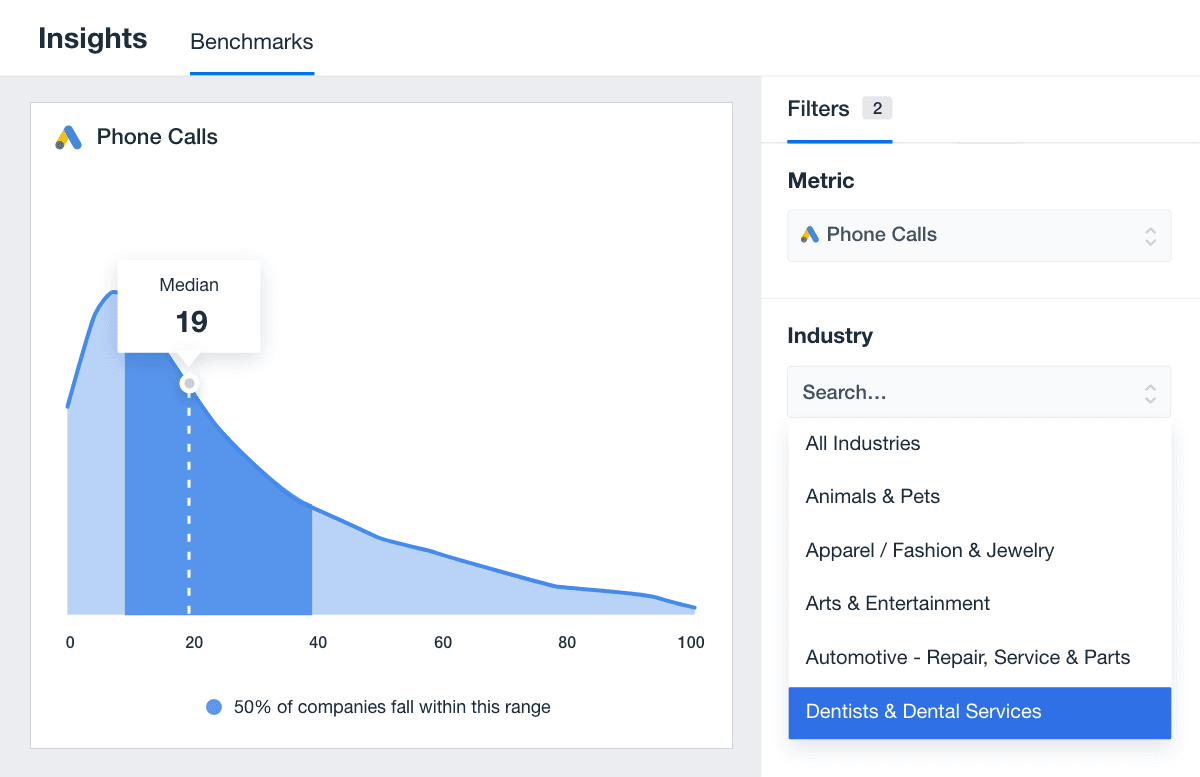
In this section, we break down some of the most commonly used Google Ads benchmarks based on data from over 150,000 digital marketing campaigns.
Google Ads Performance Benchmarks for 2025
The following outlines the current benchmarks for some of the most commonly reported on Google Ads Metrics. This data is based on over 150,000 campaigns run by professional marketing agencies using the AgencyAnalytics client reporting platform for their paid search analytics.
Average Google Ads Monthly Spend
The median monthly spend for Google Ads campaigns is $1,057.45, a solid starting point when planning budgets for new clients.
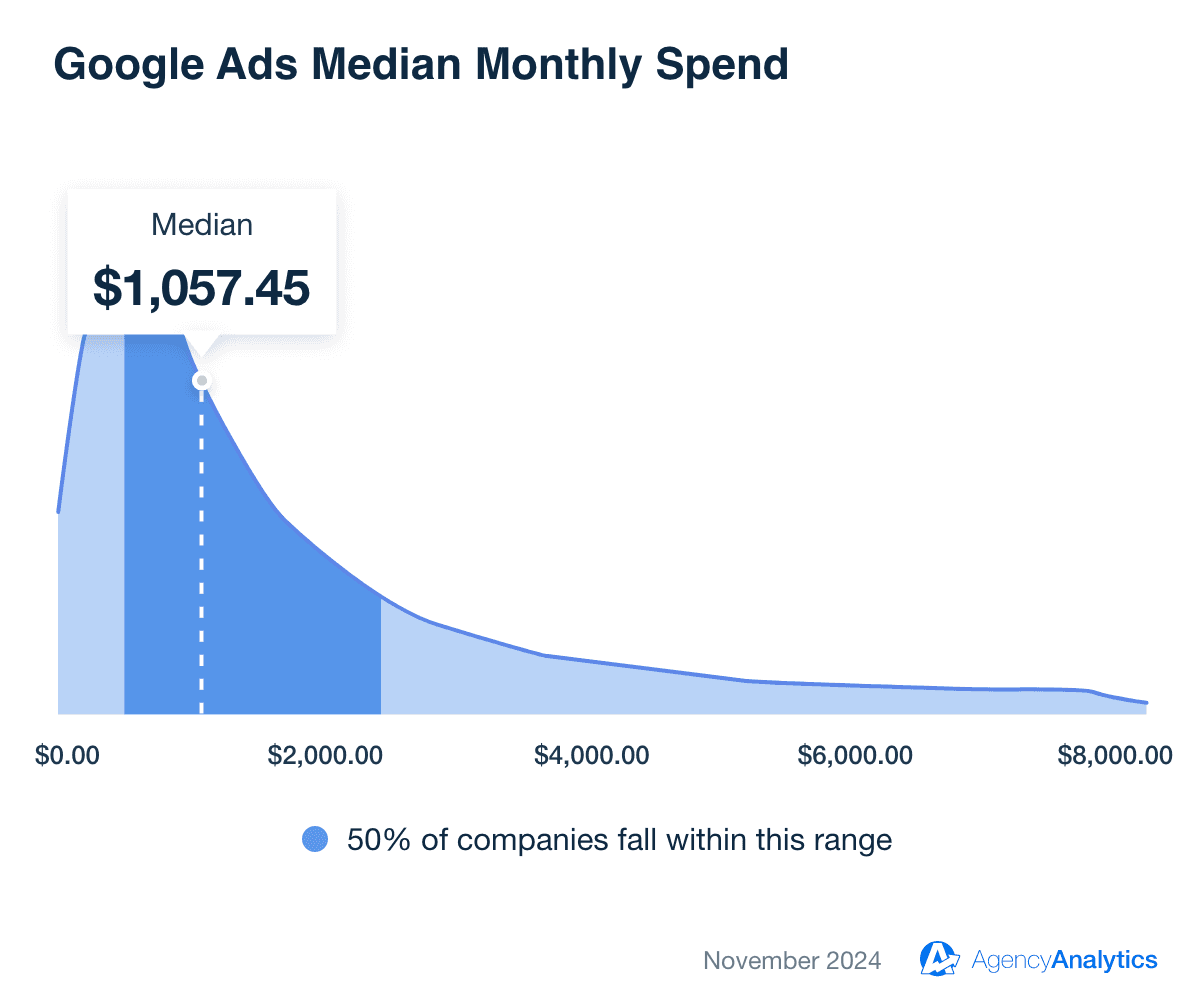
Remember that this data is based on campaigns managed by marketing agencies, typically for small—to mid-size businesses. Therefore, it doesn’t include massive in-house campaigns run by big retailers, where monthly budgets often hit hundreds of thousands—or even millions. For most clients, these benchmarks offer a practical and realistic guide for planning their ad spend.
Of course, Google Ads campaign spending varies a lot depending on the industry, and understanding those differences is key to setting realistic expectations and identifying opportunities where clients are willing to invest more.
Take the Furniture industry, for example. While the median monthly spend is above the median value, sitting at nearly $1,500 per month, some campaigns in this category stretch as high as $18,000 per month.
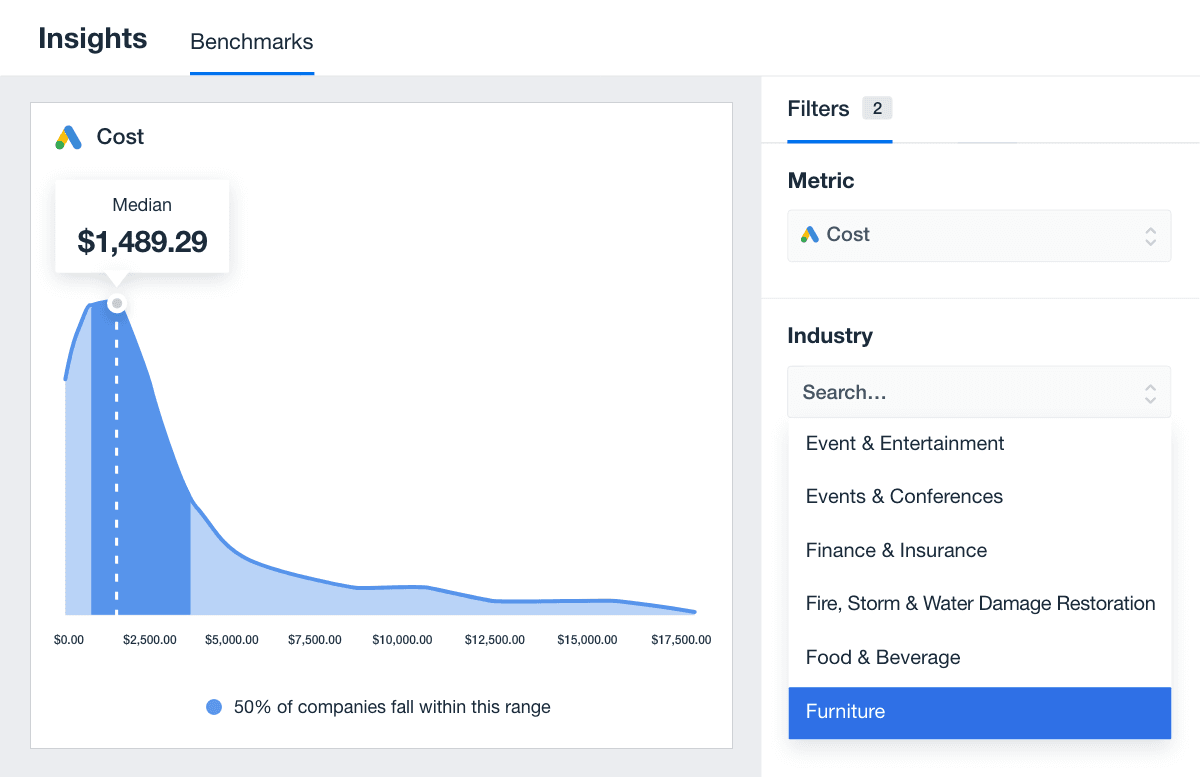
If your agency operates on a percentage-of-spend model, it’s good to know that this category has a potential upside well above the industry average.
It’s also important to note that some industries will experience seasonal shifts in spend and performance. For example, the average spend in the wedding industry category was $797.02 in November, but come spring—peak wedding season—that number is likely to climb significantly.
Average Monthly Google Ads Spend by Industry
Industry | Median Google Ads Spend by Industry |
|---|---|
Advertising & Marketing | $786.57 |
Agriculture & Farming | $876.34 |
Animals & Pets | $1,019.93 |
Apparel & Fashion | $1,479.14 |
Arts & Entertainment | $968.05 |
Attorneys & Legal Services | $1,637.17 |
Automotive Parts & Services | $930.84 |
Beauty & Personal Care | $1,098.58 |
Business Services | $1097.55 |
Dental Services | $1,156.61 |
Education | $1,112.68 |
Electrical Services | $838.79 |
Finance & Insurance | $934.87 |
Food & Beverage | $1,001.47 |
Furniture | $1,489.29 |
Health & Fitness | $1,179.48 |
Home Improvement | $1,206.36 |
HVAC Repair | $1,419.35 |
Non Profit | $1,769.62 |
Plumbing | $1,198.82 |
Real Estate | $986.33 |
Restaurants | $679.78 |
Roofing | $2,219.40 |
Sports & Recreation | $1,144.63 |
Storage & Moving | $692.76 |
Travel | $847.73 |
Weddings & Events | $797.02 |
Average Google Ads Cost Per Conversion
The median cost per conversion for Google Ads campaigns run by marketing agencies is $34.61. This number is a helpful baseline for evaluating campaign efficiency, but the reality is far more nuanced.
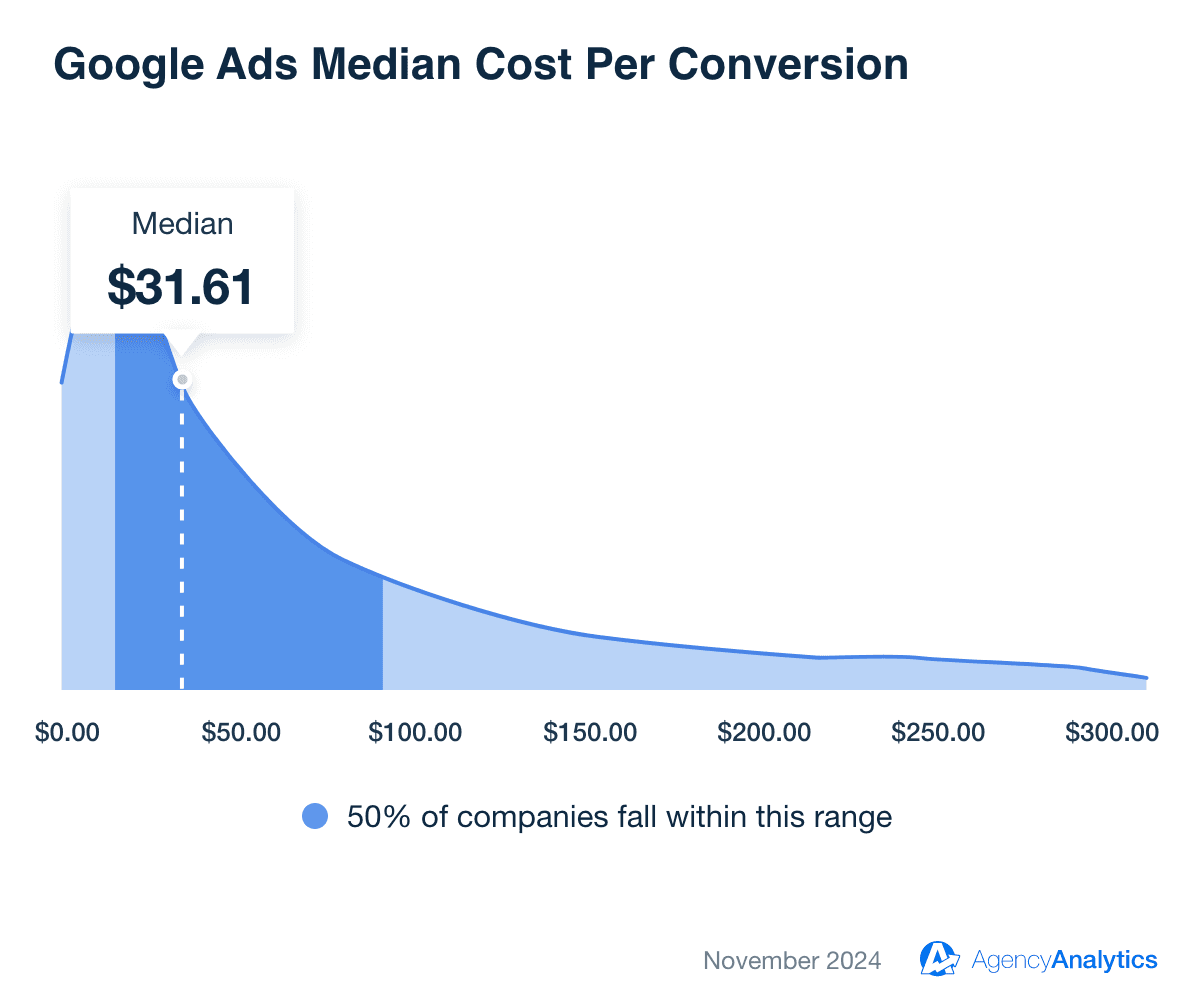
Different industries experience vastly different median costs, driven by competition, audience targeting, conversion type, and the nature of the service or product being advertised.
For instance, industries like Food & Beverage, with a median cost per conversion of $15.94, typically benefit from shorter decision-making cycles and lower competition for local search ads.
Conversely, sectors such as Attorneys and Legal Services see median costs climb to $61.89 due to higher client acquisition values and fierce bidding competition on search engines. In more specialized areas like Roofing, the median jumps dramatically to $141.06, highlighting how niche markets and high-margin services drive up costs.
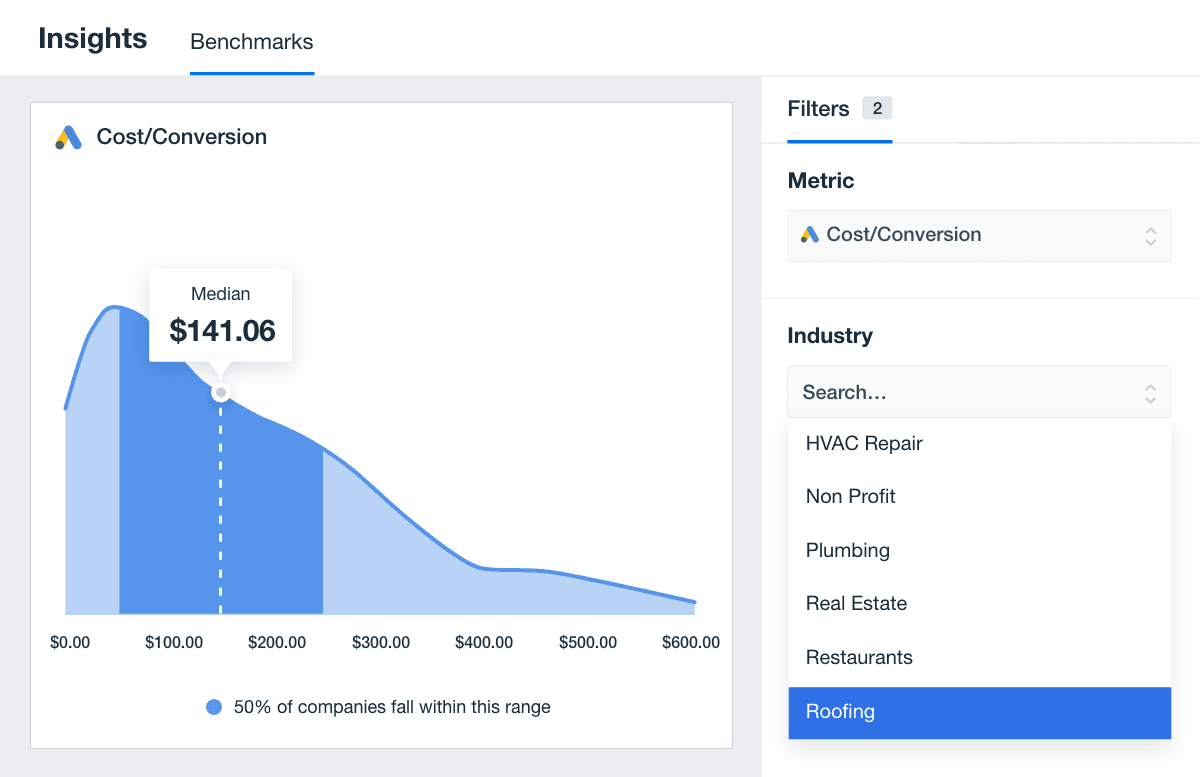
These differences underline the importance of tailoring a Google Ads strategy to the industry. Understanding cost-per-conversion benchmarks enables marketing agencies to evaluate performance against realistic expectations.
Average Google Ads Cost Per Conversion by Industry
Industry | Median Cost Per Conversion |
|---|---|
Advertising & Marketing | $48.73 |
Agriculture & Farming | $21.53 |
Animals & Pets | $20.61 |
Apparel & Fashion | $19.86 |
Arts & Entertainment | $20.35 |
Attorneys & Legal Services | $61.89 |
Automotive Parts & Services | $28.66 |
Beauty & Personal Care | $23.89 |
Business Services | $74.12 |
Dental Services | $43.88 |
Education | $28.63 |
Electrical Services | $45.49 |
Finance & Insurance | $103.10 |
Food & Beverage | $15.94 |
Furniture | $30.19 |
Health & Fitness | $36.72 |
Home Improvement | $50.20 |
HVAC Repair | $64.08 |
Non Profit | $25.83 |
Plumbing | $55.29 |
Real Estate | $36.18 |
Restaurants | $7.52 |
Roofing | $141.06 |
Sports & Recreation | $18.70 |
Storage & Moving | $27.92 |
Travel | $22.55 |
Weddings & Events | $28.38 |
Average Google Ads Average Conversion Rate
Conversion rates reveal how many ad clicks turn interest into action, making them one of the most telling indicators of campaign success. The median conversion rate agencies achieve across all industries is 4.61%, but this number is far from one-size-fits-all.
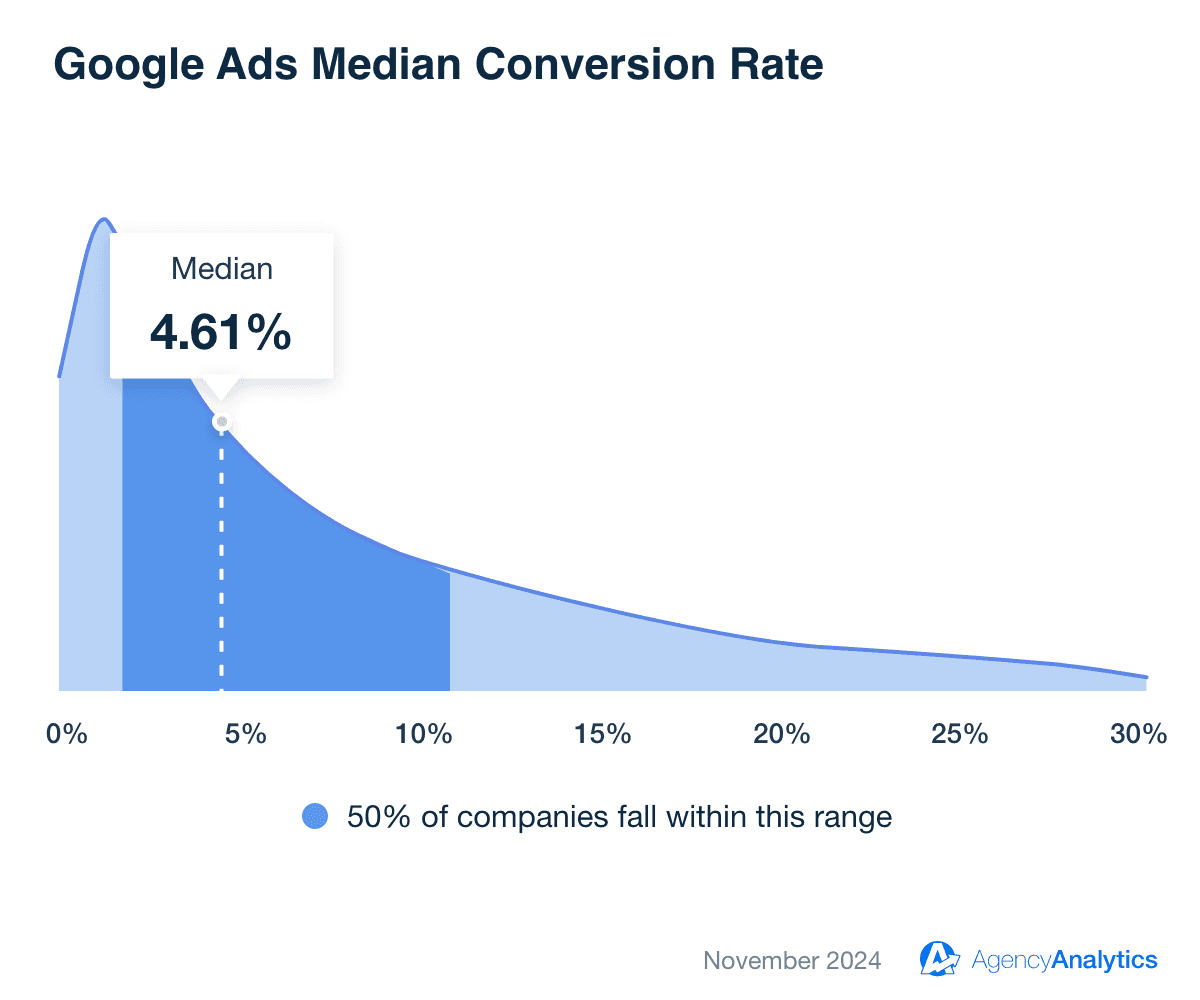
Different industries experience wildly different outcomes, shaped by the urgency of the audience’s needs, the complexity of the purchase decision, and the effectiveness of their landing pages.
So, if you're wondering "What is a good conversion rate for Google Ads?", use the baseline average across all industries of 4.61%, but the reality is much more nuanced.
For example, Dental Services sees a standout median conversion rate of 10.77%, likely due to the high intent of users searching for immediate care.
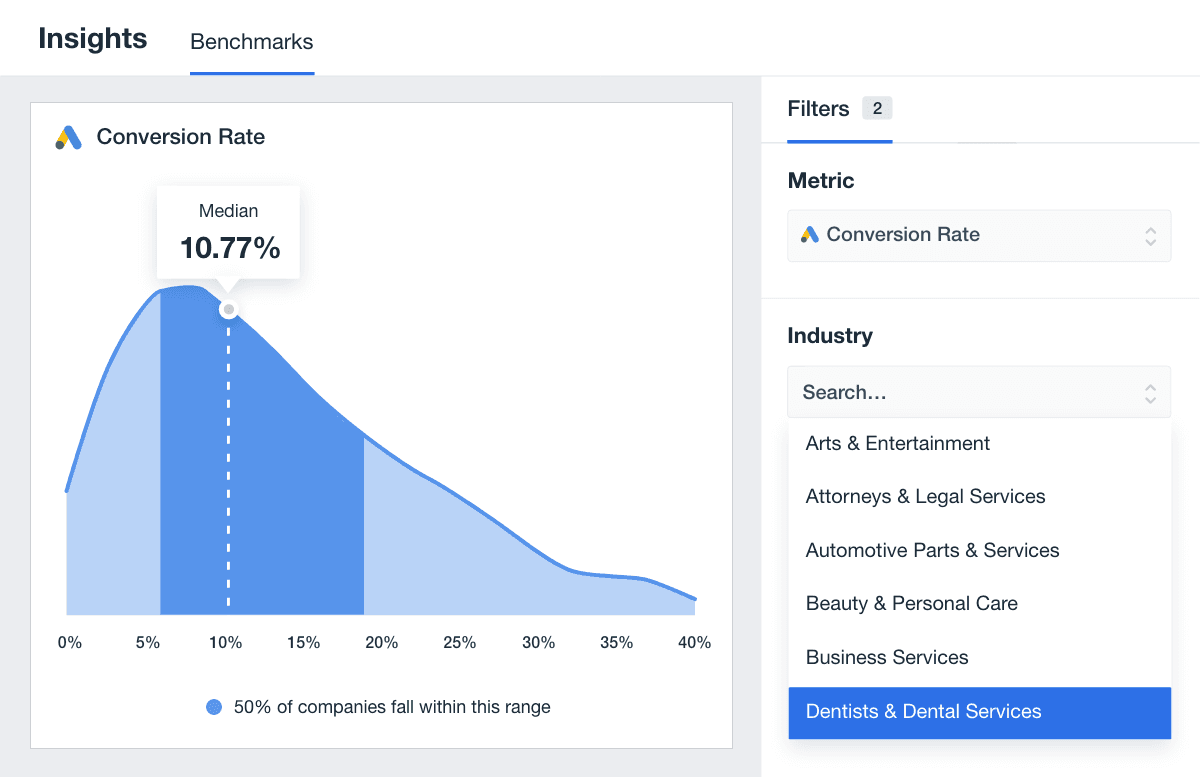
Similarly, Storage & Moving achieves an impressive 10.42%, reflecting the urgency often associated with relocation services. In contrast, industries like Apparel & Fashion, with a median of 2.15%, typically face lower conversion rates as users browse options and take more time to decide.
These differences highlight the importance of tailoring campaigns to the nuances of each industry. Understanding search ads benchmarks like these helps marketing agencies identify opportunities to optimize a Google Ads account, improve targeting, and refine ad spend allocation.
Average Google Ads Conversion Rate by Industry
Industry | Median Conversion Rate |
|---|---|
Advertising & Marketing | 3.33% |
Agriculture & Farming | 2.02% |
Animals & Pets | 5.45% |
Apparel & Fashion | 2.15% |
Arts & Entertainment | 3.34% |
Attorneys & Legal Services | 9.02% |
Automotive Parts & Services | 10.24% |
Beauty & Personal Care | 4.62% |
Business Services | 2.45% |
Dental Services | 10.77% |
Education | 3.59% |
Electrical Services | 7.41% |
Finance & Insurance | 2.87% |
Food & Beverage | 2.97% |
Furniture | 1.82% |
Health & Fitness | 4.33% |
Home Improvement | 3.56% |
HVAC Repair | 6.47% |
Non Profit | 8.24% |
Plumbing | 8.19% |
Real Estate | 3.37% |
Restaurants | 5.04% |
Roofing | 6.67% |
Sports & Recreation | 2.63% |
Storage & Moving | 10.42% |
Travel | 2.49% |
Weddings & Events | 3.87% |
Average Google Ads CPC
Marketing agencies typically see a median average cost per click (CPC) for Google Ads campaigns at $1.79 across all industries. This metric reflects the cost of attracting each visitor to a client’s site and plays a key role in understanding advertising costs and campaign efficiency.
If you are wondering about the concept of median average, which may feel a bit redundant, Google Ads provides Avg. CPC data points across all of an advertiser’s campaigns, and the median value reflects those averaged data points across all campaigns run by the 7,000 marketing agencies using AgencyAnalytics to track and report their campaign success.
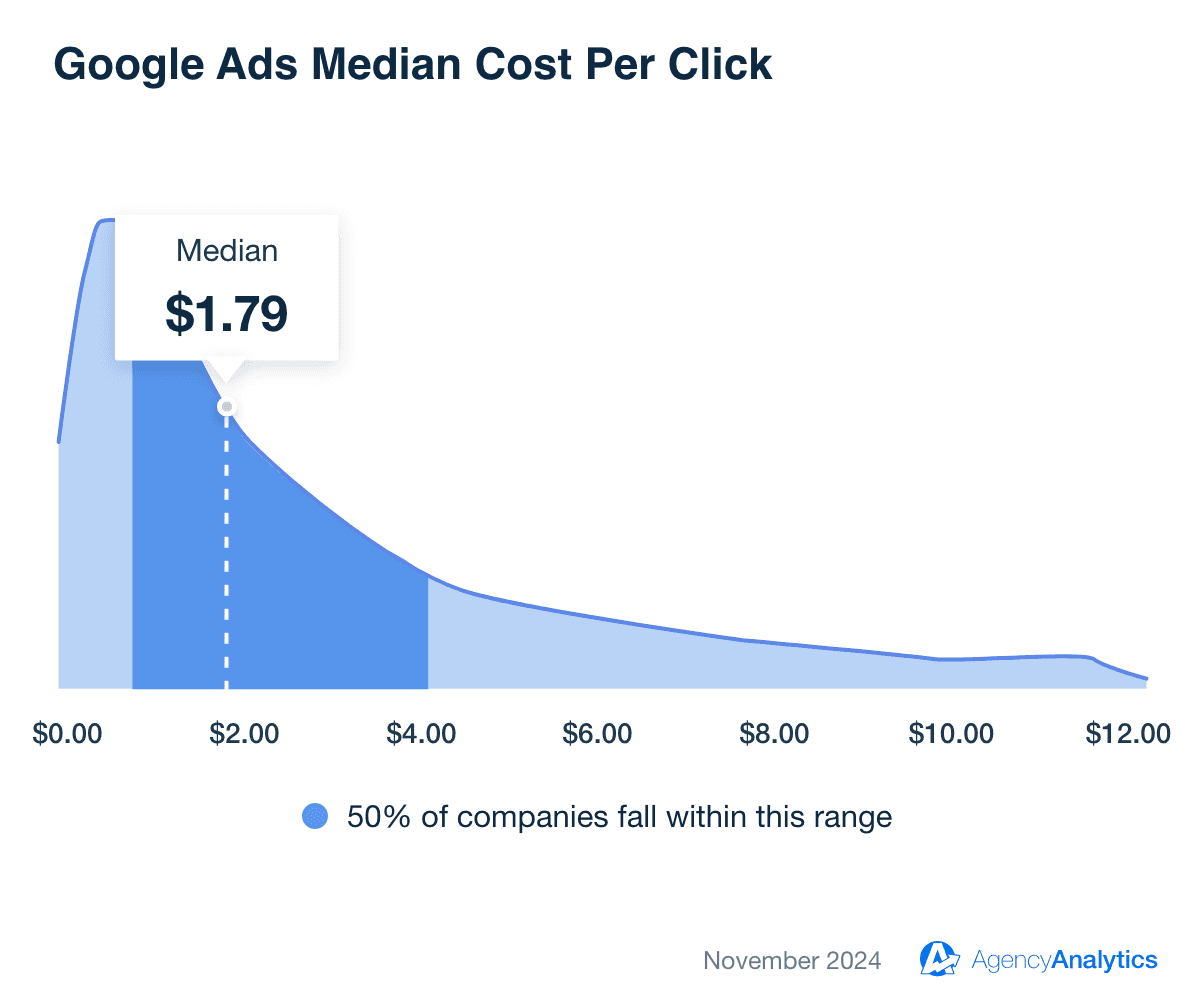
However, CPCs vary widely between industries, often as a multiple or fraction of the median.
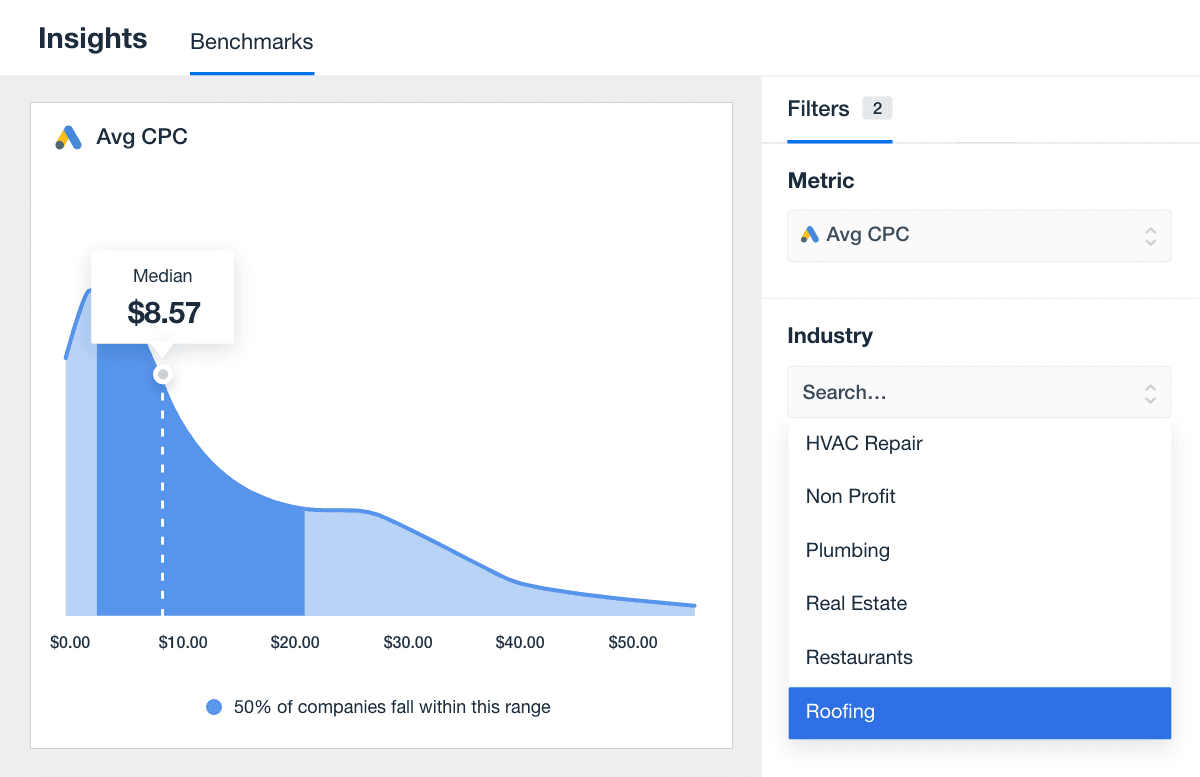
Industries with specialized or high-value services tend to see CPCs far above the median. For example, Roofing, with a median CPC nearly five times the industry average at $8.57, highlights the competitive bidding for keywords in this niche. However, it’s also worth noting that some roofing campaigns pay over $54 per click, demonstrating the potential for even higher advertising costs in ultra-competitive segments.
Similarly, Attorneys & Legal Services, with a median CPC of $4.96 (nearly three times the industry average CPC), may see campaigns willing to pay over $30 per click due to the lifetime value of a single client.
By understanding how an industry’s CPC compares to the median, search ad managers can adjust strategies to balance cost and performance. High CPCs may warrant stricter audience targeting or a focus on more cost-effective keywords, while lower CPCs present opportunities to scale campaigns without overspending.
These insights, grounded in median values from professional agency-managed campaigns, help ensure clients’ advertising costs align with achievable performance expectations.
Average Google Ads Cost Per Click by Industry
Industry | Median CPC |
|---|---|
Advertising & Marketing | $1.87 |
Agriculture & Farming | $0.72 |
Animals & Pets | $1.29 |
Apparel & Fashion | $0.61 |
Arts & Entertainment | $0.99 |
Attorneys & Legal Services | $4.96 |
Automotive Parts & Services | $2.81 |
Beauty & Personal Care | $1.29 |
Business Services | $1.80 |
Dental Services | $4.80 |
Education | $1.39 |
Electrical Services | $3.40 |
Finance & Insurance | $6.02 |
Food & Beverage | $0.72 |
Furniture | $0.84 |
Health & Fitness | $1.80 |
Home Improvement | $1.74 |
HVAC Repair | $3.44 |
Non Profit | $3.55 |
Plumbing | $3.64 |
Real Estate | $1.44 |
Restaurants | $0.60 |
Roofing | $8.57 |
Sports & Recreation | $0.70 |
Storage & Moving | $4.27 |
Travel | $0.77 |
Weddings & Events | $1.21 |
Average Google CTR
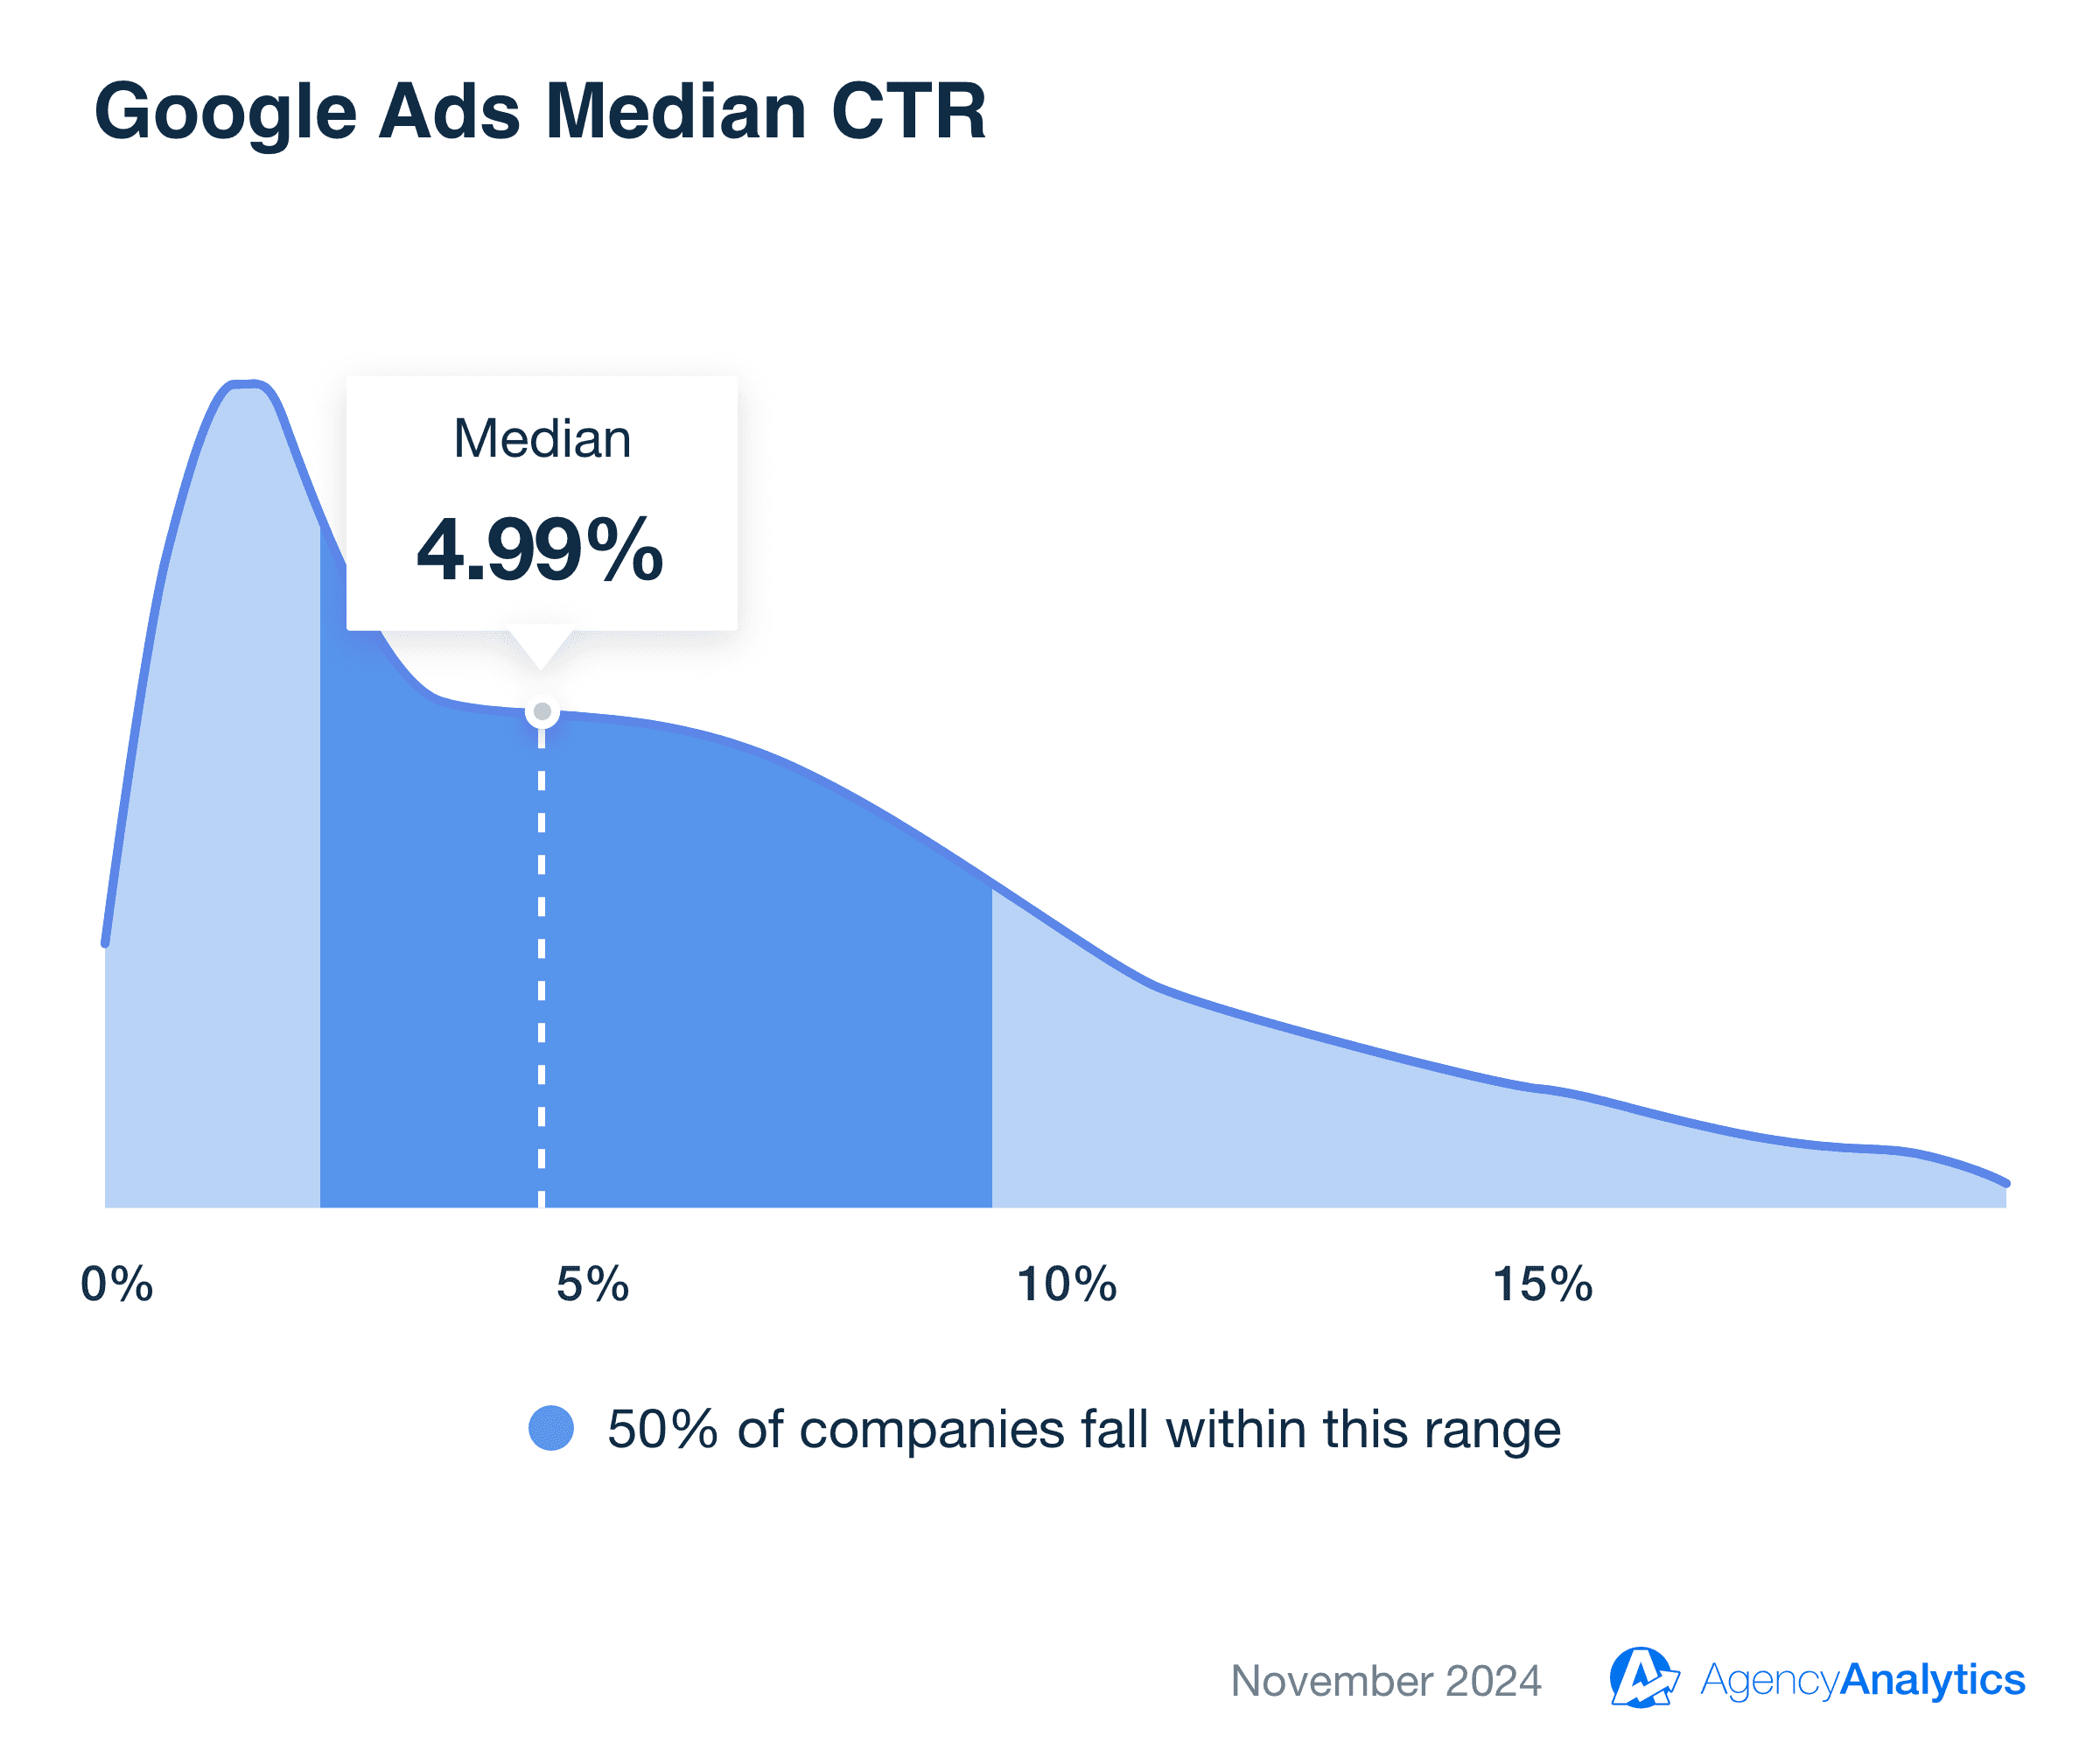
Click-through rate (CTR) measures how effectively search ads capture attention. The median CTR across industries is 4.99%, providing a benchmark for engagement that helps evaluate whether ads are resonating with their intended audience.
But as with all metrics, the context behind click-through rate matters. Some industries consistently see higher-than-average CTRs. For instance, Non-Profits stand out with a median CTR of 8.38%, likely driven by emotionally compelling calls to action that inspire immediate engagement. Similarly, Storage and moving, with a median CTR of 8.59%, reflects the urgency and specificity of user searches in this category.
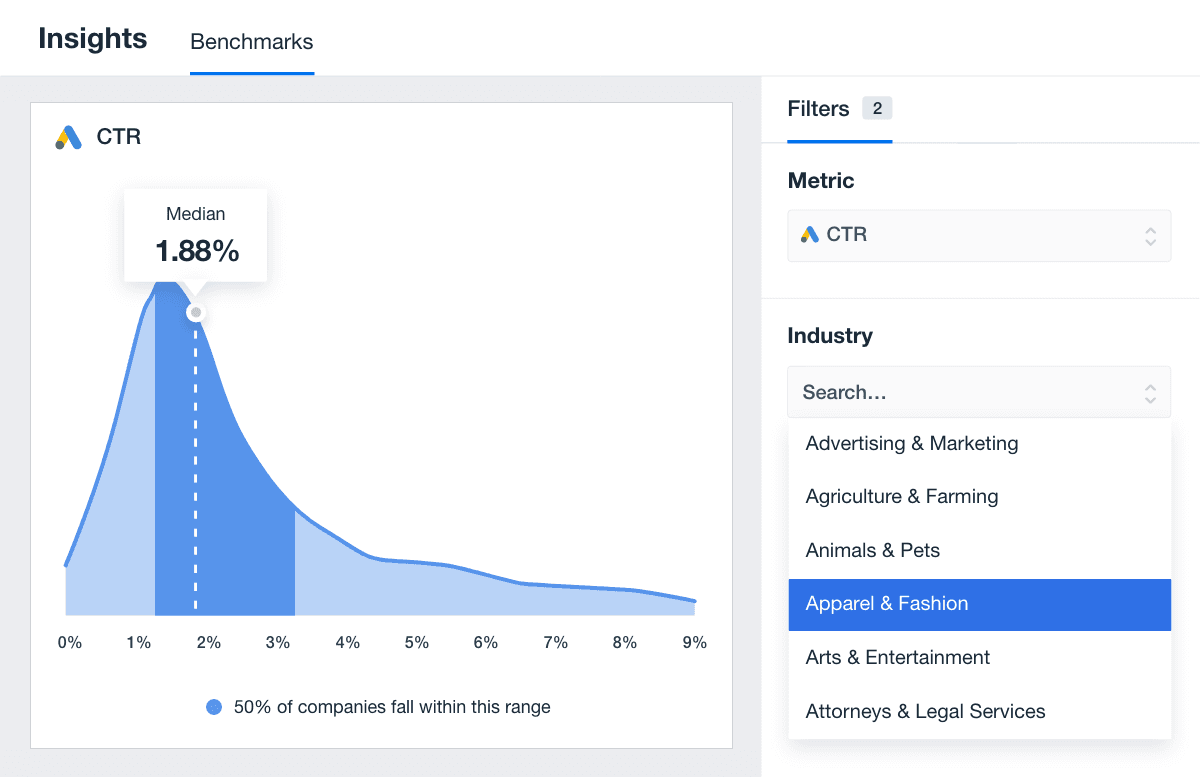
On the other end of the spectrum, sectors like Apparel & Fashion, at 1.88%, face challenges in breaking through with ads, often competing in a crowded marketplace of visually appealing but less urgent offers.
High CTRs typically reveal alignment between what users are searching for and what the ad delivers. Search ad benchmarks like CTR help marketing teams understand whether their ads cut through the noise or get lost in the shuffle.
Average Google Ads Click-through Rate by Industry
Industry | Median CTR |
|---|---|
Advertising & Marketing | 4.18% |
Agriculture & Farming | 2.08% |
Animals & Pets | 4.98% |
Apparel & Fashion | 1.88% |
Arts & Entertainment | 4.95% |
Attorneys & Legal Services | 5.35% |
Automotive Parts & Services | 4.30% |
Beauty & Personal Care | 4.58% |
Business Services | 3.85% |
Dental Services | 5.93% |
Education | 4.72% |
Electrical Services | 4.53% |
Finance & Insurance | 6.04% |
Food & Beverage | 1.96% |
Furniture | 2.18% |
Health & Fitness | 5.85% |
Home Improvement | 4.50% |
HVAC Repair | 3.82% |
Non Profit | 8.38% |
Plumbing | 4.62% |
Real Estate | 4.08% |
Restaurants | 3.56% |
Roofing | 3.88% |
Sports & Recreation | 2.86% |
Storage & Moving | 8.59% |
Travel | 5.22% |
Weddings & Events | 6.89% |
How To Interpret Google Ads Benchmarks
Google Ads benchmarks are powerful tools, but interpreting them requires more than just comparing numbers. Whether it’s conversion rates, click-through rates, or costs, benchmarks provide context that helps assess performance, identify improvement areas, and even enhance your agency’s reputation.
However, high or low numbers don’t always mean what they seem. Here’s how to dig deeper into benchmarks and use them strategically.
When a Low Google Ads Conversion Rate Isn’t Always Bad
A low conversion rate doesn’t automatically indicate a failing campaign. Industries like Apparel & Fashion (median conversion rate: 2.15%) naturally experience lower rates due to longer decision-making processes and non-urgent purchases. A lower conversion rate may be balanced by higher search volumes and repeat purchases, making the overall campaign highly effective.
Instead of focusing solely on the conversion rate, look at metrics like cost per conversion or return on ad spend to gain a more comprehensive picture.
When a High Google Ads Click-Through Rate Might Signal Problems
While a high CTR often indicates that ads are grabbing attention, it doesn’t always translate to success. If clicks aren’t leading to conversions, a high CTR could point to issues like mismatched ad messaging, poor landing page experience, or irrelevant targeting.
For example, a Food & Beverage campaign with a CTR well above the median of 1.96% but a low conversion rate may suggest that users are intrigued by the ad but don’t find what they expect on the landing page.
Using Benchmarks To Identify Opportunities for Optimization
Benchmarks are invaluable for spotting areas where campaigns could improve. When performance falls short of industry medians, it’s an opportunity to refine strategies.
For instance, if a Non-Profit campaign is underperforming compared to its 8.38% median CTR, it might benefit from more emotionally compelling copy or visuals. Similarly, a Health and Fitness campaign with a conversion rate below its 4.33% median could indicate room to enhance landing pages or tighten audience targeting.
Benchmarks also help prioritize efforts. High CPCs in competitive industries like Attorneys & Legal Services might signal a need to adjust bidding strategies, while sectors with lower CPCs offer opportunities to maximize volume and reach.
Using Benchmarks to Position Your Agency
Bringing benchmark data into client conversations helps marketing teams demonstrate in-depth understanding of the industry and its challenges.
For example, referencing their 4.08% median CTR sets the stage for transparent performance discussions when pitching to a Real Estate client. Showing how your strategies consistently exceed these medians builds trust and positions your agency as a data-driven partner.
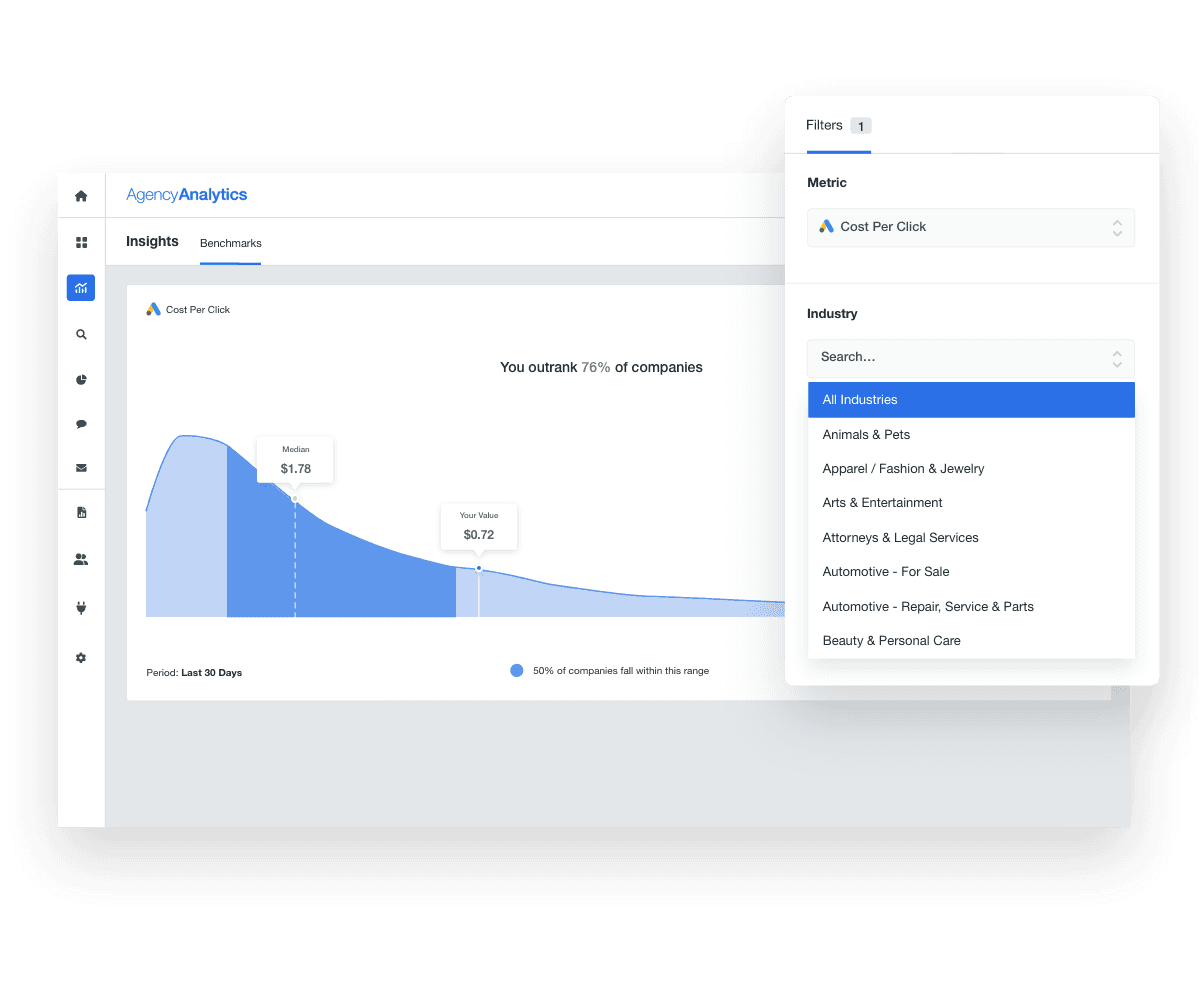
Providing clients with insights that go beyond surface-level numbers also highlights the value of your expertise. By explaining why their campaign’s CTR or cost per conversion aligns (or doesn’t align) with industry norms, you reinforce your agency's role as a proactive, informed advisor.

Written by
Paul Stainton is a digital marketing leader with extensive experience creating brand value through digital transformation, eCommerce strategies, brand strategy, and go-to-market execution.
Read more posts by Paul StaintonSee how 7,000+ marketing agencies help clients win
Free 14-day trial. No credit card required.


