Table of Contents
QUICK SUMMARY:
The average click-through rate varies by platform and is a critical benchmark for measuring ad performance. Industry data highlights median CTRs for platforms like Google Ads, Facebook Ads, and LinkedIn Ads, helping agencies gauge campaign success. Based on over 150,000 campaigns, this guide offers essential insights to optimize strategies and identify growth opportunities.
Click-through rates (CTR) reveal how effectively digital marketing campaigns engage their target audience. They’re the litmus test for ad performance, showing whether the creative and targeting resonate—or fall flat. But without reliable benchmarks, comparing one campaign to another is like piecing together a puzzle without knowing what the picture looks like.
This is where industry averages and median values step in. They turn guesswork into a grounded understanding of what's “good” across platforms like Google Ads, Facebook Ads, and LinkedIn Ads.
Curious if your campaigns are hitting the mark? These median click-through rates provide a snapshot of what top-performing marketing agencies achieve across major platforms. With data from over 150,000 campaigns, think of this as your cheat sheet for measuring success and spotting opportunities to improve.
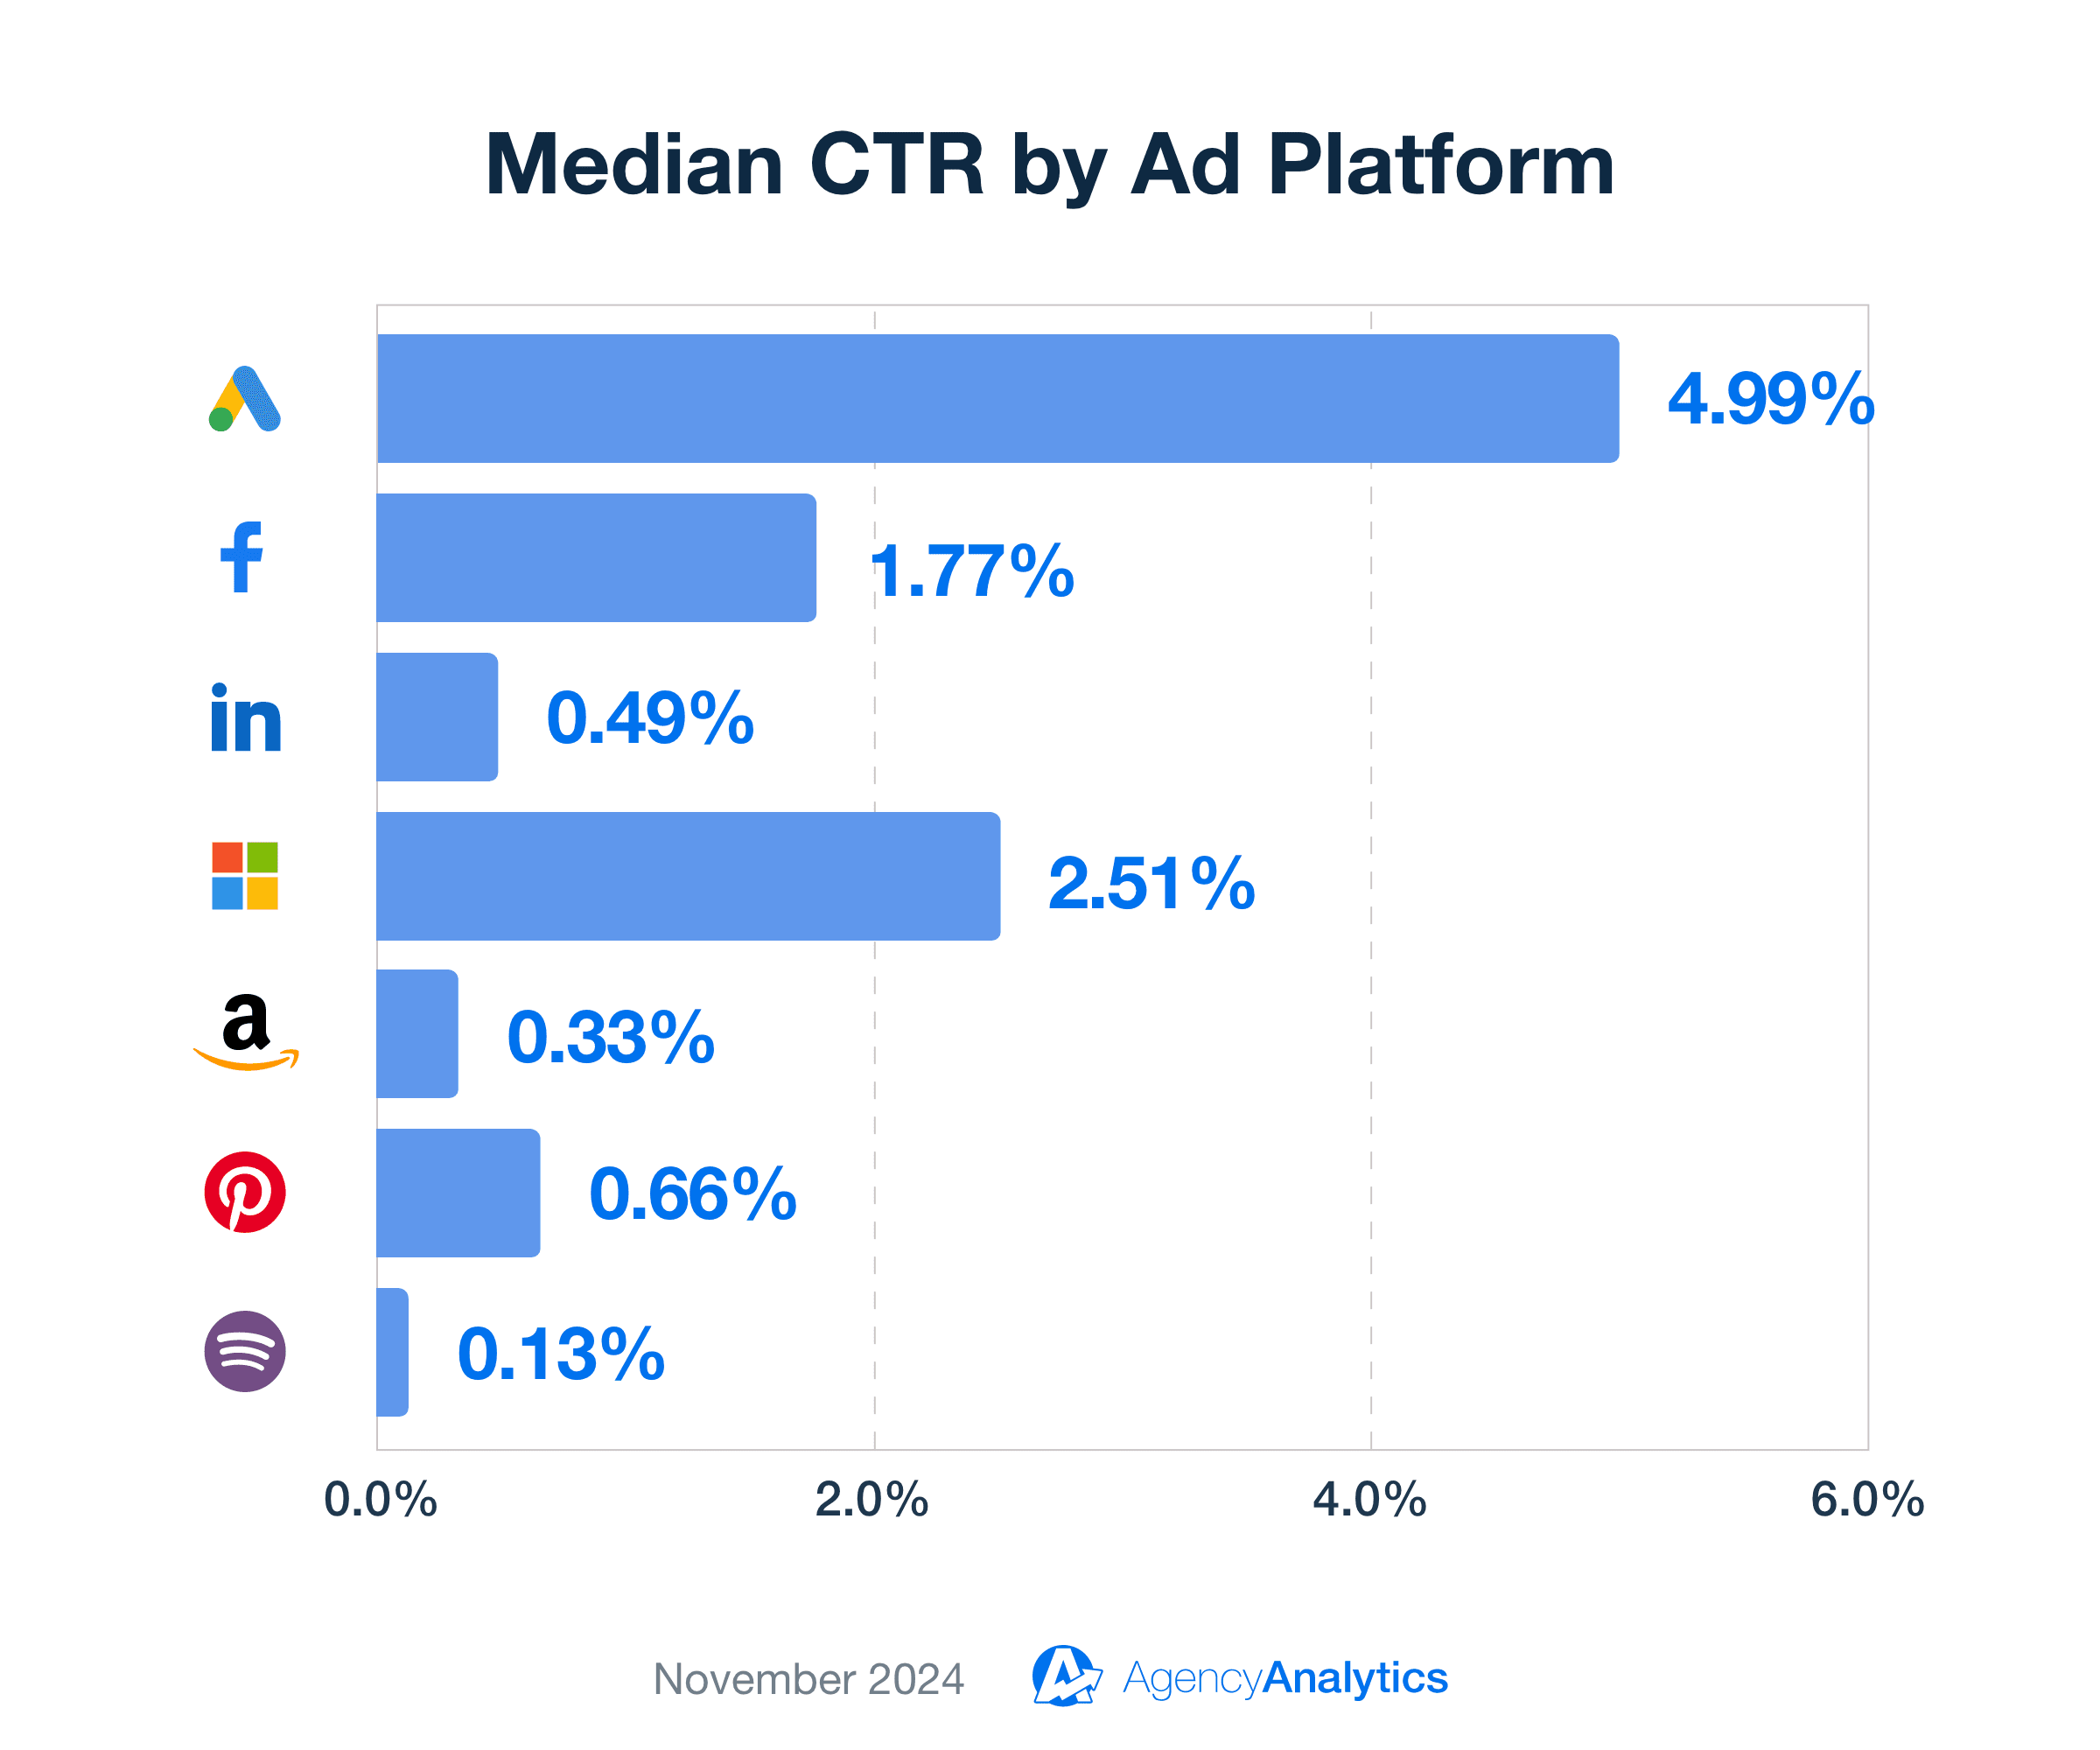
Here’s a sneak peek at where the benchmarks stand:
Google Ads: 4.99% – The go-to for high-intent search results.
Facebook Ads: 1.77% – Driving engagement with tailored audience targeting.
LinkedIn Ads: 0.49% – Connecting with niche professional audiences.
Microsoft Ads: 2.51% – Targeting untapped demographics.
Amazon Ads: 0.33% – Capturing clicks closer to purchase decisions.
Pinterest Ads: 0.66% – Inspiring early engagement through visual discovery.
Spotify Ads: 0.13% – Amplifying brand awareness through audio campaigns.
Is your CTR above the median? Below it? Use this data as a jumping-off point to refine your strategies, connect with the right ad viewers, and make every click count.
Whether it's identifying areas where client ads underperform or celebrating where they shine, benchmark data sets the stage for smarter, more informed decisions in digital marketing.
Stay tuned as we break down what the data tells us, based on benchmarks from over 150,000 marketing campaigns, to give the complete picture of CTR averages and medians.
Why Average Click-Through Rate Matters
The average click-through rate shows how well a digital marketing campaign grabs attention and gets people to act. It’s a guide for spotting opportunities, refining strategies, and improving results.
CTR is calculated by dividing the number of clicks by the number of impressions. This straightforward formula highlights how engaging an ad is to its audience.
As a key performance indicator, CTR provides instant feedback on ad copy, creative, and targeting. A high CTR means the campaign resonates with the audience, while a low CTR signals it’s time to make adjustments.
Conversely, campaigns that fall below benchmarks may raise red flags. Low CTRs may be interpreted as ineffective targeting or uninspired creative. By staying informed on CTR benchmarks and working to meet or surpass them, agencies boost client retention and enhance their reputation as effective marketers.
The Value of Click-through Rate Benchmarks by Industry
Industry benchmarks for metrics like average CTR offer marketing agencies a standard for evaluating performance. By leveraging benchmarks, agencies gain the clarity needed to optimize ad spend and deliver better client results.
However, not all benchmarks are created equal. The data provided here comes from campaigns run by over 7,000 professional marketing agencies using AgencyAnalytics—not a mixed bag of data that includes rookie mistakes.
This means you're looking at insights shaped by seasoned experts, delivering a clear, reliable standard to measure your campaigns. If you’re ready to stop guessing and start setting realistic, actionable goals, this benchmark data gets you there.
Here's the addition for the requested section:
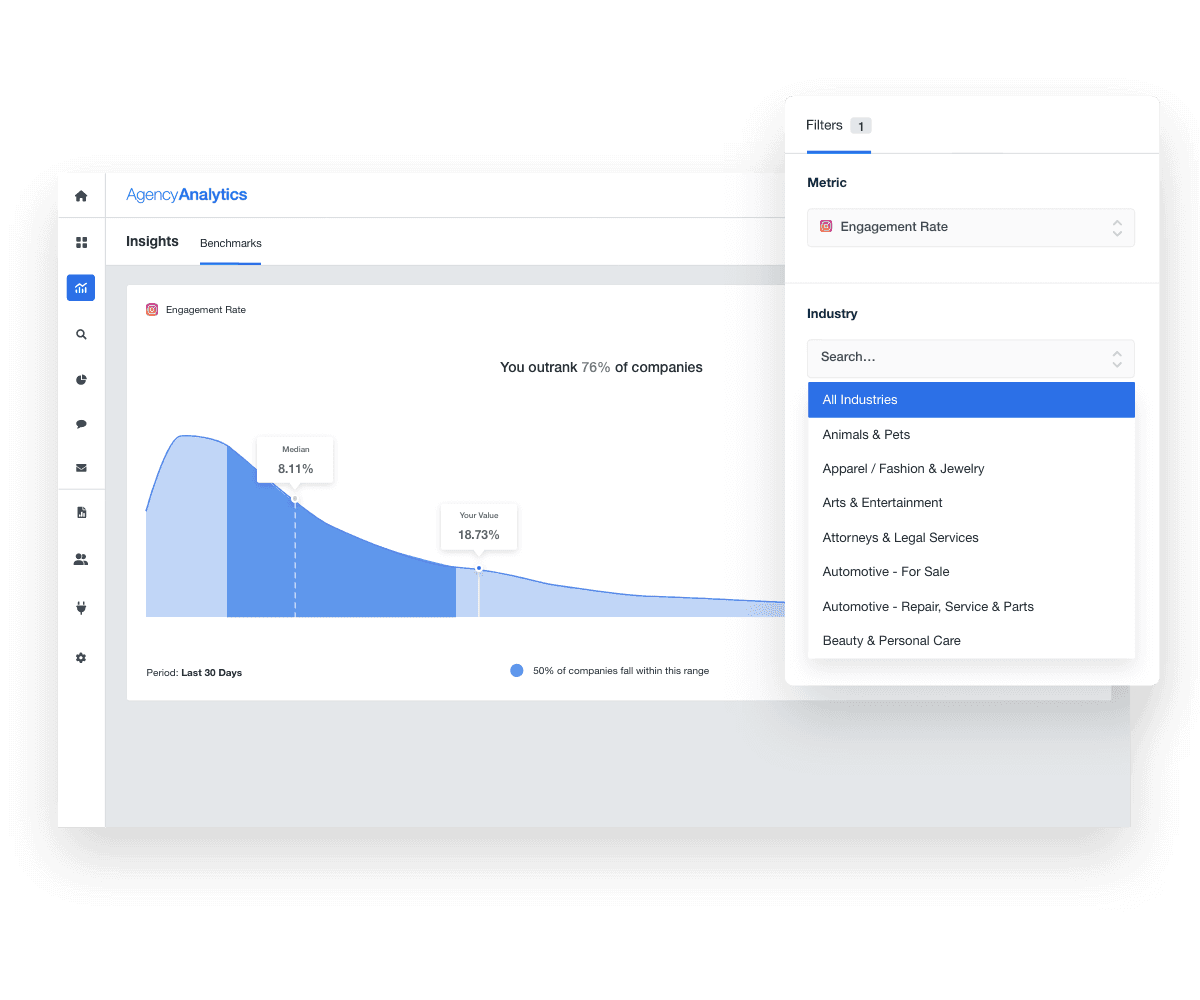
With the AgencyAnalytics benchmarks feature, it's easy to dig deeper into click-through rate benchmarks by industry, gaining valuable insights into how your campaigns stack up against competitors in your field. This tool helps agencies compare performance against industry standard CTR data, automatically identifying where your campaigns excel or need improvement. Understanding these CTR industry benchmarks is critical because the optimal click-through rate benchmark can vary significantly across industries.
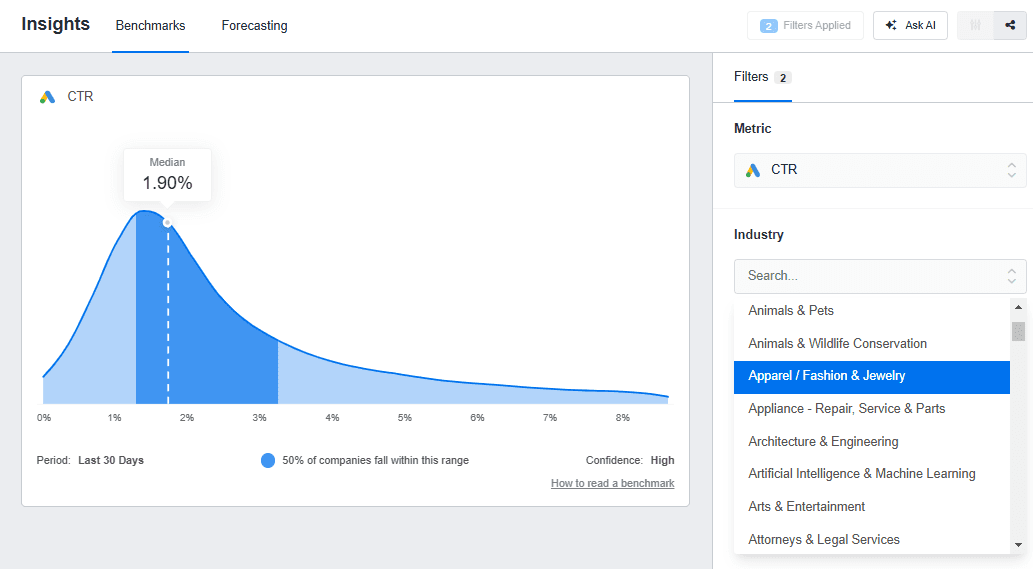
For instance, a high-performing CTR in the e-commerce industry may differ vastly from benchmarks in the financial sector or healthcare. By leveraging this data, agencies can fine-tune their strategies to better align with CTR benchmarks specific to their niche, ensuring more impactful campaigns that resonate with target audiences. Armed with these insights, you'll have the confidence to guide your clients toward achieving and exceeding their goals.
Average vs. Median Values: Which Is More Relevant?
To calculate average click-through rates, divide the total number of clicks by the total number of impressions, then average this data across all campaigns. While averages offer a quick look at performance, they are sometimes heavily skewed by outliers—extraordinarily high or low results that distort the overall picture.
Median values, on the other hand, represent the middle point in a dataset, providing a more balanced perspective. AgencyAnalytics relies on median values for its benchmarks because they better reflect typical performance, especially in datasets with significant variability.
For example, a median CTR value shows what a "typical" campaign achieves, while the average might exaggerate results due to a few exceptionally high-performing campaigns.
While averages remain popular for their simplicity, median values align more closely with the actionable insights agencies need to improve campaign performance and demonstrate value to clients.
Common Misconceptions About CTR Benchmarks
One common misconception is that hitting an industry average CTR guarantees success. While it’s a good indicator, other factors—like cost per click (CPC) and return on ad spend (ROAS)—must also be considered.
Another misunderstanding is that benchmarks apply universally to all types of ads. For instance, Google Ads and Facebook Ads often have very different CTR norms due to differences in audience behavior and platform functionality, and CTR rates fluctuate based on the advertiser’s industry, as that audience may respond differently to ads.
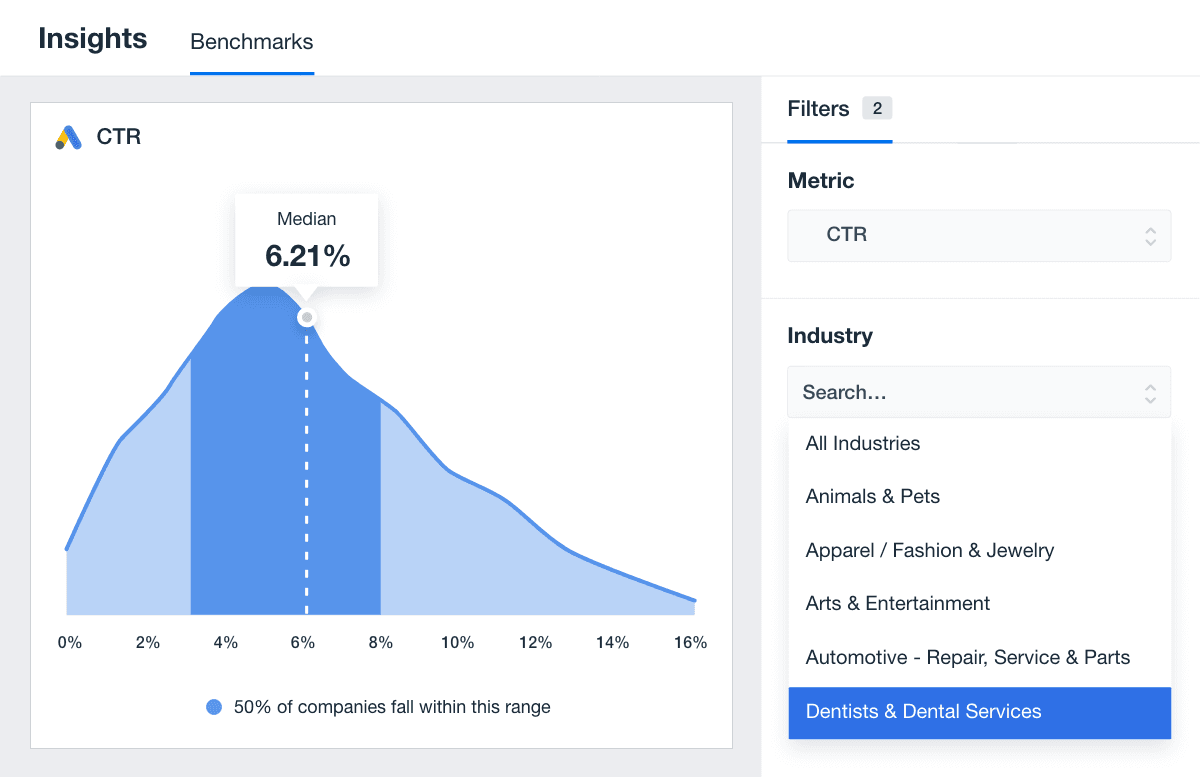
For example, the median CTR for all Google Ads is 4.99%, but for Dental Services, it spikes to 6.21%.
Benchmarks should always be interpreted in the context of the specific platform and ad format, which is why the AgencyAnalytics benchmarks platform makes it easy to filter these benchmarks by advertiser industry.
Want to show off how well your agency exceeds these industry standards? Automatically include benchmarks in agency dashboards and client reports. Get started with a 14-day free trial.
Average CTRs by Ad Platform
Understanding the average (or, more accurately, the median) CTR for each platform is critical for evaluating ad campaign performance compared to industry standards.
Below, we summarize the median CTRs for key platforms and what these numbers mean for campaign success.
Average CTR for Google Ads
The median CTR for Google Ads, including search ads, video ads, and the Google display network is 4.99%, reflecting its effectiveness in capturing high-intent audiences. Campaigns on Google Ads often benefit from users actively searching for products or services, which translates to higher engagement.
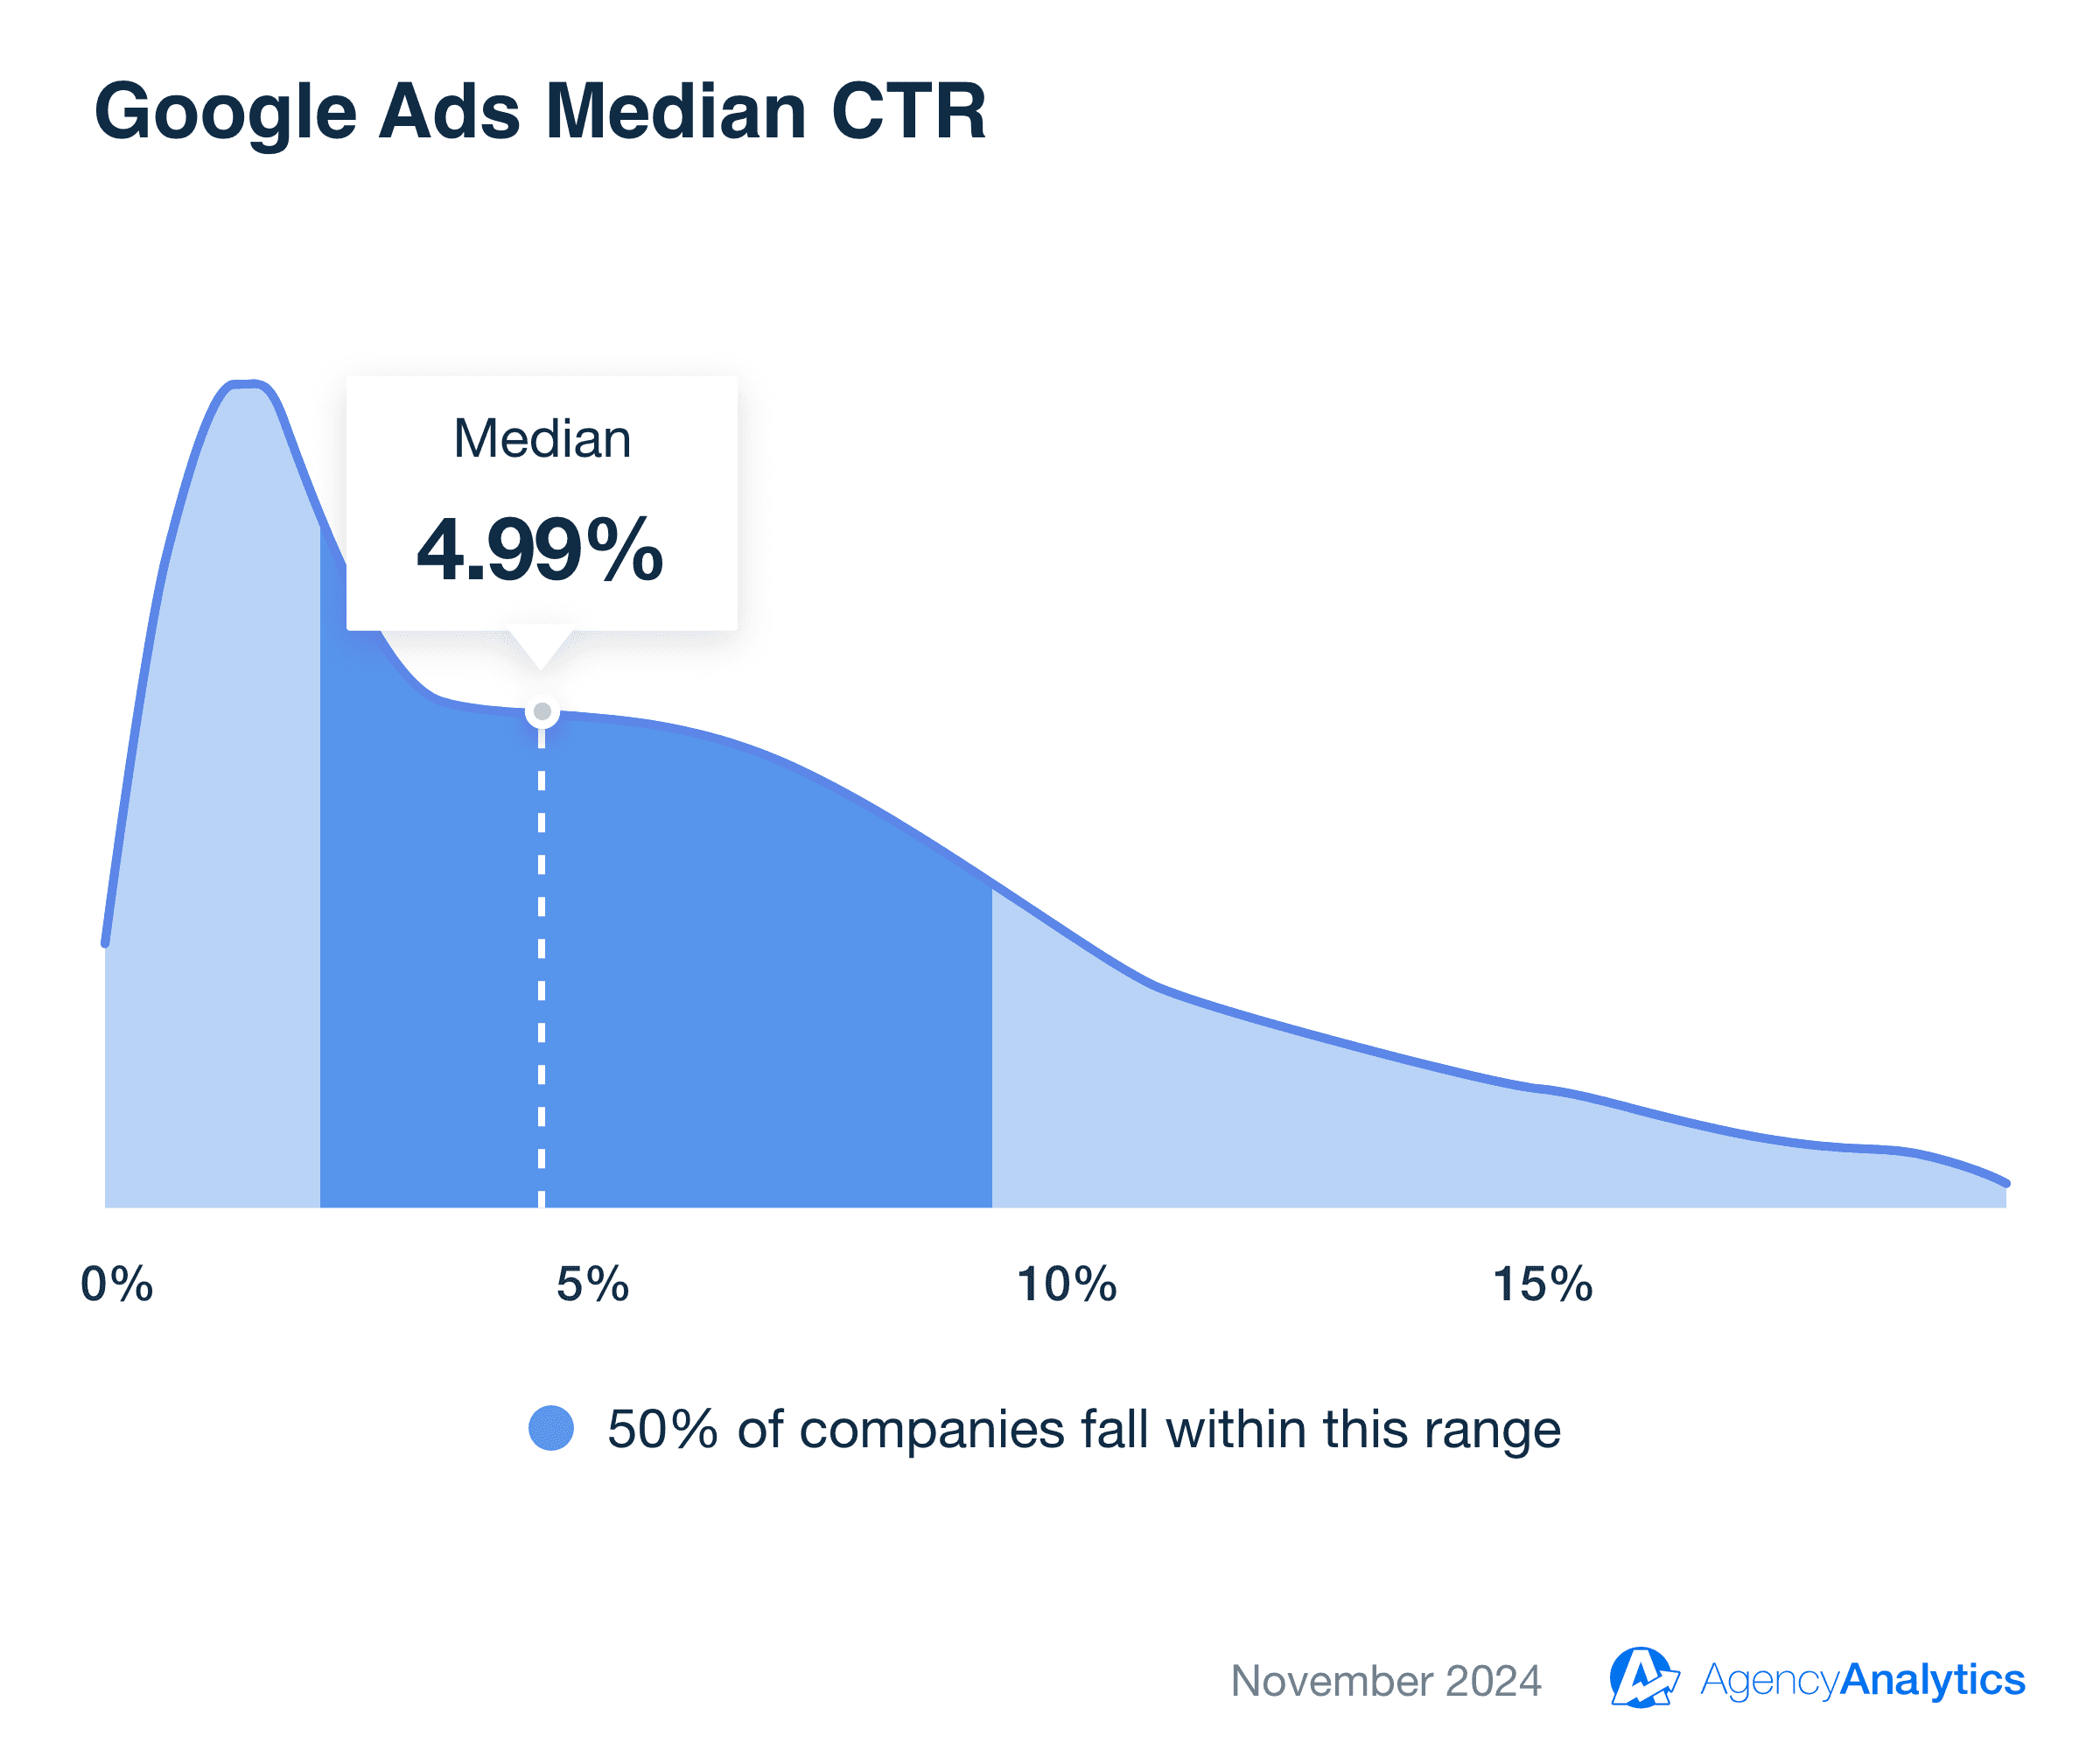
This median acts as a baseline for evaluating whether targeting and ad relevance meet expectations. Falling below 4.99% may indicate issues with keyword alignment, a crowded marketplace, or ad copy that doesn’t resonate.
Easily integrate these benchmarks into your Google Ads dashboard or Google Ads report template to track performance and drive results. Try AgencyAnalytics free for 14 days.
Average CTR for Facebook Ads
Facebook Ads have a median CTR of 1.77%, highlighting their broad reach to audiences with diverse interests. While engagement may not be as high as Google Ads, Facebook’s targeting tools allow campaigns to connect with specific groups effectively.
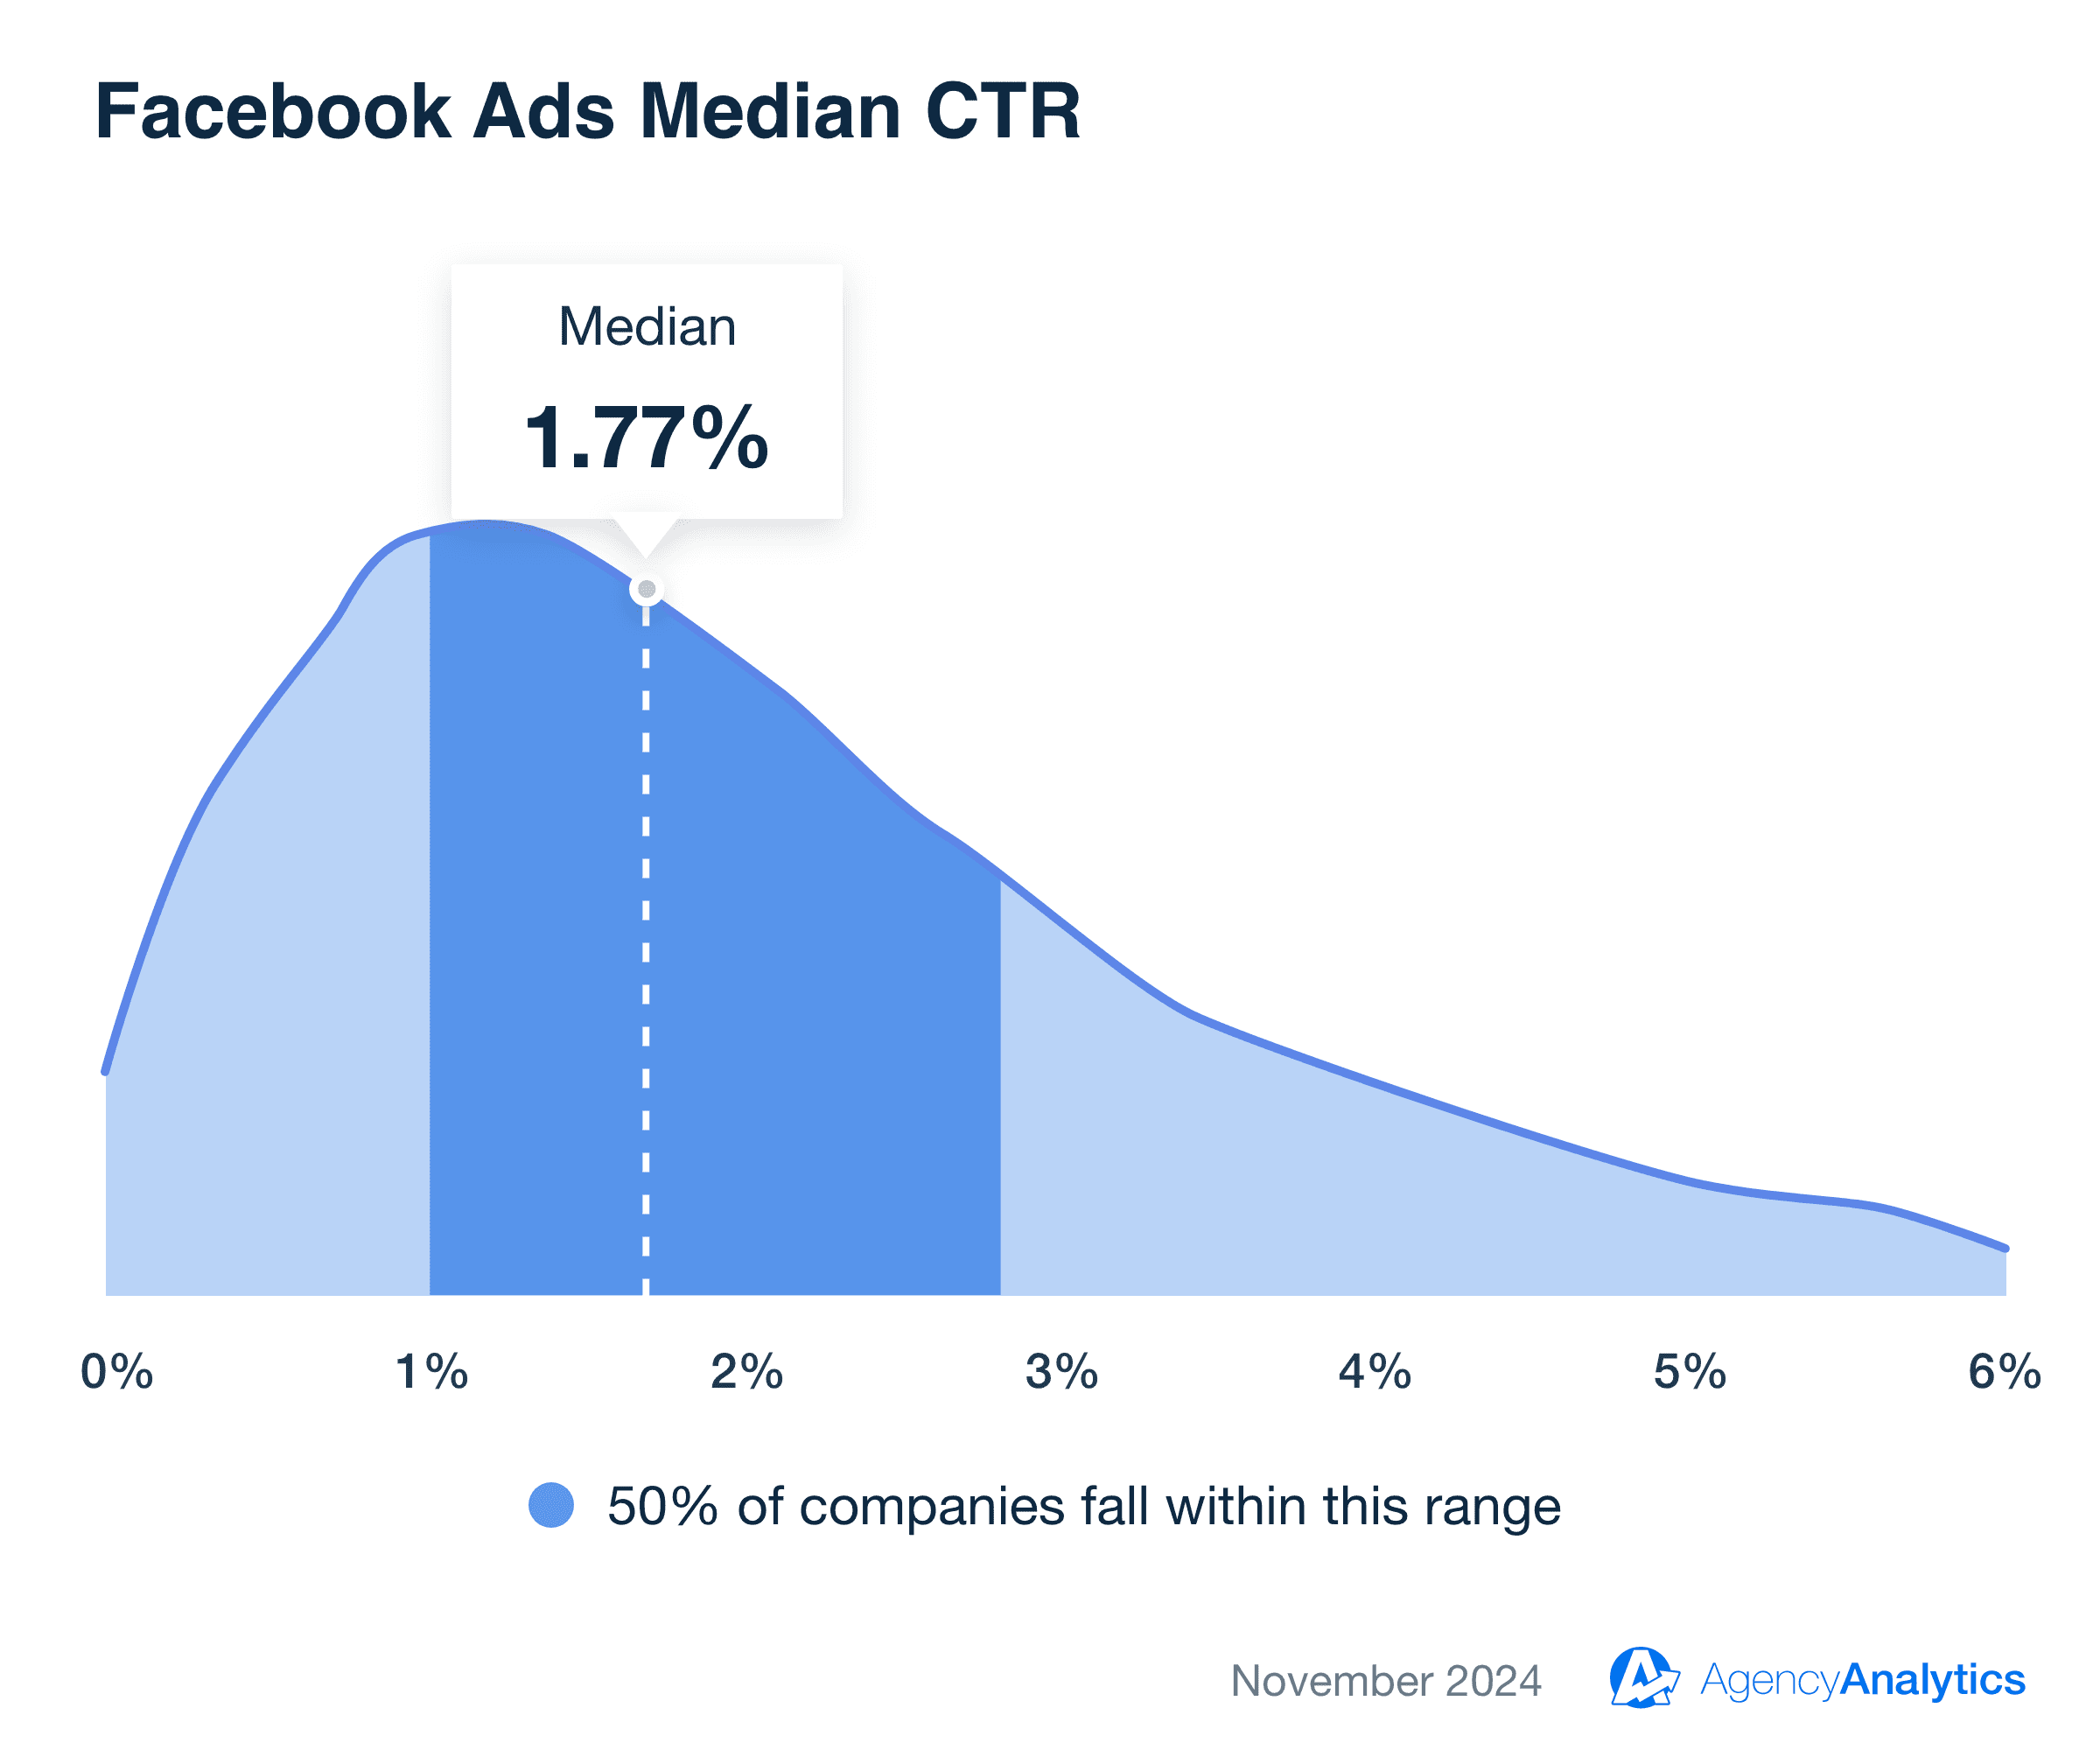
Agencies working with the Facebook Ad CTR benchmark often examine creative quality, audience segmentation, and ad formats to maintain or improve performance. Campaigns below 1.77% might need updated visuals or more precise targeting.
Read more about Facebook Ads Benchmarks.
Seamlessly incorporate these benchmarks into your Facebook Ads dashboard or Facebook Ads report template to measure success and enhance campaign outcomes. Try AgencyAnalytics free for 14 days.
Average CTR for LinkedIn Ads
The median CTR for LinkedIn Ads is 0.49%, reflecting its focus on professional audiences with specific goals. While lower than other platforms, this number aligns with LinkedIn’s strength in reaching niche B2B decision-makers.
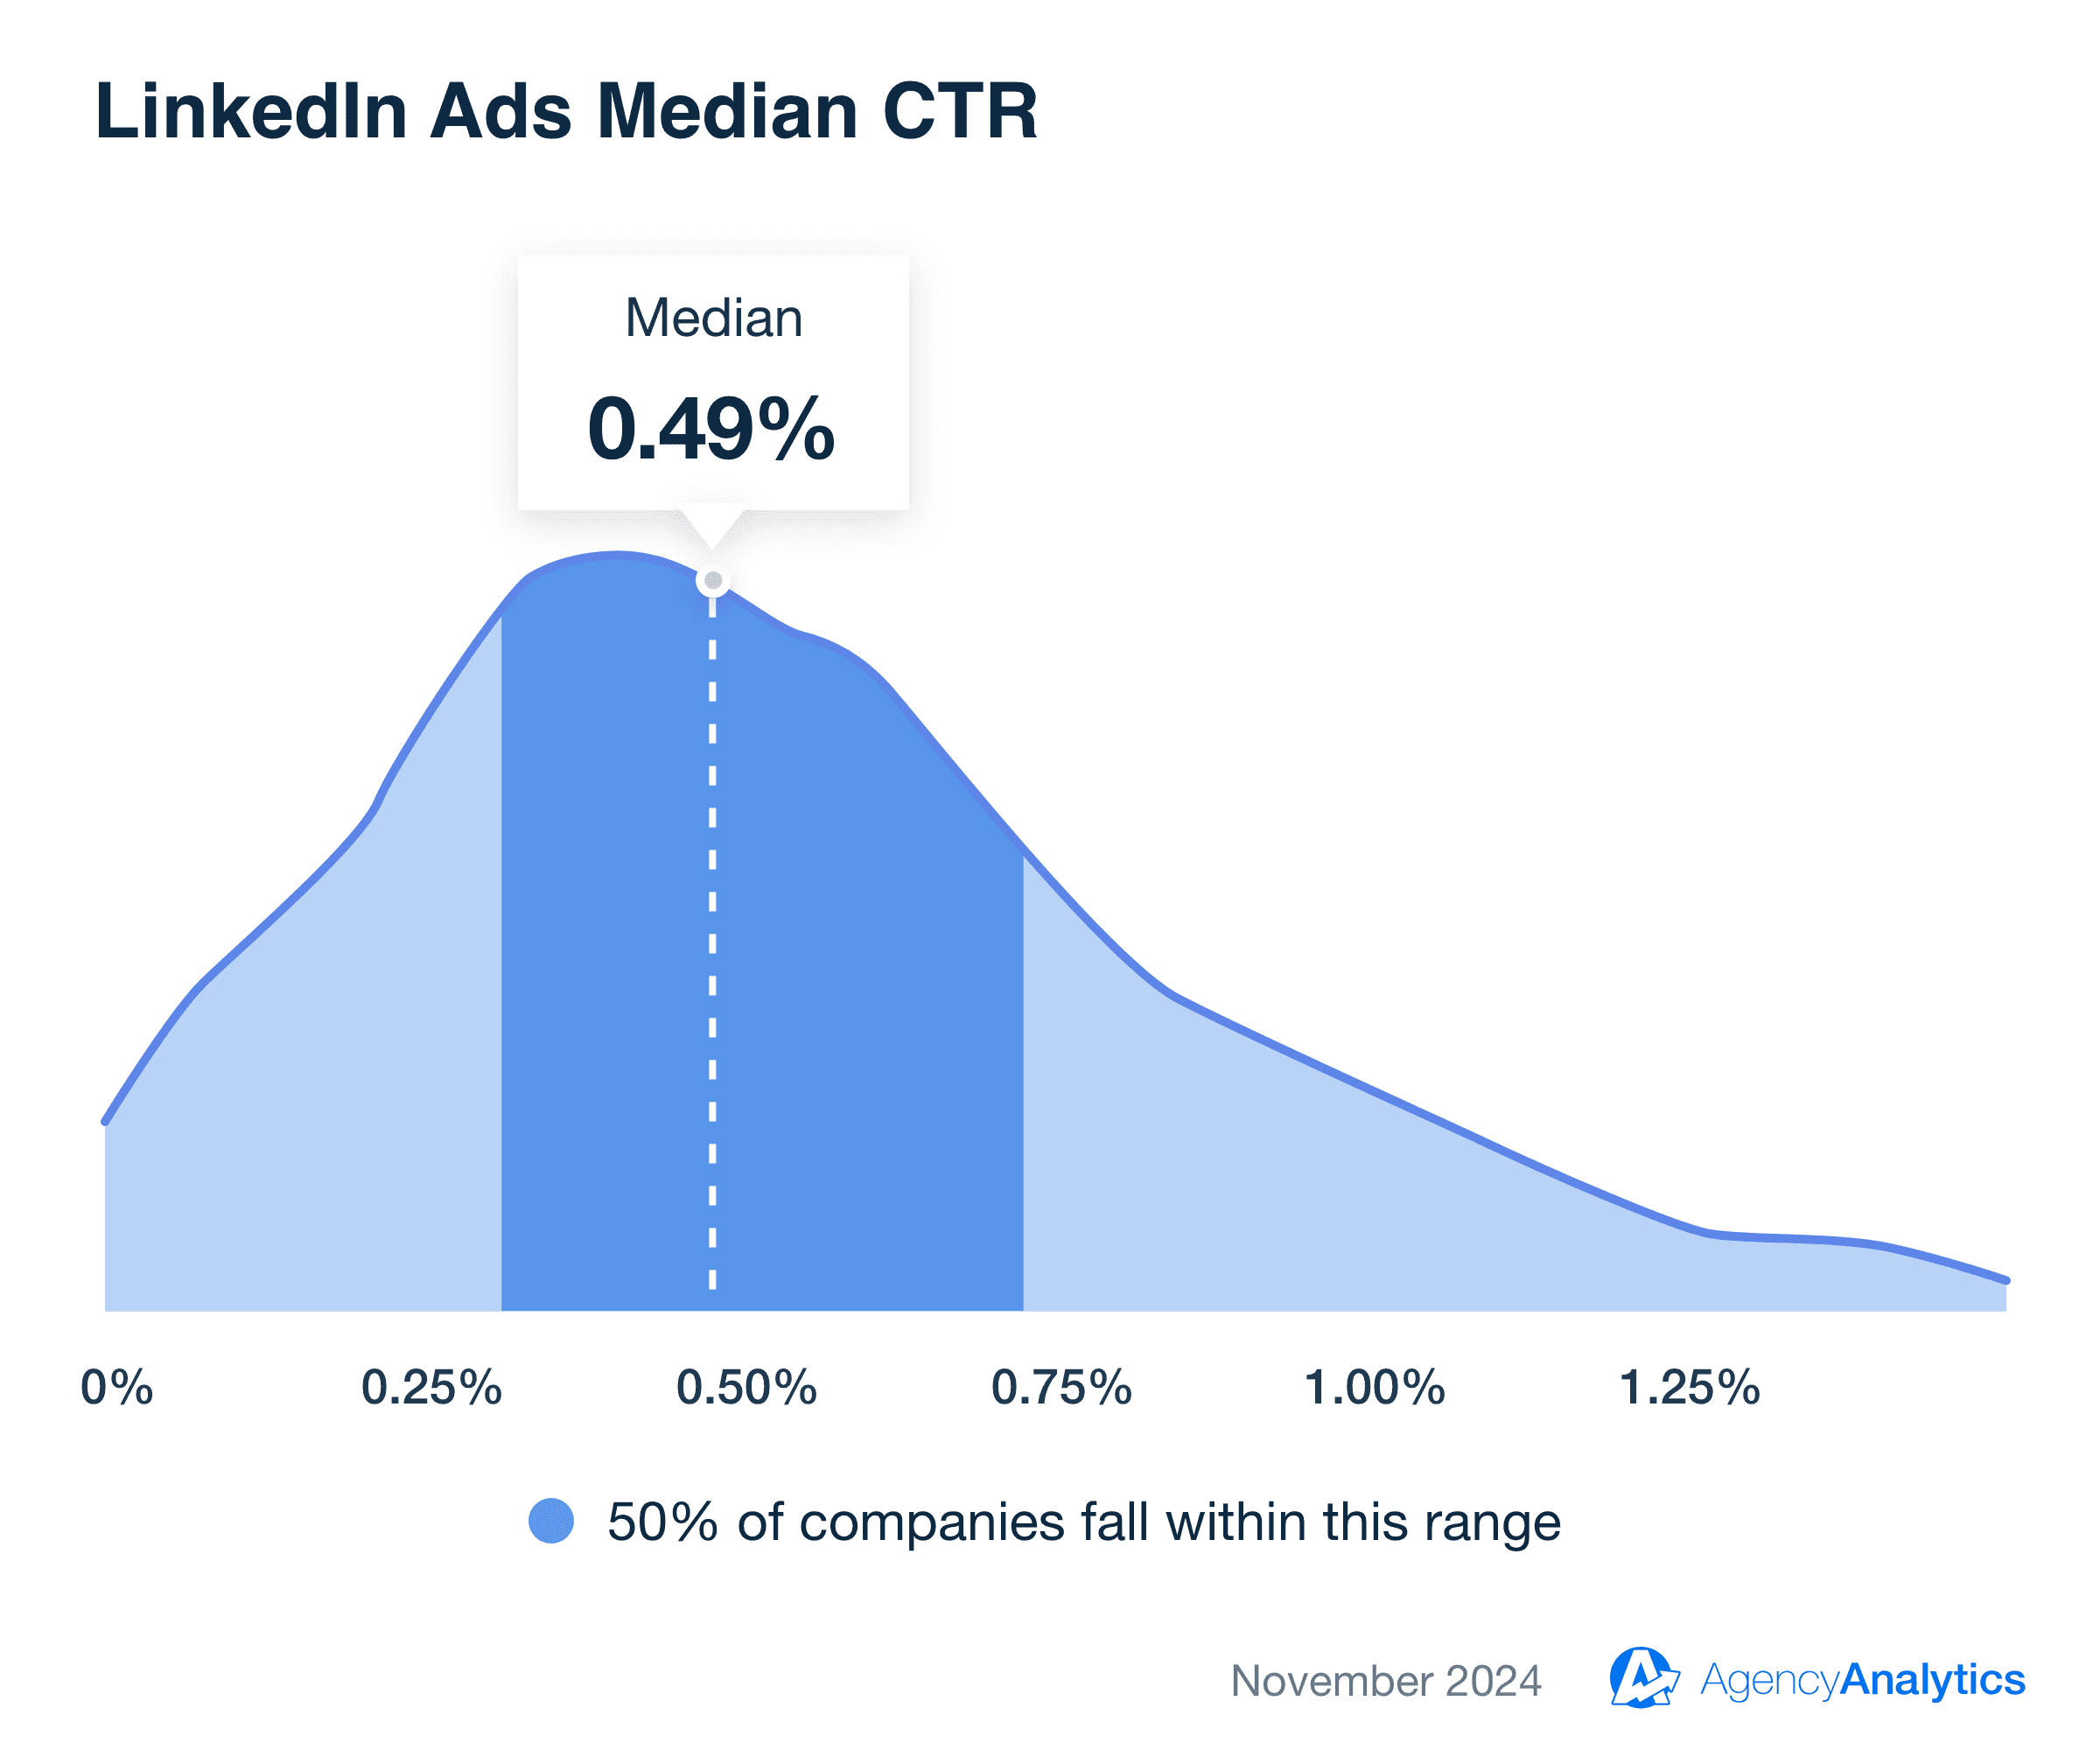
Campaigns that don’t meet this benchmark may need sharper messaging or better alignment with the audience's professional priorities.
Integrate these benchmarks directly into your LinkedIn Ads dashboard or LinkedIn report template to monitor impact and refine B2B advertising strategies. Try AgencyAnalytics free for 14 days.
Average CTR for Microsoft Ads
Microsoft Ads has a median CTR of 2.51%, showing its potential for reaching specific demographics often missed by other platforms. Its unique position as the default search engine on many devices offers opportunities for tailored campaigns.
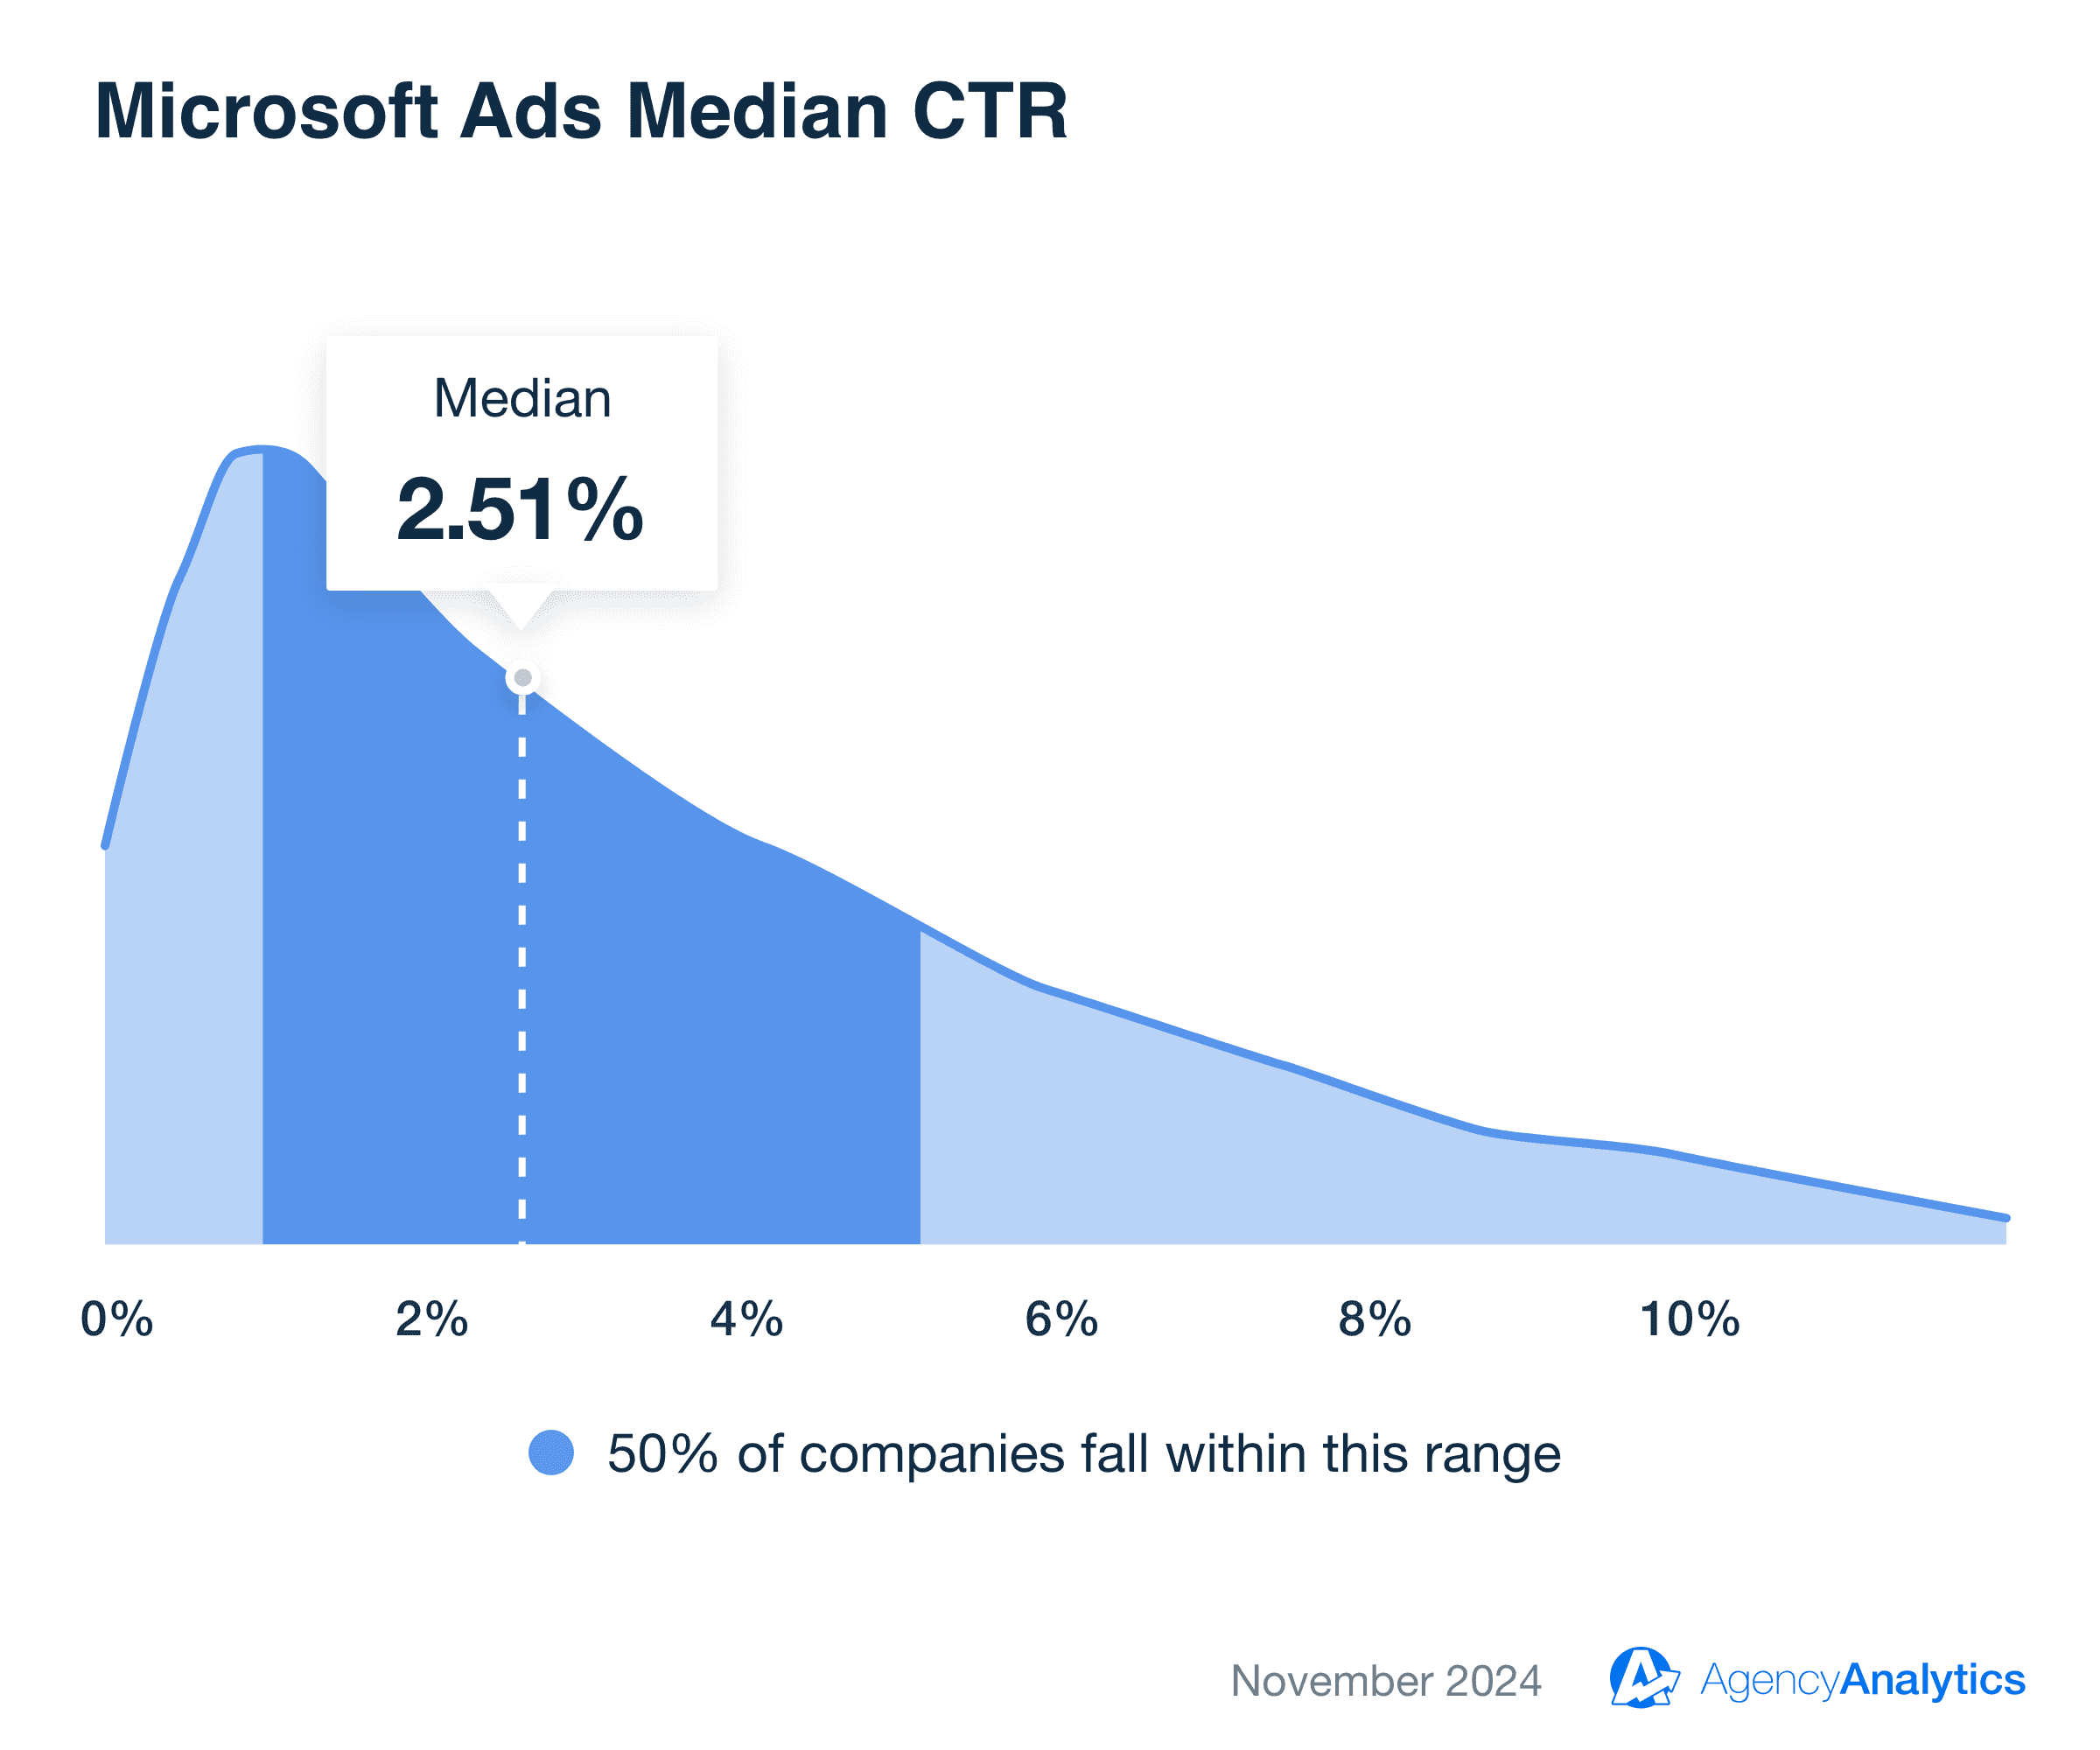
A CTR below this value might signal a need to refine targeting or adjust ad copy to better appeal to this audience.
Add these benchmarks to your Microsoft Ads reporting integration or Microsoft Ads report template to keep campaigns on track and maximize engagement. Try AgencyAnalytics free for 14 days.
Average CTR for Amazon Ads
Amazon Ads hold a median CTR of 0.33%, indicative of its transactional nature. While clicks are fewer, those who do click are often ready to purchase, making this an essential metric for ecommerce-focused campaigns.
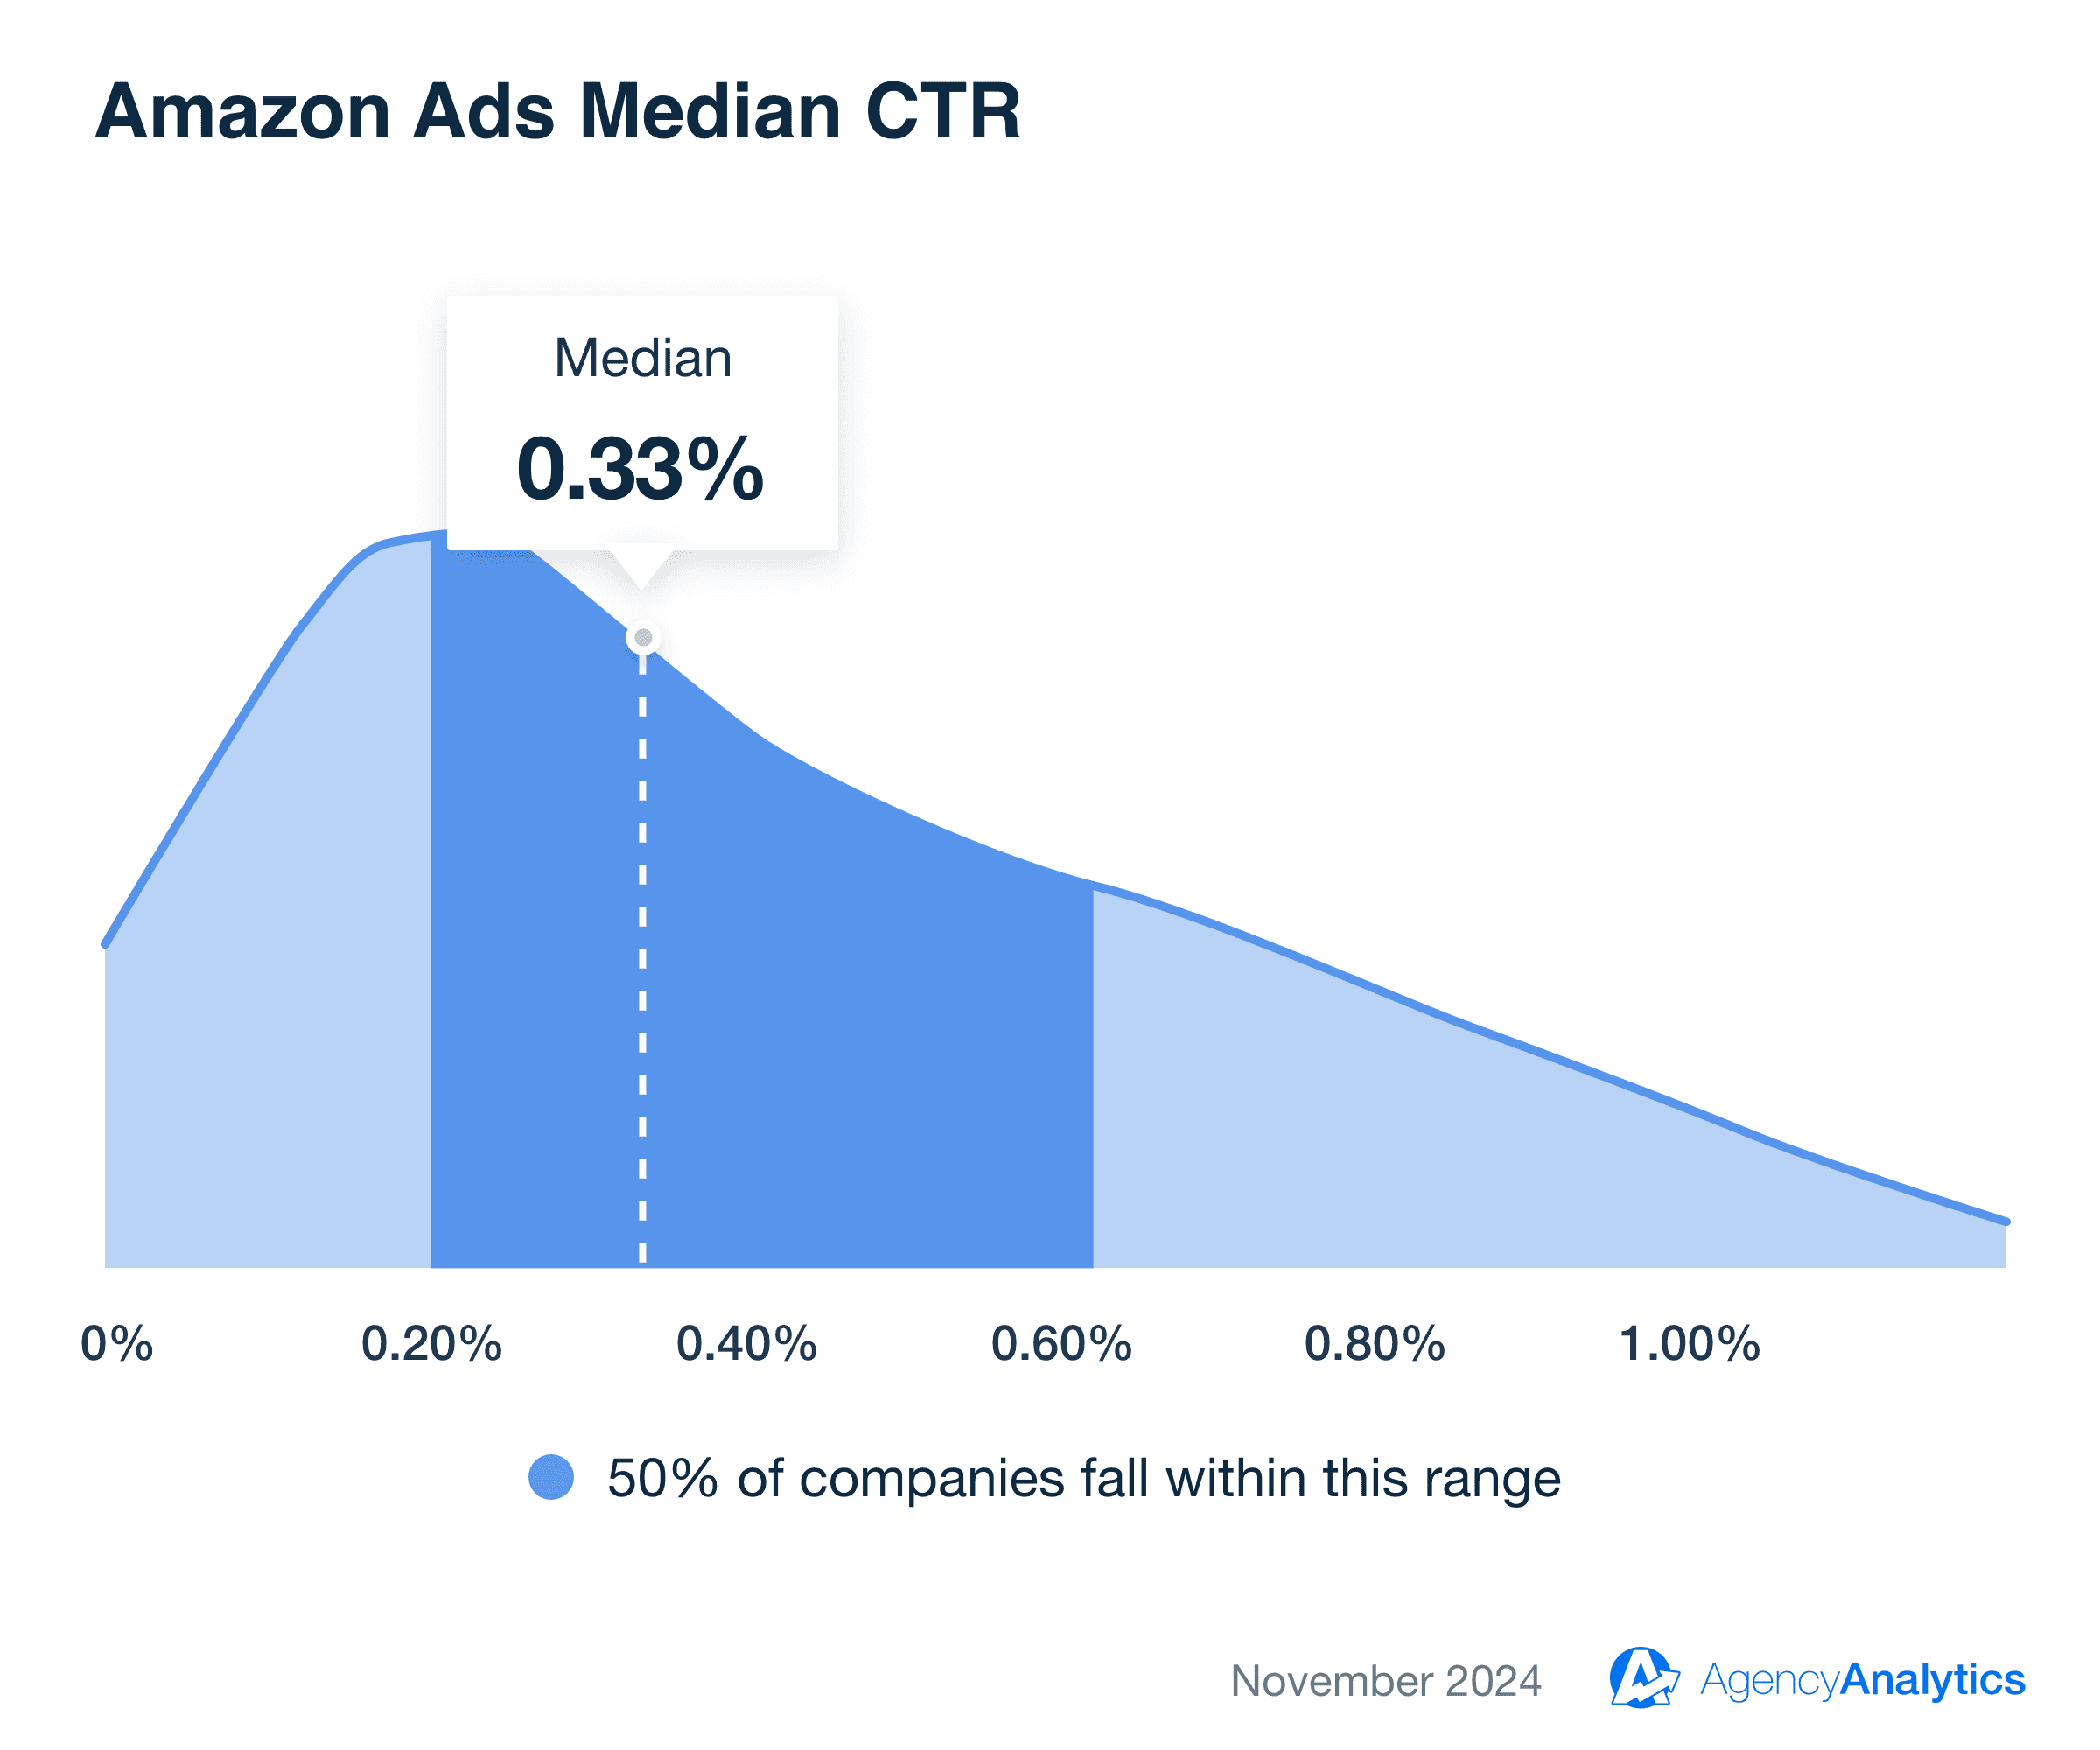
Staying at or above this median often requires precise keyword strategies and compelling product details to capture intent-driven shoppers.
Automatically include these benchmarks in your Amazon Ads dashboard or Amazon Ads report template to optimize performance and elevate ROI. Try AgencyAnalytics free for 14 days.
Average CTR for Pinterest Ads
The median CTR for Pinterest Ads is 0.66%, reflecting its role as a platform for inspiration and planning. Users often engage with visually striking, helpful content early in their decision-making process.
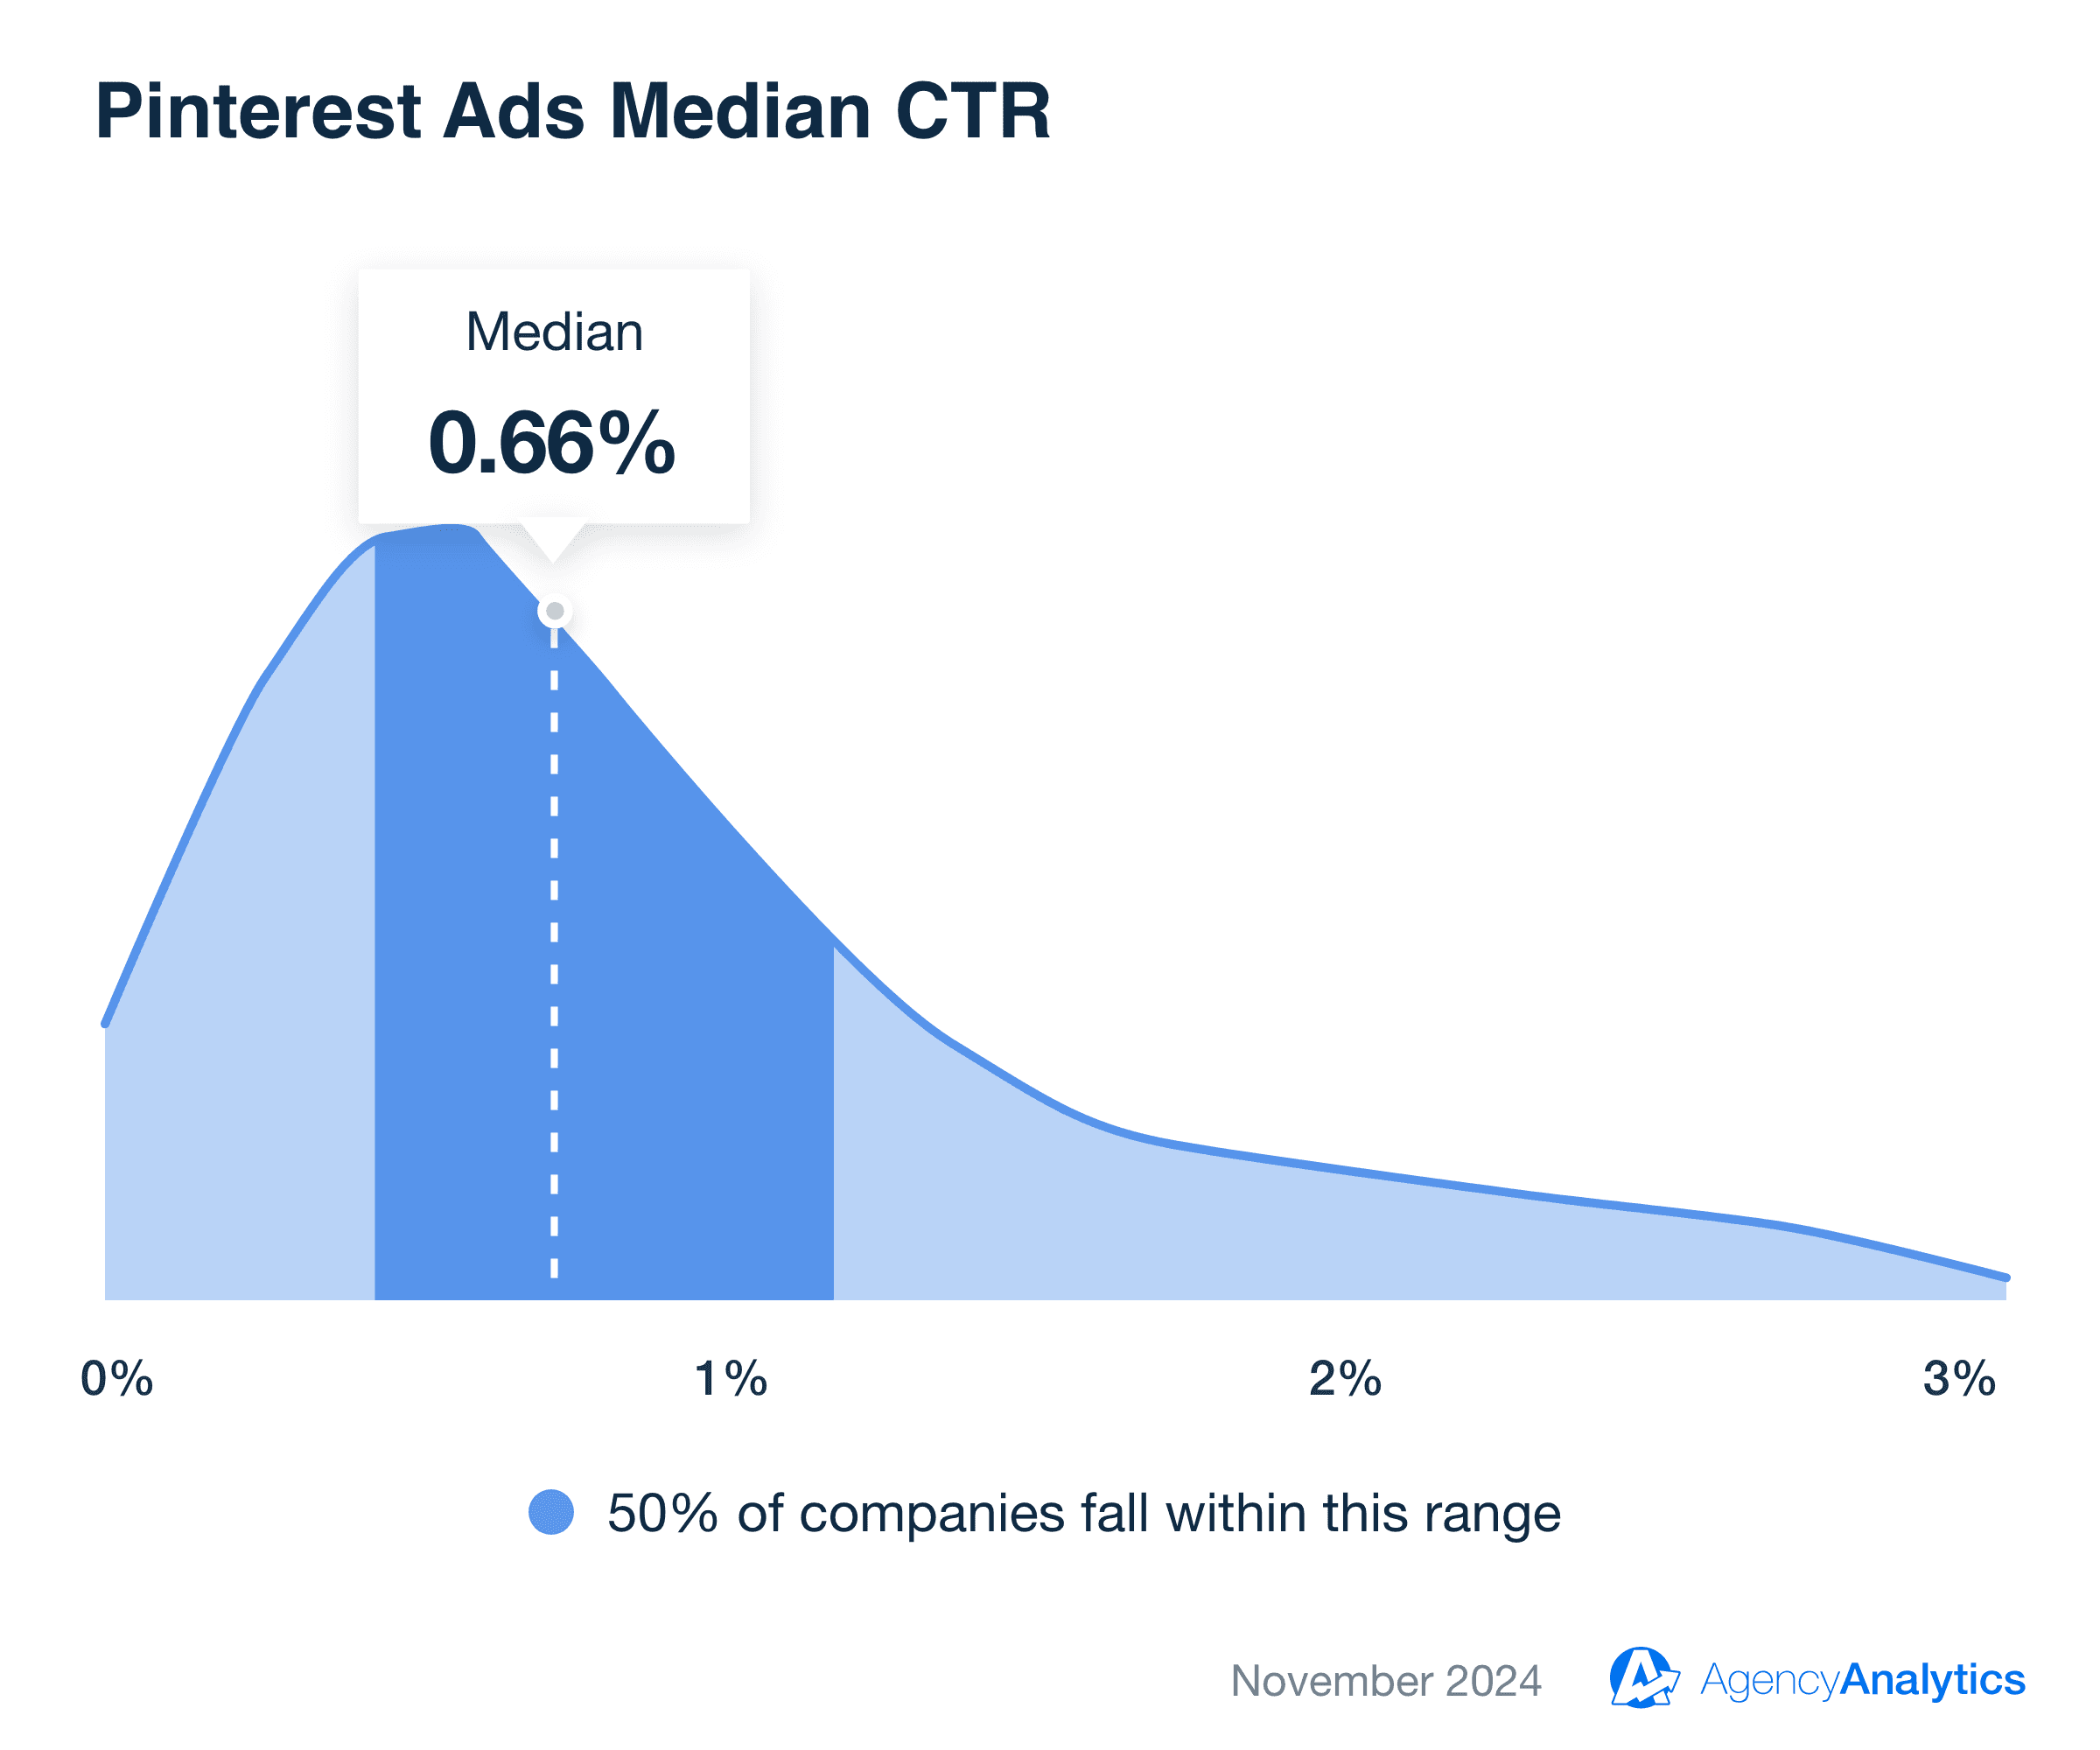
When campaigns fall short of this benchmark, it’s a sign to revisit creative assets or adjust targeting to better align with user interests.
Integrate these benchmarks with your Pinterest Ads reporting to uncover trends and boost campaign effectiveness. Try AgencyAnalytics free for 14 days.
Average CTR for Spotify Ads
Spotify Ads have a median CTR of 0.13%, fitting its focus on audio engagement. While clicks are less common, this platform often supports broader brand-building strategies.
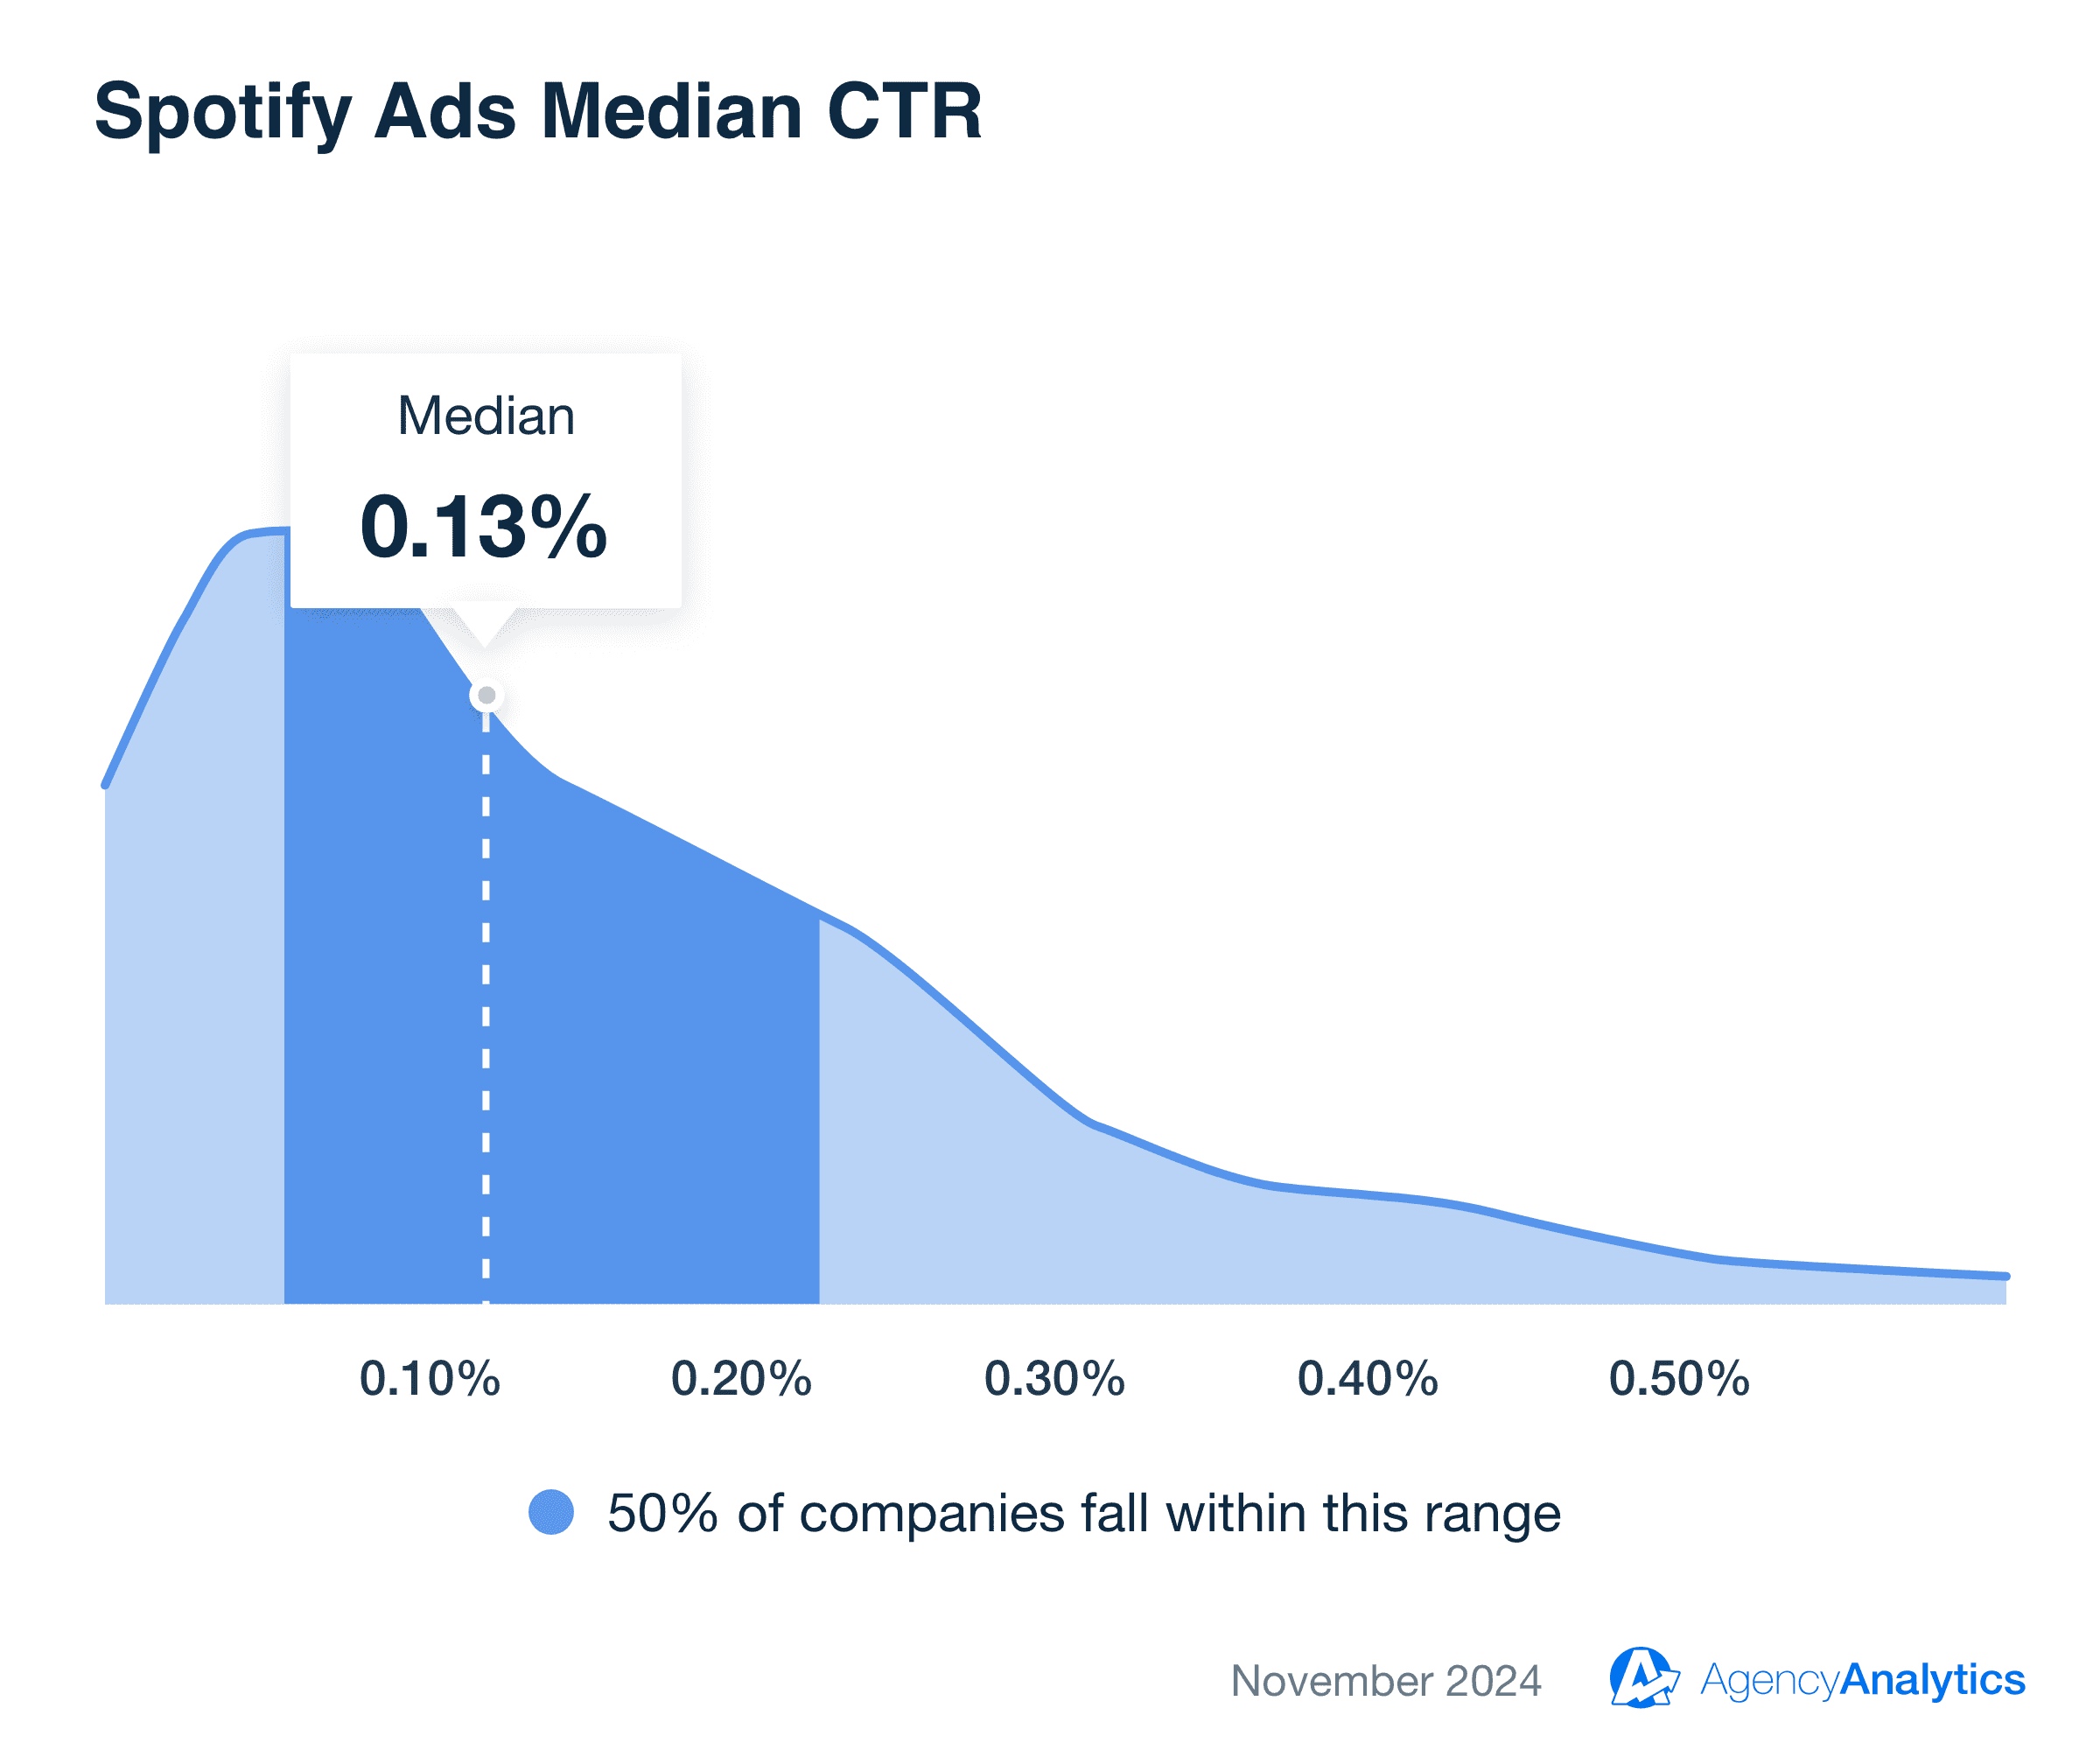
Campaigns below this value may require more engaging audio scripts or integration with other platforms to support overall objectives.
Effortlessly embed these benchmarks into your Spotify Ads reporting tool to track engagement and amplify reach. Try AgencyAnalytics free for 14 days.
How To Interpret CTR Benchmarks
Understanding click-through rate (CTR) benchmarks goes beyond simply comparing numbers. The context behind the data matters just as much as the figures themselves. Interpreting CTR benchmarks correctly helps identify opportunities for optimization while also preventing overreactions to results that seem unusually high or low.
When a Low CTR Isn’t Always Bad
A low CTR isn’t inherently negative, especially in specific scenarios where fewer clicks deliver strong results. For example, lower CTRs are common in high-value niches with competitive costs-per-click (CPCs). This often happens in legal services or real estate industries, where a single conversion can justify a higher ad spend.
Search intent plays a significant role here. Campaigns targeting users with informational queries—common in the search network—may naturally see fewer clicks than transactional searches. Similarly, branded keywords often generate higher CTRs, but top-of-funnel terms with lower engagement still play a part in a broader awareness strategy.
When a High CTR Might Signal Potential Problems
While a high average CTR is often seen as positive, it’s not always a sign of success. If ad targeting is too broad or lacks explicit qualifiers, a campaign might attract clicks from the wrong audience. These irrelevant clicks inflate CTR but fail to convert, wasting ad spend.
For example, if Facebook ad CTRs appear unusually high but the conversion rate is low, it may indicate a mismatch between the ad's promise and the landing page experience. This is particularly common with video ads, where engaging content draws attention but fails to deliver meaningful results if the audience isn’t well-targeted.
Using Benchmarks To Identify Opportunities for Optimization
CTR benchmarks aren’t just for evaluation—they’re tools to refine performance. By comparing results to industry standards, marketers identify areas for improvement. For instance:
Low CTR on Google Search Ads: If CTRs are below benchmarks for the search network, it may point to issues with ad copy, search intent alignment, or ad viewers not finding the offer compelling. Adjusting keywords to include more precise, action-oriented terms—or refining non-branded keywords—can drive better engagement.
High CTR With Low Conversions: A high average CTR but a poor conversion rate suggests the need to adjust audience segmentation or review the call-to-action. Ensuring that clicks lead to a relevant and seamless user experience improves ROI.
Platform-Specific Strategies: Benchmarks for platforms like Facebook and Google differ significantly. Evaluating CTRs within their unique contexts—such as Facebook ad CTRs versus Google search ads—ensures meaningful comparisons and targeted optimizations.
By understanding the nuances of CTR benchmarks, marketing teams align expectations with campaign goals and make smarter decisions about PPC advertising strategies. Benchmarks serve as guideposts, not rigid rules, enabling better resource use and a clearer focus on what drives success.
Using Benchmarks to Position Your Agency
Data-driven results aren’t just for your clients—they’re a powerful way to showcase your agency’s expertise. By combining industry benchmarks with your agency’s performance metrics, you’ll highlight how your campaigns consistently outperform the competition.
For example, include marketing benchmarking data in case studies on your website to demonstrate that your Google Ads campaigns achieve a click-through rate well above the 4.99% median. Or, use it in email marketing campaigns to show potential clients how your Facebook ad CTRs crush the 1.77% standard. These comparisons create instant credibility and set you apart as a results-focused agency.
With the right benchmarks, your agency isn’t just another option—it’s the clear choice for driving exceptional performance.

Written by
Paul Stainton is a digital marketing leader with extensive experience creating brand value through digital transformation, eCommerce strategies, brand strategy, and go-to-market execution.
Read more posts by Paul StaintonSee how 7,000+ marketing agencies help clients win
Free 14-day trial. No credit card required.


