Amazon Ads Dashboard
What is an Amazon Ads Dashboard?
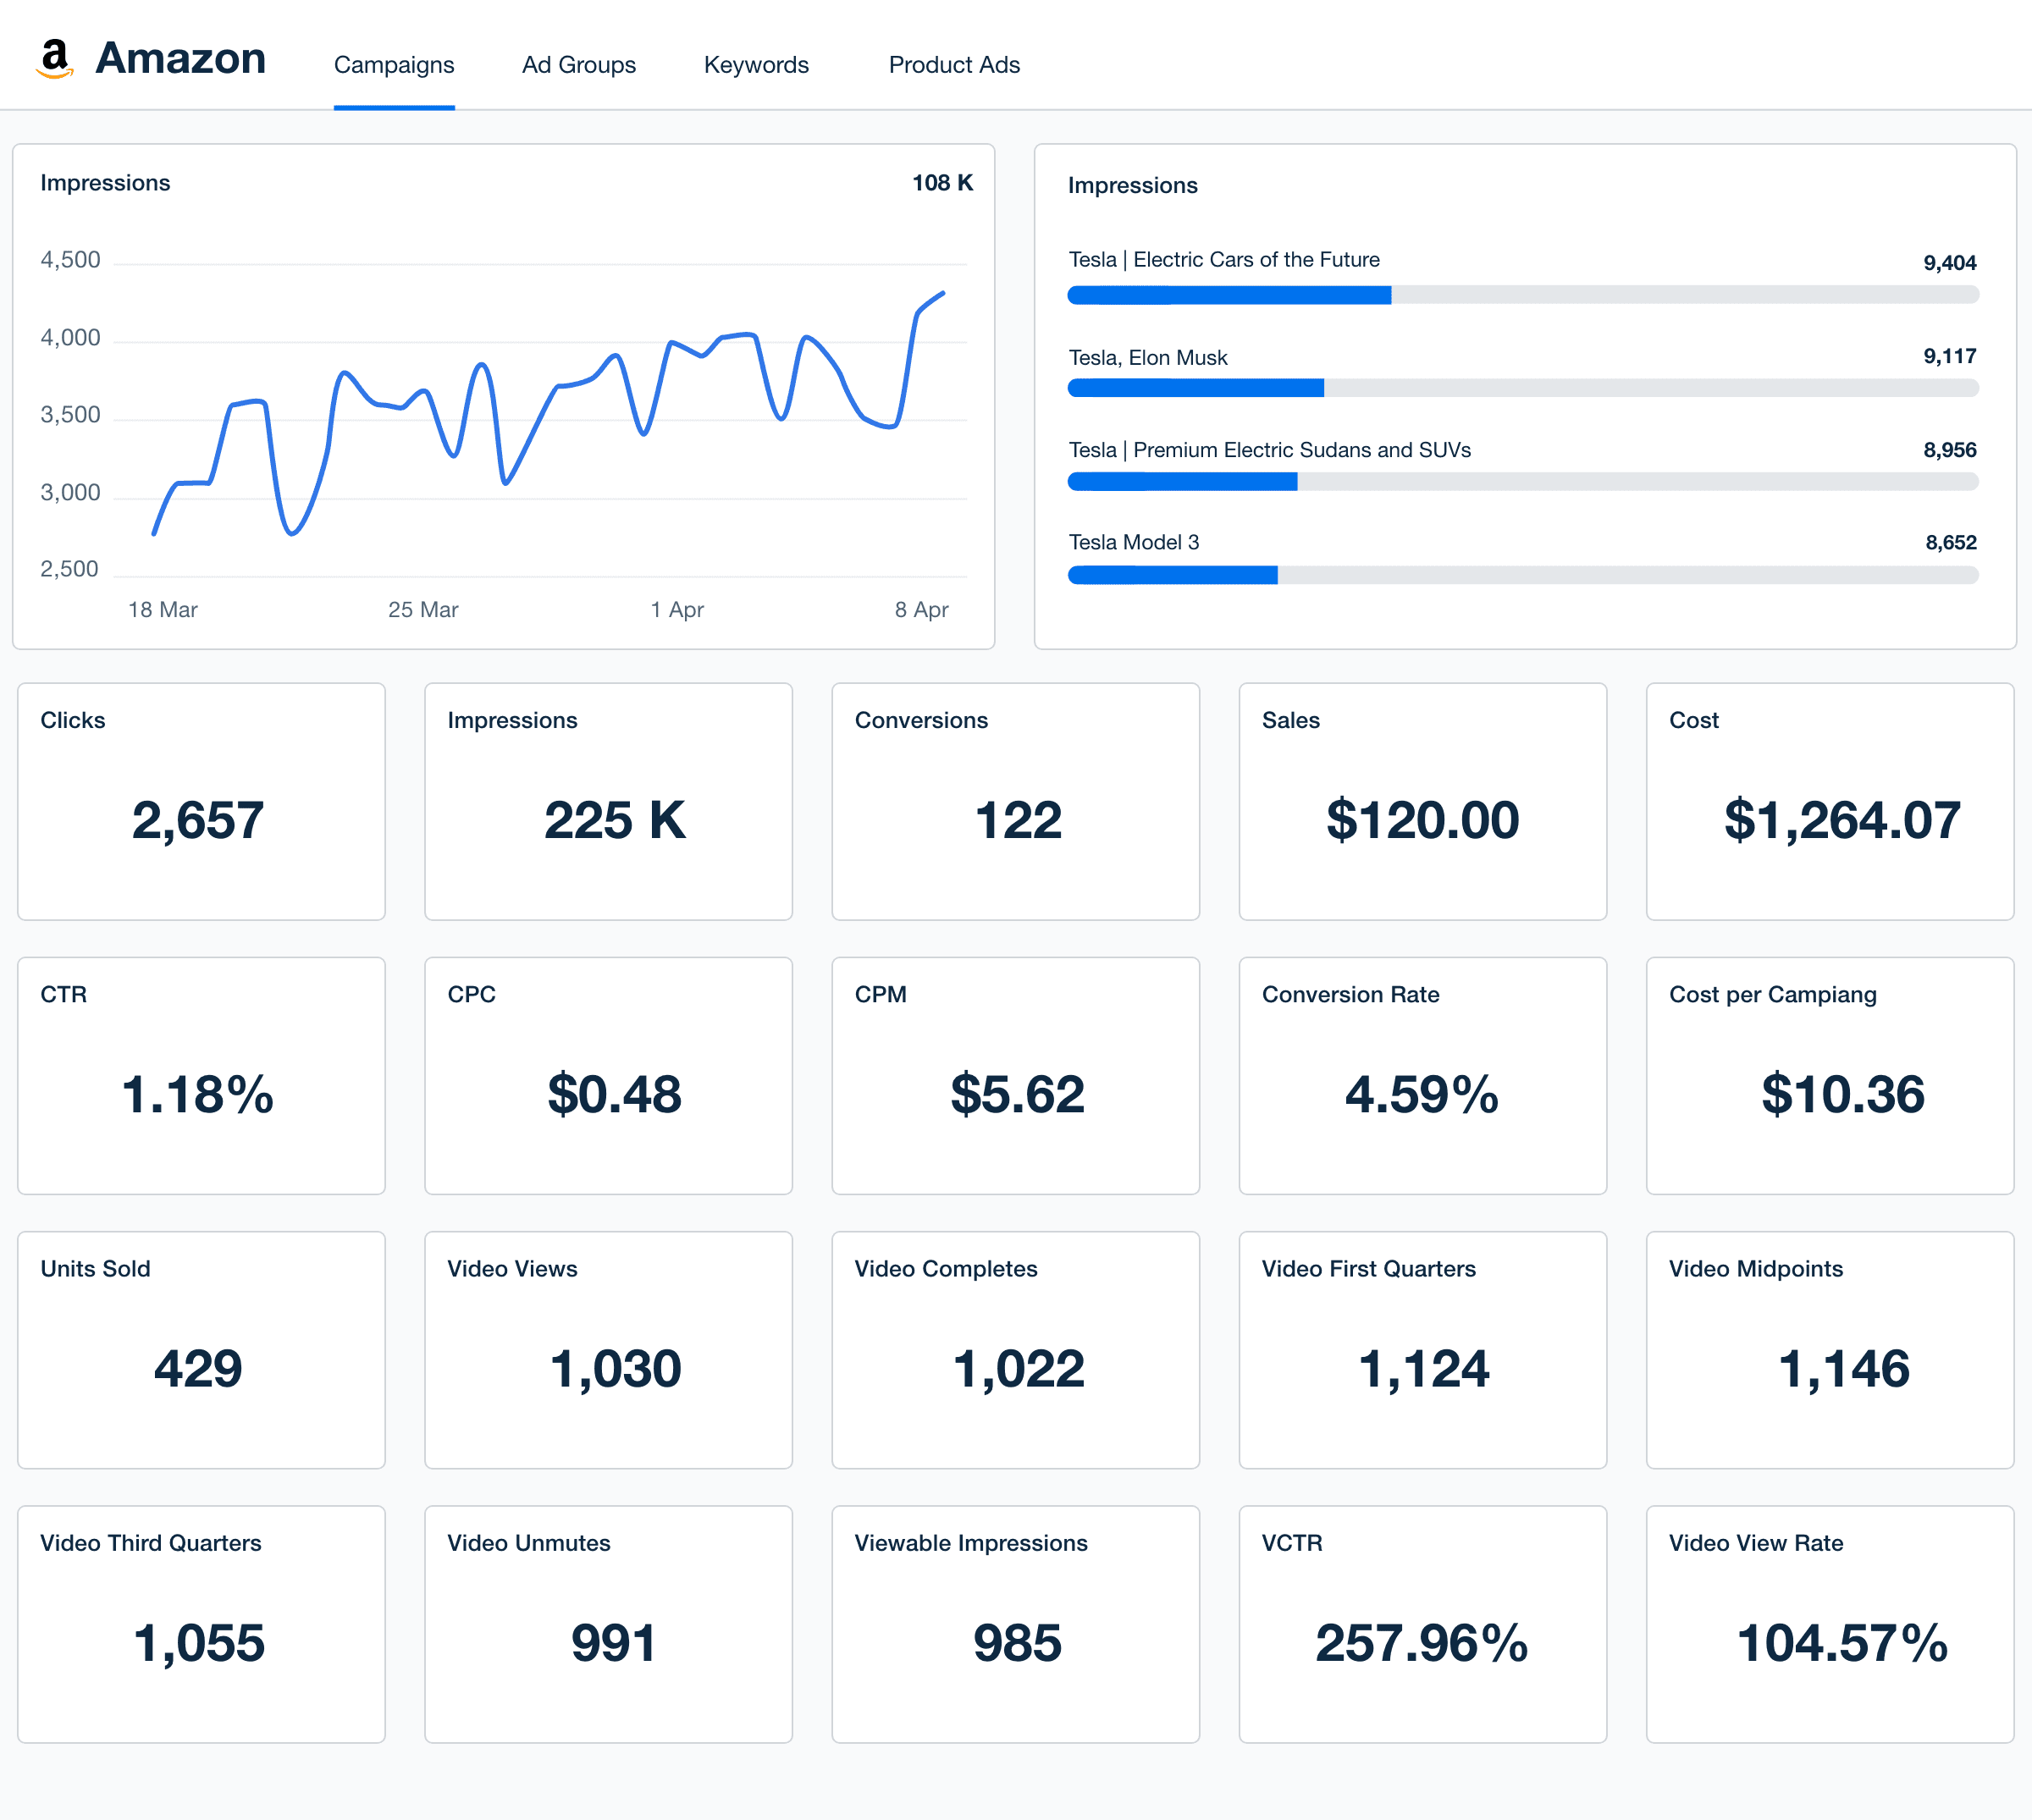
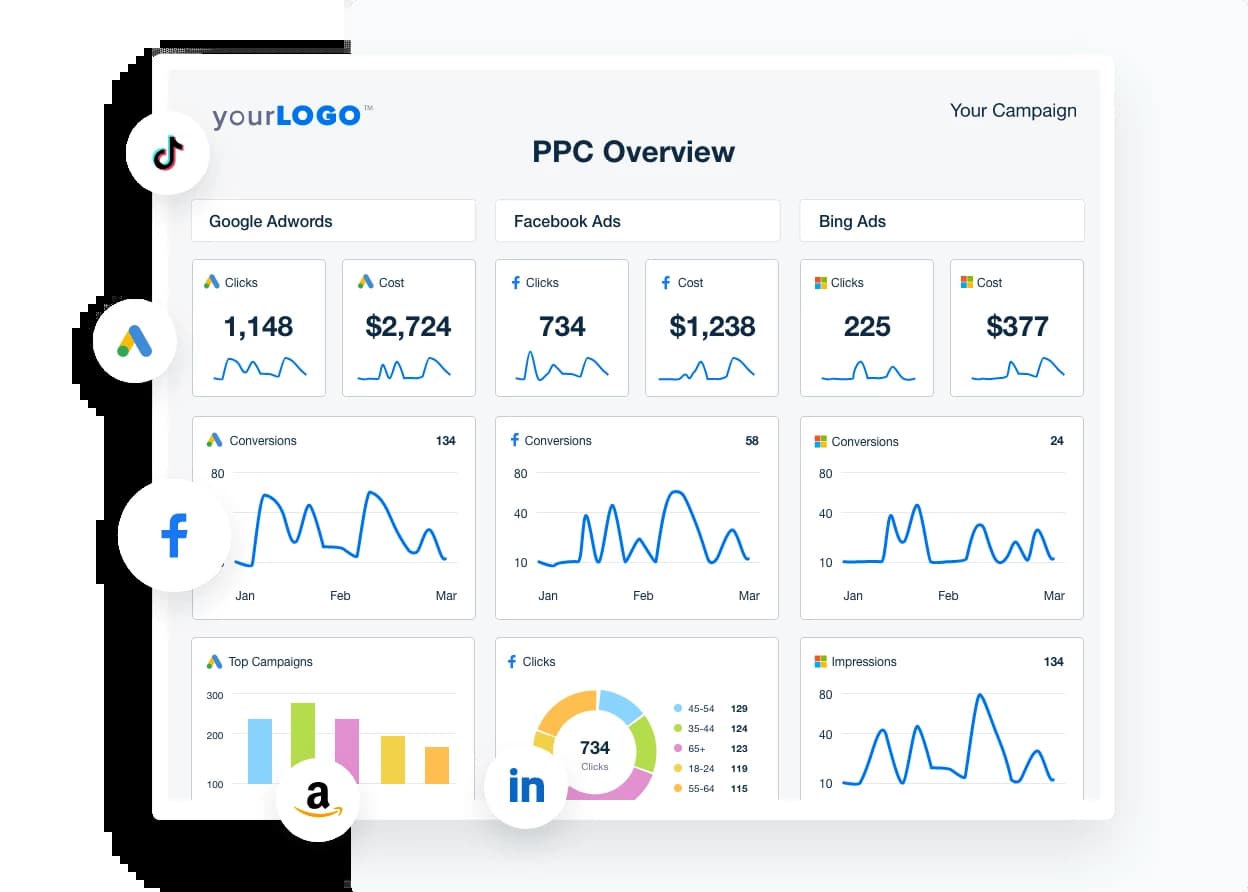
A white label Amazon Ads Dashboard is a customizable reporting tool designed for marketing agencies to track and present essential KPIs related to Amazon Ads campaigns. By branding the dashboard with the agency’s logo and colors, agencies provide clients with a seamless and professional reporting experience.
This dashboard helps agencies easily monitor key metrics, streamlining the process of optimizing campaigns and demonstrating value to clients.
Why Your Agency Needs an Amazon Ads Analytics Dashboard
Your agency deserves more than standard client reports. An Amazon Ads analytics dashboard is a central information hub providing a customizable, user-friendly solution that elevates your client relationships and boosts your advertising efforts. This tool presents the key Amazon ads metrics your clients care about in a visually engaging format.
Tailor every report to match your client’s branding, ensuring a seamless, professional experience. Clearly and concisely highlight the most relevant KPIs: advertising cost, sales performance, conversion rates, and return on ad spend (ROAS) for Amazon sellers. This customizability enhances clients' understanding of their campaigns and positions your agency as a knowledgeable and reliable partner.
The dashboard’s intuitive design simplifies the extraction of actionable insights, enabling your team to make informed decisions swiftly. Say goodbye to sifting through endless spreadsheets—everything you need is at your fingertips, presented in a way that makes sense to you and your clients.
Make it faster and easier for your agency to demonstrate its value with precision and clarity. Streamline the reporting process, enhance transparency, and foster stronger client relationships with an Amazon Ads analytics dashboard. Stand out as a strategic, insightful partner by delivering customized, meaningful insights that drive more sales and optimize ad campaigns.
11 Sections To Include in an Amazon Ads Dashboard
A well-structured Amazon Ads dashboard not only simplifies the complexity of client reporting but also highlights the most critical performance indicators, enabling agencies to deliver more focused and impactful reports to their clients.
By tailoring each section to address different aspects of the campaign, you can provide a holistic view that drives better decision-making and optimizes ad performance.
1. Impressions
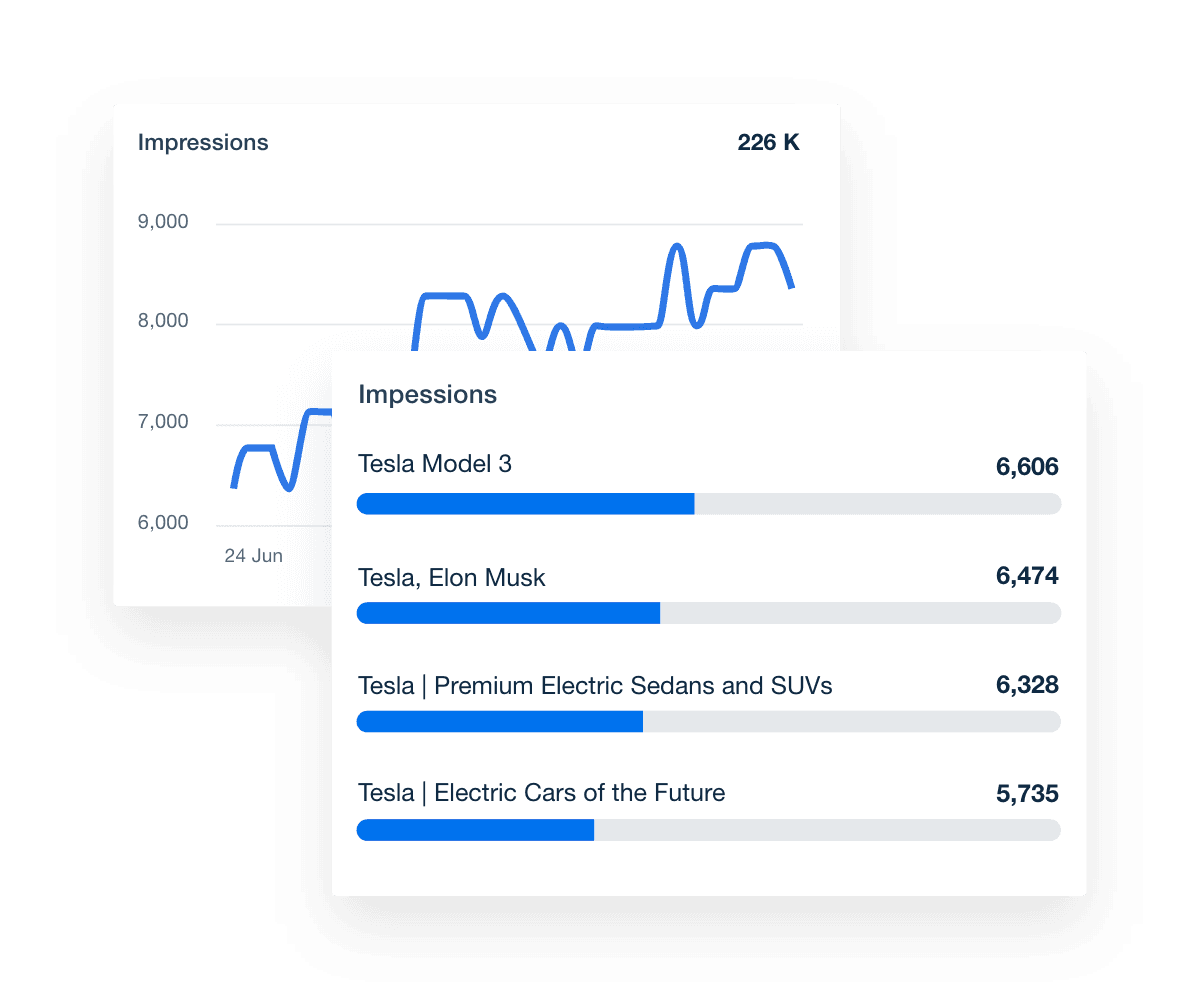
Impressions are a critical metric that represents the number of times your clients’ ads are shown to users. They offer a snapshot of the ad campaign’s reach and visibility and play a pivotal role in evaluating the effectiveness of your advertising efforts.
Including impressions in your Amazon advertising dashboard is essential for showcasing the value your agency provides to clients. This metric helps illustrate how often ads appear to potential customers, linking directly to overall visibility and brand awareness.
Monitoring impressions within a comprehensive overview dashboard allows your team to decide which individual ads or specific campaigns need adjustments. By understanding the relationship between impressions and other Amazon Ads metrics, your agency optimizes advertising activities, reduces advertising costs, and drives more sales.
2. Clicks
Clicks measure the number of times users interact with your ads by clicking on them, indicating user engagement and interest in your product ads.
Clicks reveal how effective your marketing efforts are in driving traffic to product pages. By tracking clicks, your agency pinpoints which individual ads or specific advertising campaigns generate the most interest, leading to increased Amazon sales. This real-time data allows for swift adjustments to advertising activities (e.g., sponsored products, sponsored ads, and sponsored display ads in PPC campaigns), optimizing performance and reducing advertising costs.
3. Conversions
Conversions are the ultimate metric that shows how often users complete a desired action, such as purchasing after clicking on your clients’ ads. This metric directly reflects the success of your ad campaigns in driving tangible results.
Including conversions in your Amazon Ads analytics dashboard demonstrates the true value your agency provides to clients by showcasing how effective your advertising efforts are at turning clicks into sales. Tracking conversions helps your agency identify which specific campaigns and individual ads are most successful, enabling more precise optimization of advertising activities.
An Amazon Ads dashboard offers a clear overview of conversions from campaigns, ad groups, keywords, or ad formats. By understanding conversion rates, your agency makes informed decisions to enhance Amazon marketing services, improve the performance of individual campaigns, and increase total revenue.
4. Sales
Sales measure how much revenue is generated from an ad campaign, reflecting success in driving purchases and contributing to your client’s bottom line.
Including sales in your Amazon Ads analytics dashboard shows the direct financial results of ad campaigns, helping clients see how their advertising investments lead to real sales. Tracking sales helps identify which specific campaigns and individual ads perform best, allowing for targeted adjustments to boost profitability.
5. Units Sold
Units sold tracks the total number of products sold through your agency’s ad campaigns, offering a precise measure of their effectiveness and impact on sales.
Tracking the total number of products sold through ad campaigns provides agencies with critical data to enhance their marketing strategies, allocate their advertising budget more efficiently, and increase overall sales. With this insight, agencies fine-tune campaigns, focus resources on high-performing ads, and tweak or discontinue underperforming ones to optimize the return on investment.
6. Click-Through Rate (CTR)
Click-through rate (CTR) shows the percentage of users who click on an ad after viewing it, measuring the effectiveness of ads in capturing audience interest.
Including CTR in your Amazon Ads analytics dashboard is vital for assessing ad performance. A high CTR means that ads are compelling and relevant, while a low CTR indicates the need for adjustments. Monitoring CTR helps your agency identify which specific campaigns and individual ads need optimization to improve engagement and drive more traffic to product pages.
7. Cost Per Click (CPC)
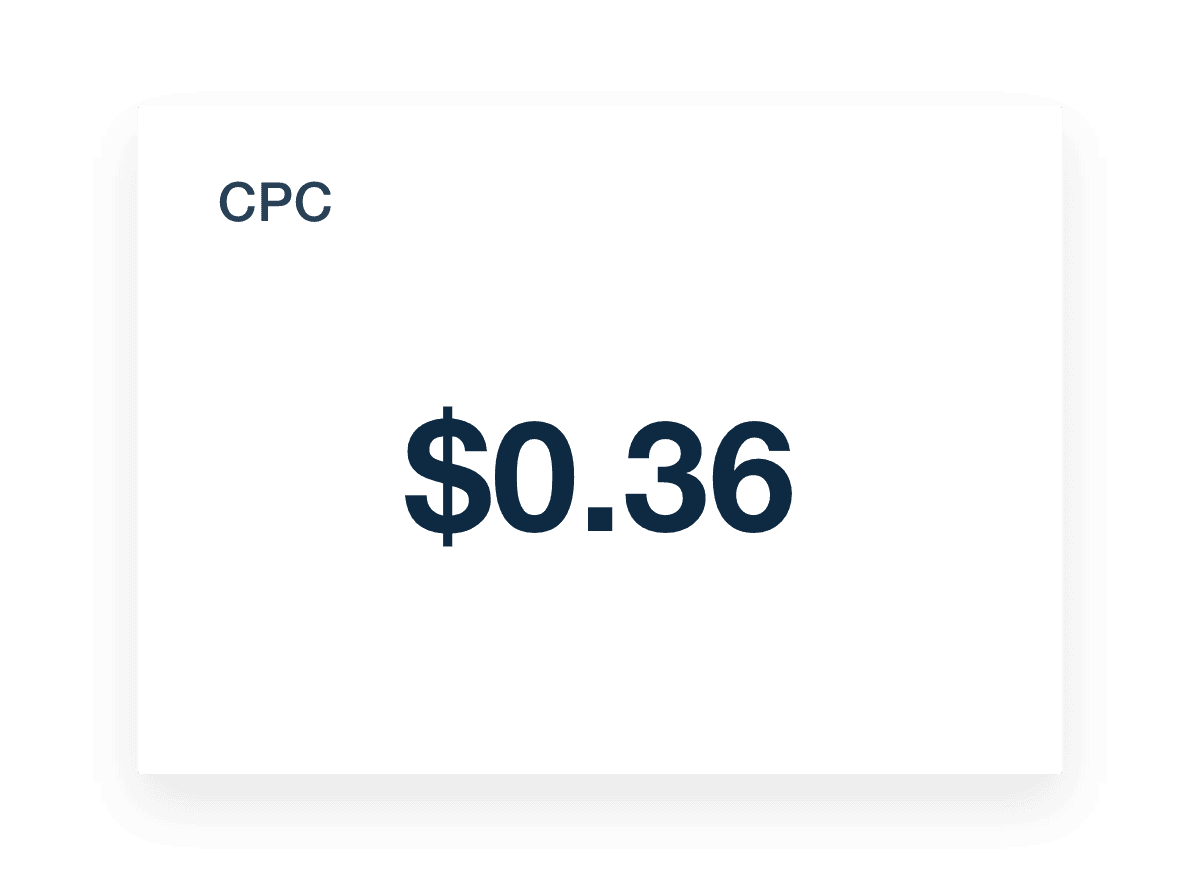
Cost per click (CPC) indicates the amount that must be paid each time a user clicks on an ad. This metric is crucial for managing your client’s advertising budget and measuring the cost-effectiveness of ad campaigns.
Including CPC in your Amazon Ads analytics dashboard helps track and optimize ad spend. A low CPC means clients get more clicks for their budget, while a high CPC may require adjustments to improve cost efficiency. Monitoring CPC helps your agency evaluate the financial performance of specific campaigns and individual ads, ensuring that advertising costs are controlled and optimized.
8. Cost Per Thousand Impressions (CPM)
Cost per thousand impressions (CPM) measures the cost of showing an ad 1,000 times. It evaluates how efficiently you’re reaching your client’s audience.
Including CPM in your Amazon Ads marketing dashboard helps track the cost-effectiveness of ad campaigns. A lower CPM means you’re getting more exposure for less money, while a higher CPM means your strategy needs adjustments. Monitoring CPM ensures your advertising budget is used wisely, maximizing ad reach.
9. Conversion Rate
Conversion rate measures the percentage of users who complete a desired action, like making a purchase, after clicking on an ad. This metric is crucial for assessing the effectiveness of ad campaigns in driving valuable actions.
A high conversion rate indicates that ads effectively turn clicks into sales or other desired actions, while a low conversion rate signals the need for campaign optimization. Monitoring this metric helps your agency pinpoint which specific campaigns and individual ads are performing best, enabling targeted improvements to boost client performance.
10. Cost Per Conversion
Cost per conversion measures the amount spent to achieve a single conversion, such as a sale. This metric is vital for understanding the efficiency of ad campaigns in generating valuable actions at a reasonable cost.
A lower cost per conversion indicates that ads efficiently drive conversions at a lower expense, while a higher cost suggests the need for campaign adjustments. Monitoring this metric helps your agency assess the financial performance of specific client campaigns and individual ads, ensuring that advertising budgets are used wisely.
11. Goal Tracking
Incorporating goal tracking into an Amazon Ads dashboard showcases progress toward client objectives. It offers a transparent view of how ad campaigns align with established targets, enabling agencies to highlight their impact and adjust strategies as needed to meet client expectations and drive meaningful results.
Creating relevant KPI goals for an agency and its clients is essential for measuring success and optimizing strategies. Here are some best practices:
Align With Client Objectives: Ensure goals reflect the client’s business priorities and desired outcomes.
Use Clear Metrics: Choose specific, quantifiable KPIs that accurately measure performance.
Regularly Review and Adjust: Continuously monitor progress and adjust goals to stay on track.
Customizable Dashboards To Meet Client Needs
Include all the metrics from your client's marketing platforms to build a comprehensive reporting dashboard. Use the drag-and-drop editor to easily customize and tailor client dashboards and track all the vital data points from a single interface.
Further, enhance your reporting and client onboarding with Smart Dashboards. In just 11 seconds, create and save custom dashboards perfectly tailored to a client’s unique needs, objectives, and marketing platforms.
Streamline Reporting With Amazon Ads Dashboards and Focus on What Matters
Amazon Ads dashboards allow agencies to focus on what truly matters—crafting winning campaigns and earning client trust. These dashboards provide an efficient, centralized way to manage and present key metrics, ensuring clear communication and data-driven decision-making.
Automated reporting platforms and customizable dashboard templates offer scalability that grows with your agency. By leveraging these tools, you quickly generate detailed reports tailored to each client’s needs, reducing the time spent on manual data entry and analysis. The drag-and-drop editor simplifies the process of creating visually engaging, comprehensive dashboards that showcase your agency’s impact.
With pre-built templates, setting up new client dashboards becomes a breeze, allowing for consistent and professional reporting across all accounts, saving time, and enhancing the accuracy and reliability of your reports.
The drag-and-drop interface is absolutely brilliant. Having all of our resources in one place combined with a swift report-building tool has cut the time it takes to build custom dashboards and reports in half!
Custom Amazon Ads Dashboards as Unique as Your Agency
Instantly Access All Your Clients’ Amazon Ads Data
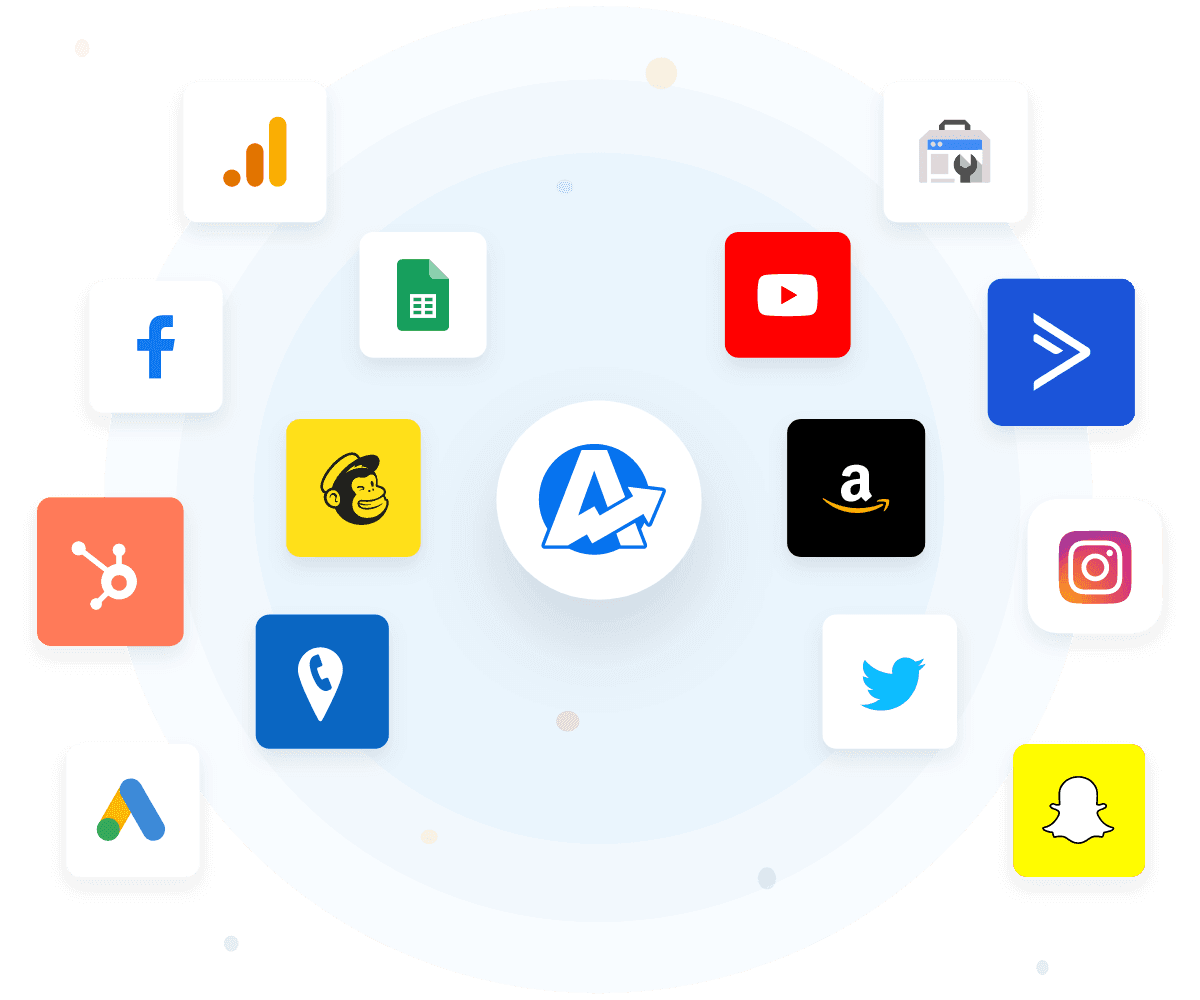
Easily connect and manage data from the Amazon Ads integration alongside key metrics from more than 80 marketing platforms in one centralized location. Streamline your workflow, making it simple to monitor and analyze all your marketing efforts, from Amazon, Facebook, Google Ads, and more.
With every data point readily accessible, quickly generate comprehensive reports, optimize campaigns, and demonstrate your value to clients with precision and clarity.
White Label Your Amazon Ads Dashboards
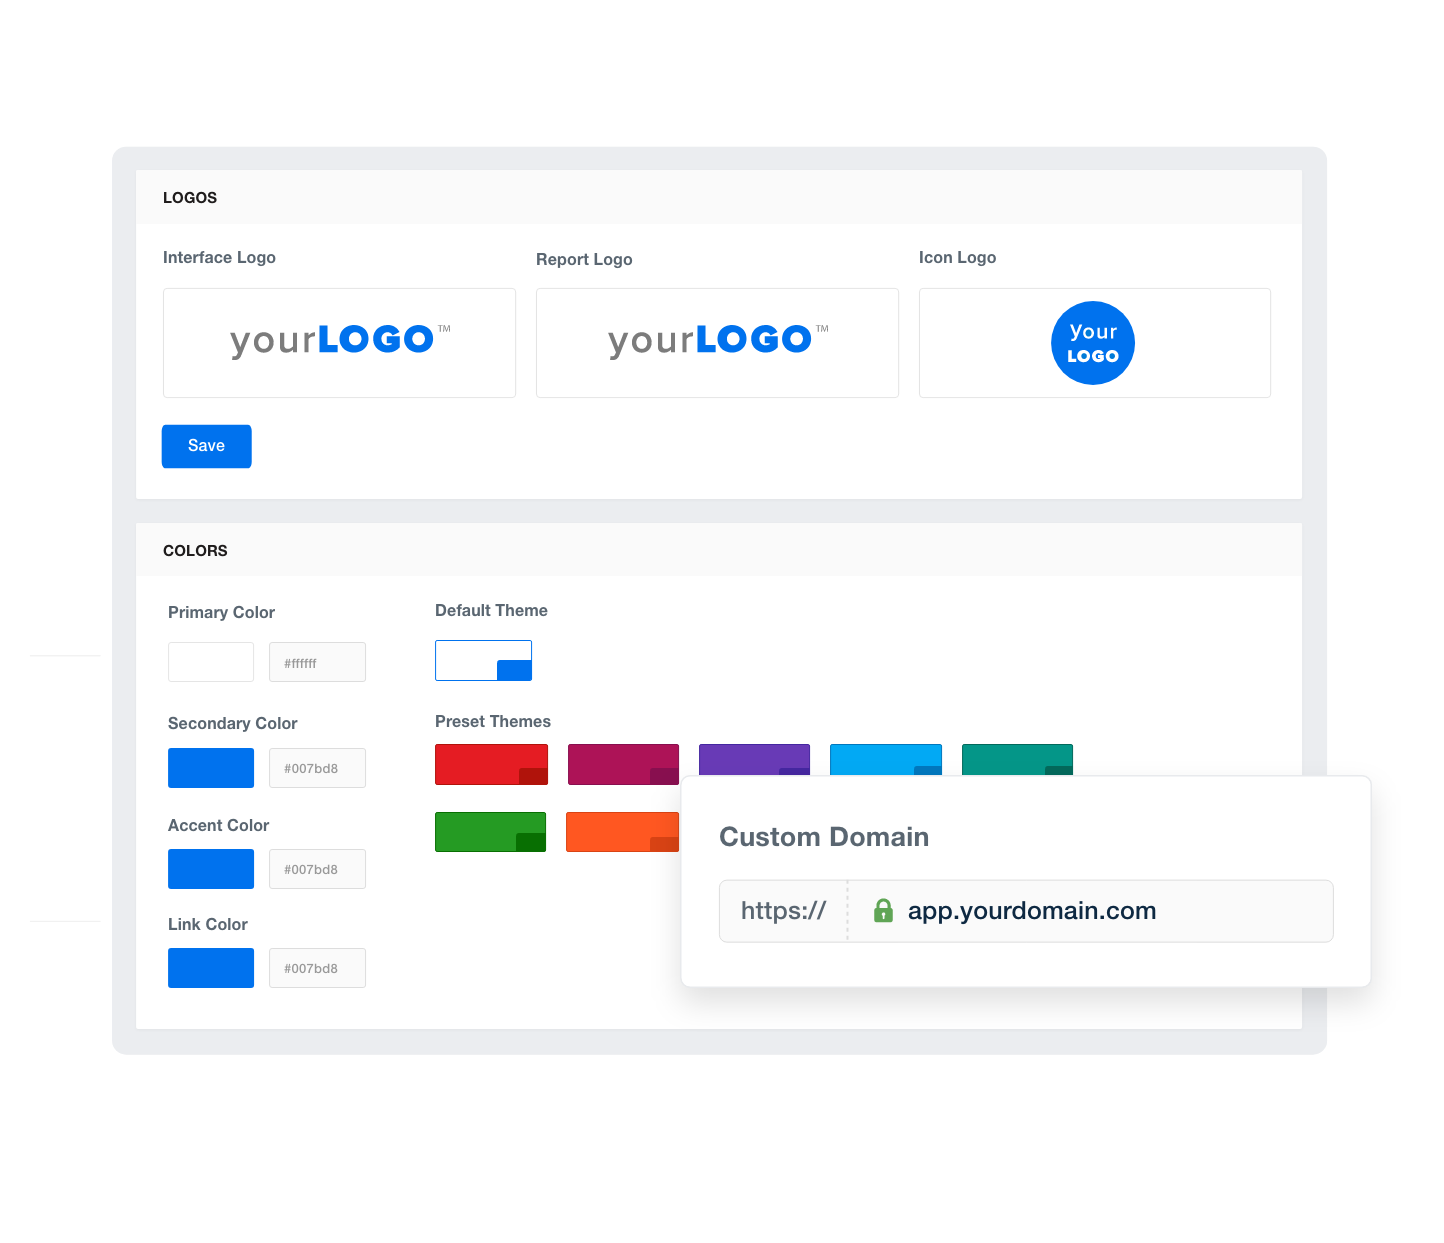
White label your Amazon Ads dashboards to present data under your own brand. Customize dashboards with your logo and colors to reinforce your brand identity and deliver your clients a seamless, professional experience. Build trust and credibility by making it clear that your agency is the driving force behind the insights and results presented.
Provide Granular Insights With Custom Metrics
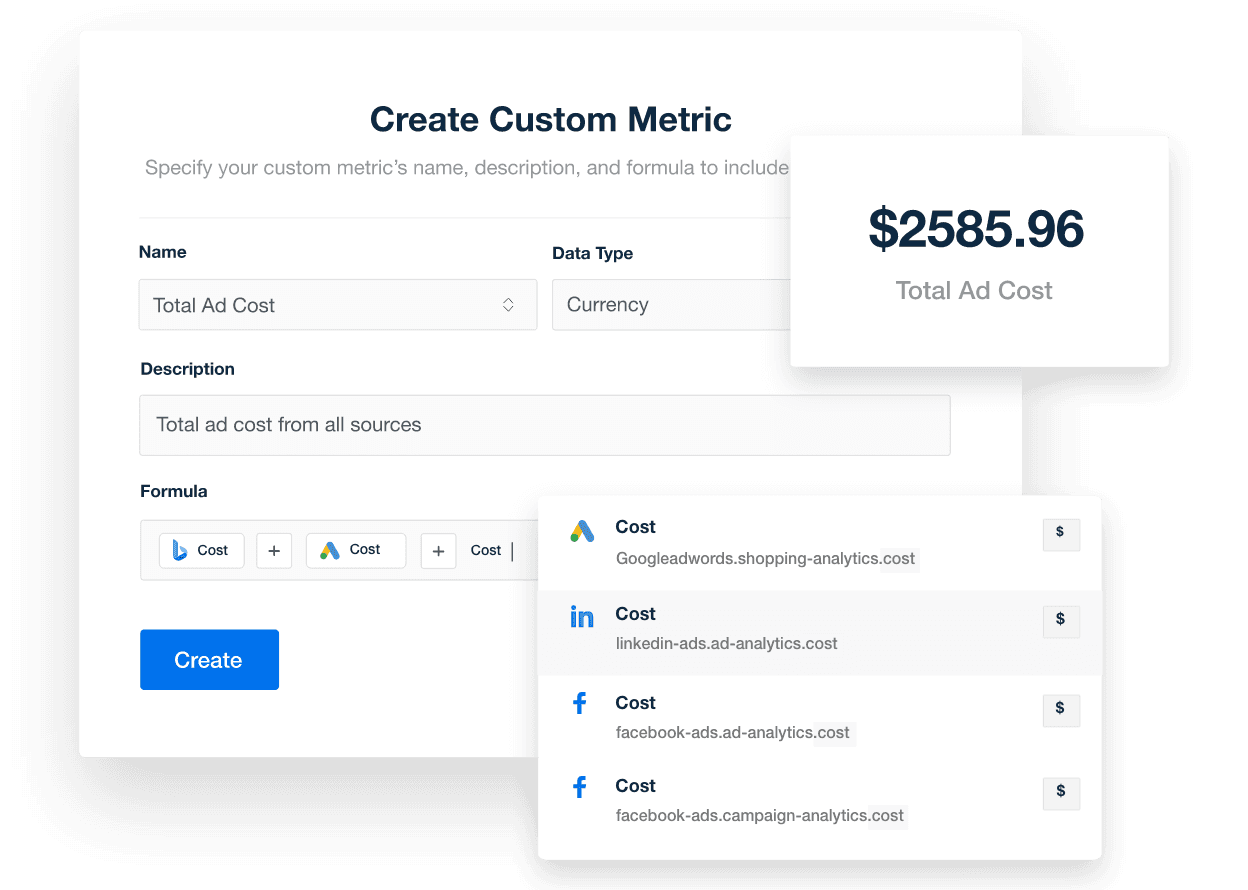
Create custom metrics to deliver granular insights tailored to your clients’ needs. Customize your Amazon Ads dashboards to highlight the most relevant data points, giving your clients a clear understanding of their campaign performance.
Monitor All Your Clients at a Glance
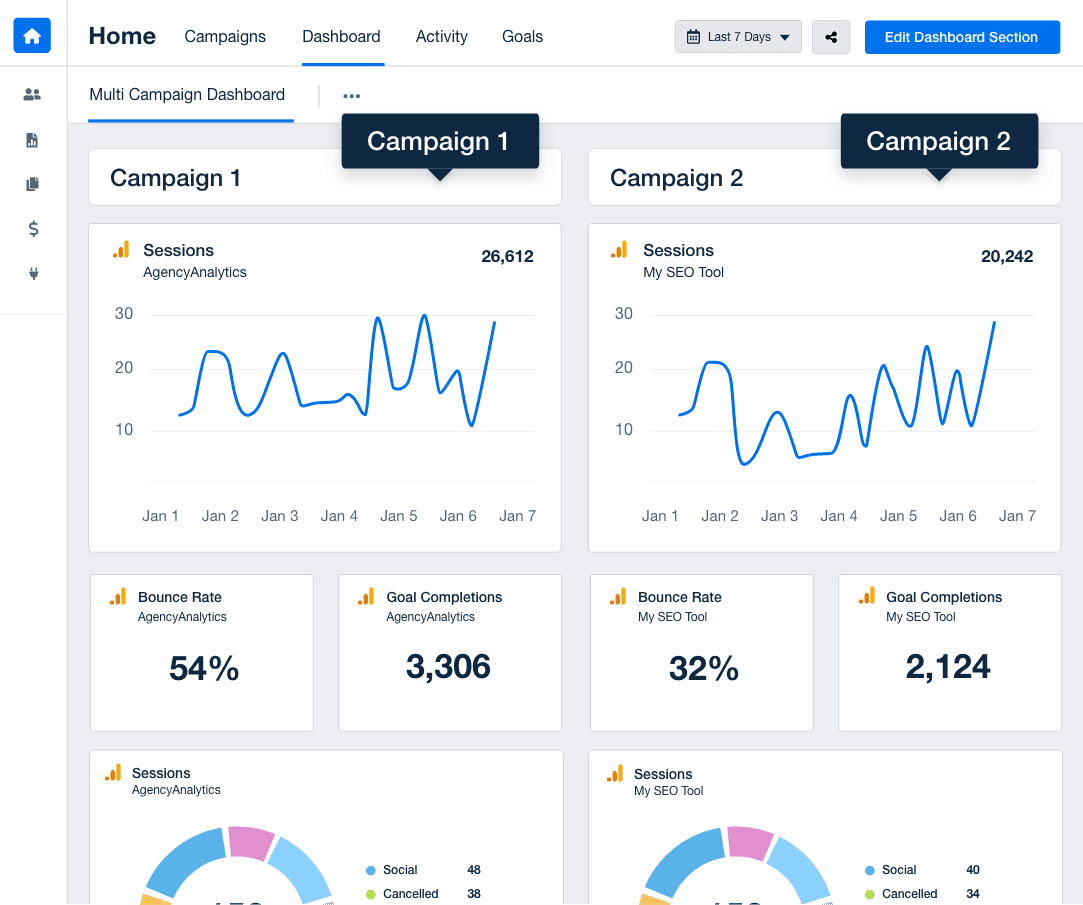
Monitor all your clients’ campaigns with a single view. Track multiple accounts simultaneously, ensuring no detail goes unnoticed. Streamline client management by quickly accessing key metrics and performance data, providing timely updates, and making informed decisions to optimize advertising strategies and maximize results.
Customer Support is Our Top Priority
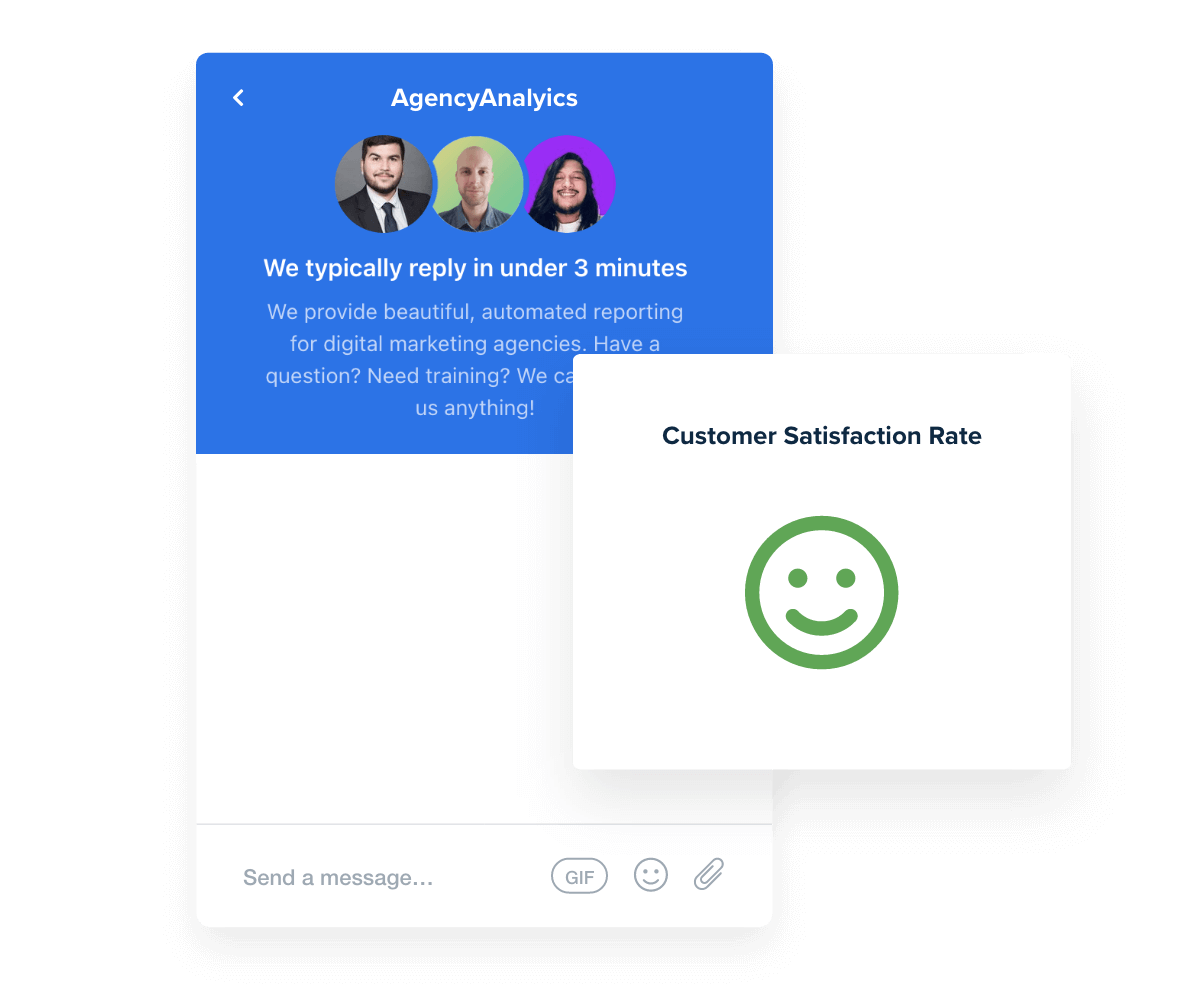
Get unparalleled support tailored to your agency with round-the-clock assistance. Our live chat operates 24/5, ensuring your queries are addressed within an impressive 3-minute response time. With a satisfaction rate consistently above 95%, our expert support team excels in guiding you through creating Amazon Ads dashboards and more, ensuring your agency delivers top-tier services to clients. Count on immediate, quality support as our commitment to your success.
You care about your client’s success. We care about yours.
Report Smarter. Not Harder.
Save time by automatically integrating the most critical Amazon Ads data and metrics from over 80 other platforms in one centralized dashboard.
Pull key metrics from Amazon Ads, Google Analytics, Facebook Ads, and more to provide clients with a comprehensive view of their advertising performance.
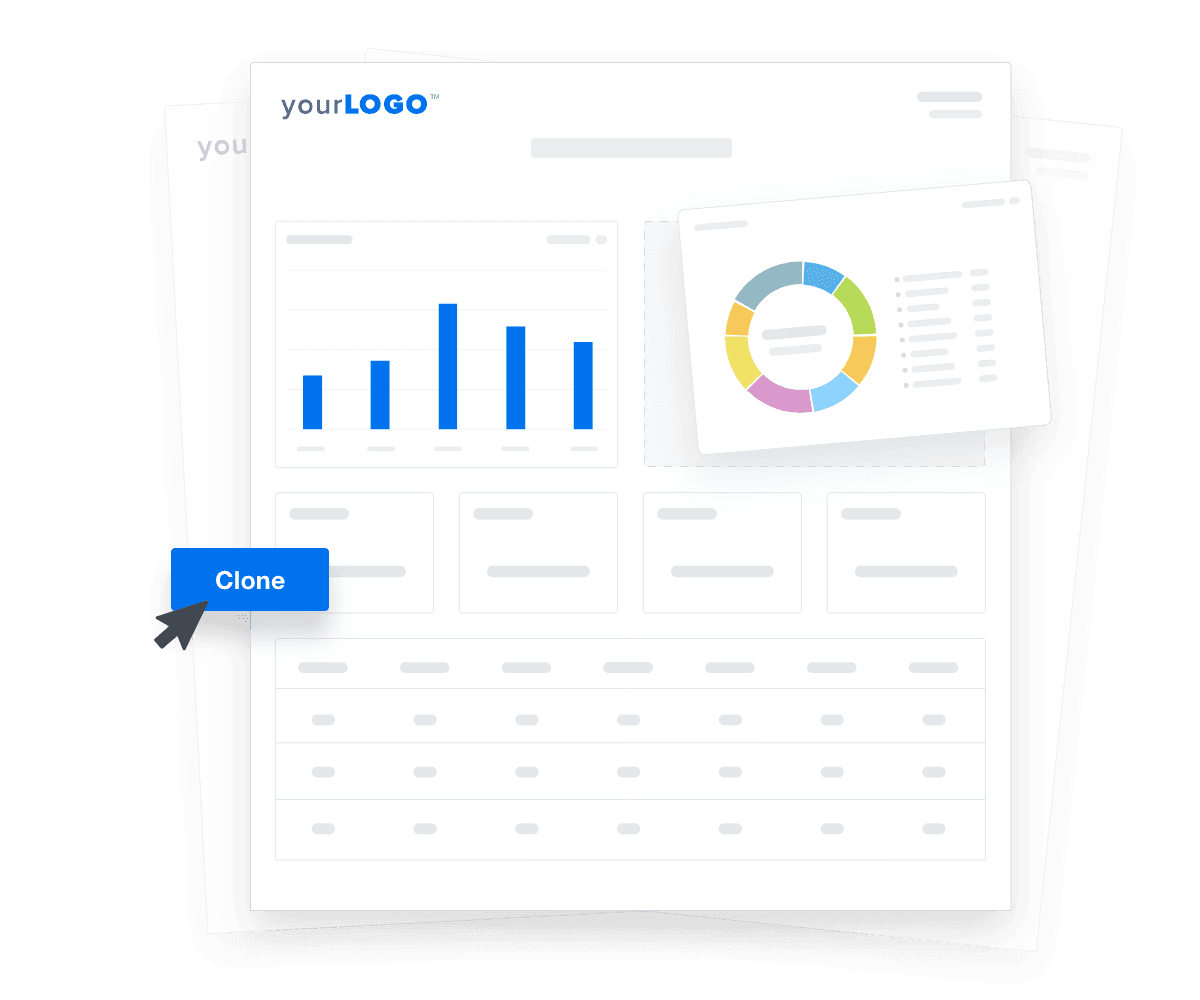
Customize each Amazon Ads dashboard and quickly clone them to expedite client onboarding. Use the time saved on reporting and data visualization to focus on growing your agency and delivering exceptional results.
AgencyAnalytics is clearly a game-changer. It has streamlined our reporting process, saving us invaluable time and significantly enhanced client satisfaction. The intuitive interface and detailed insights offered are second to none. AgencyAnalytics is an indispensable tool for any forward-thinking agency.