Facebook Ads Dashboard
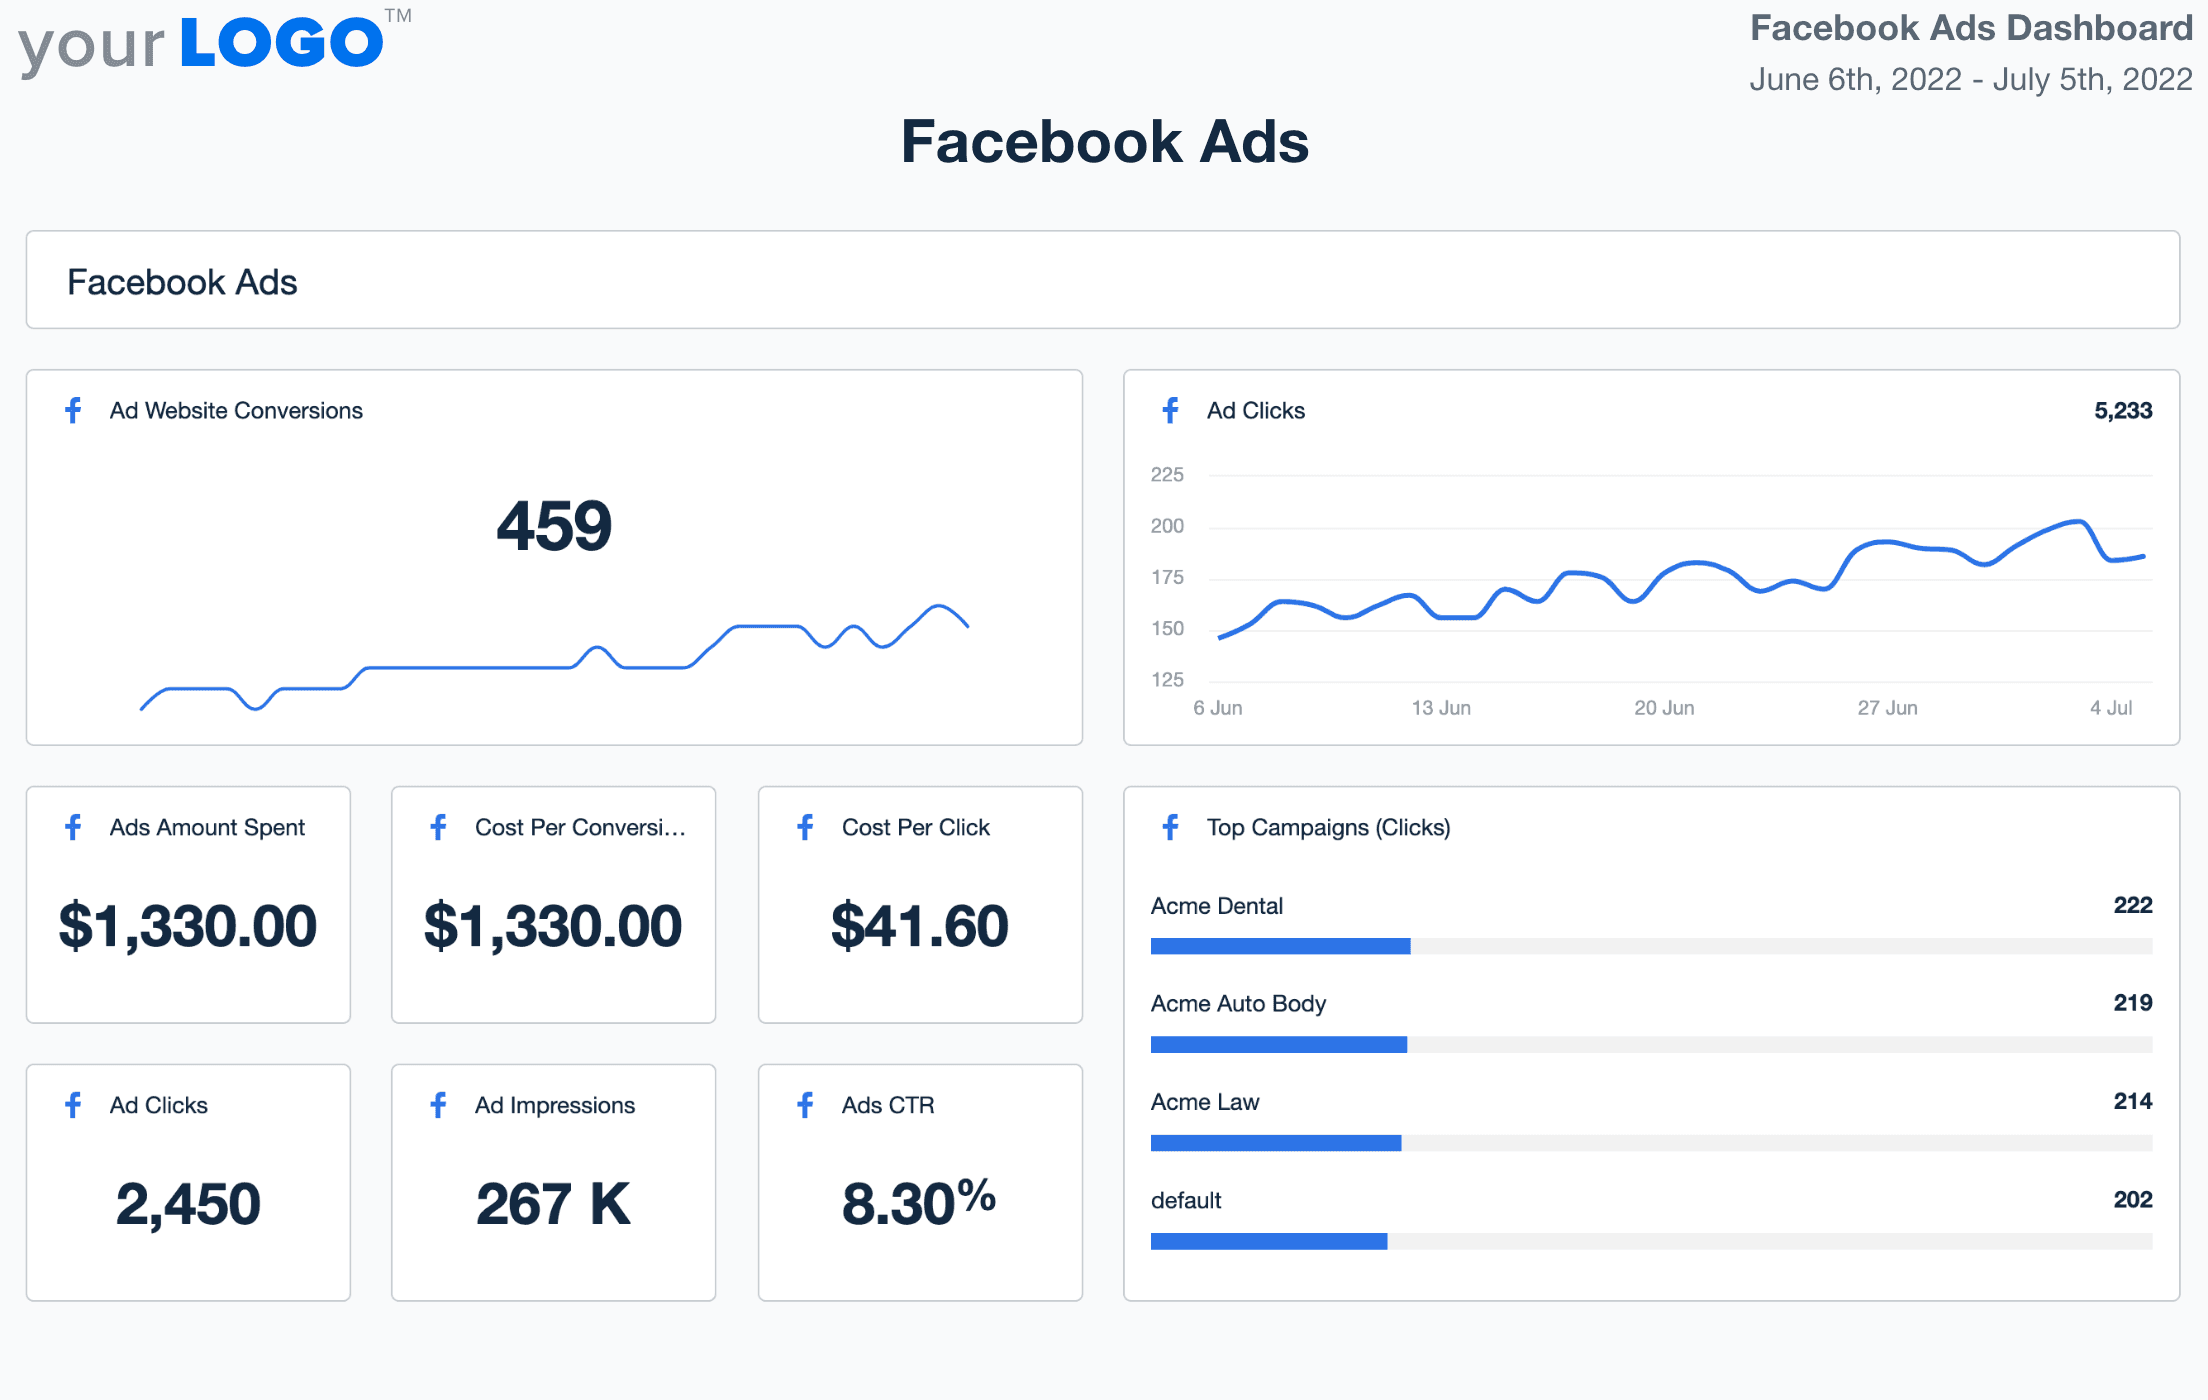
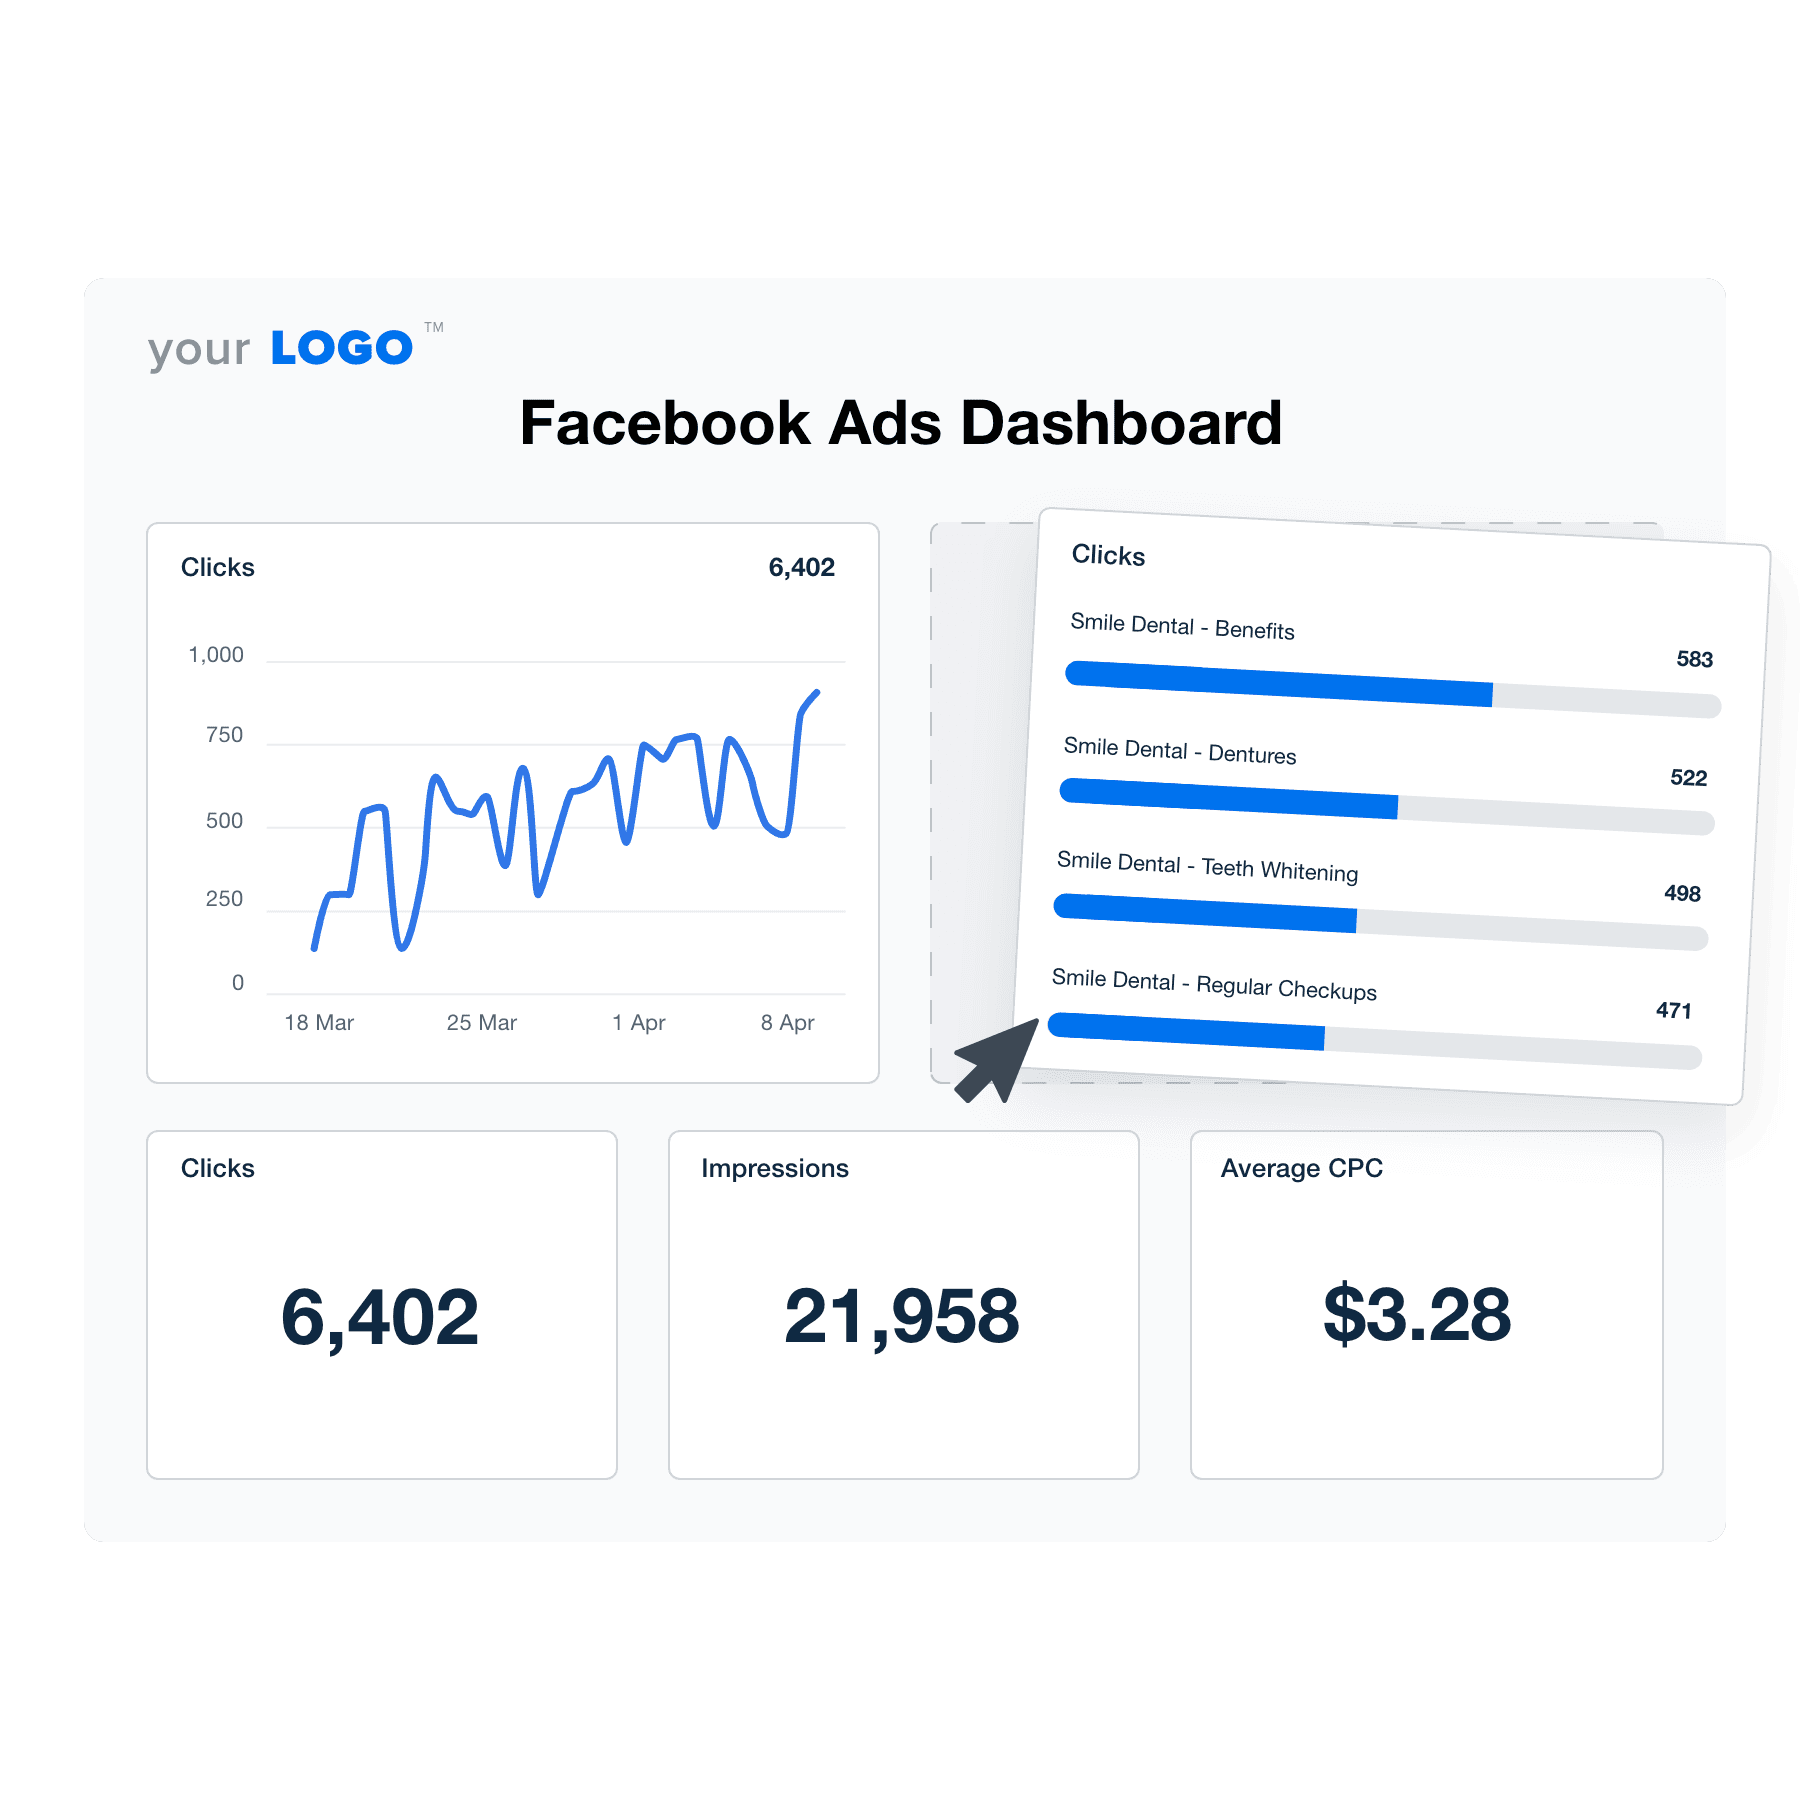
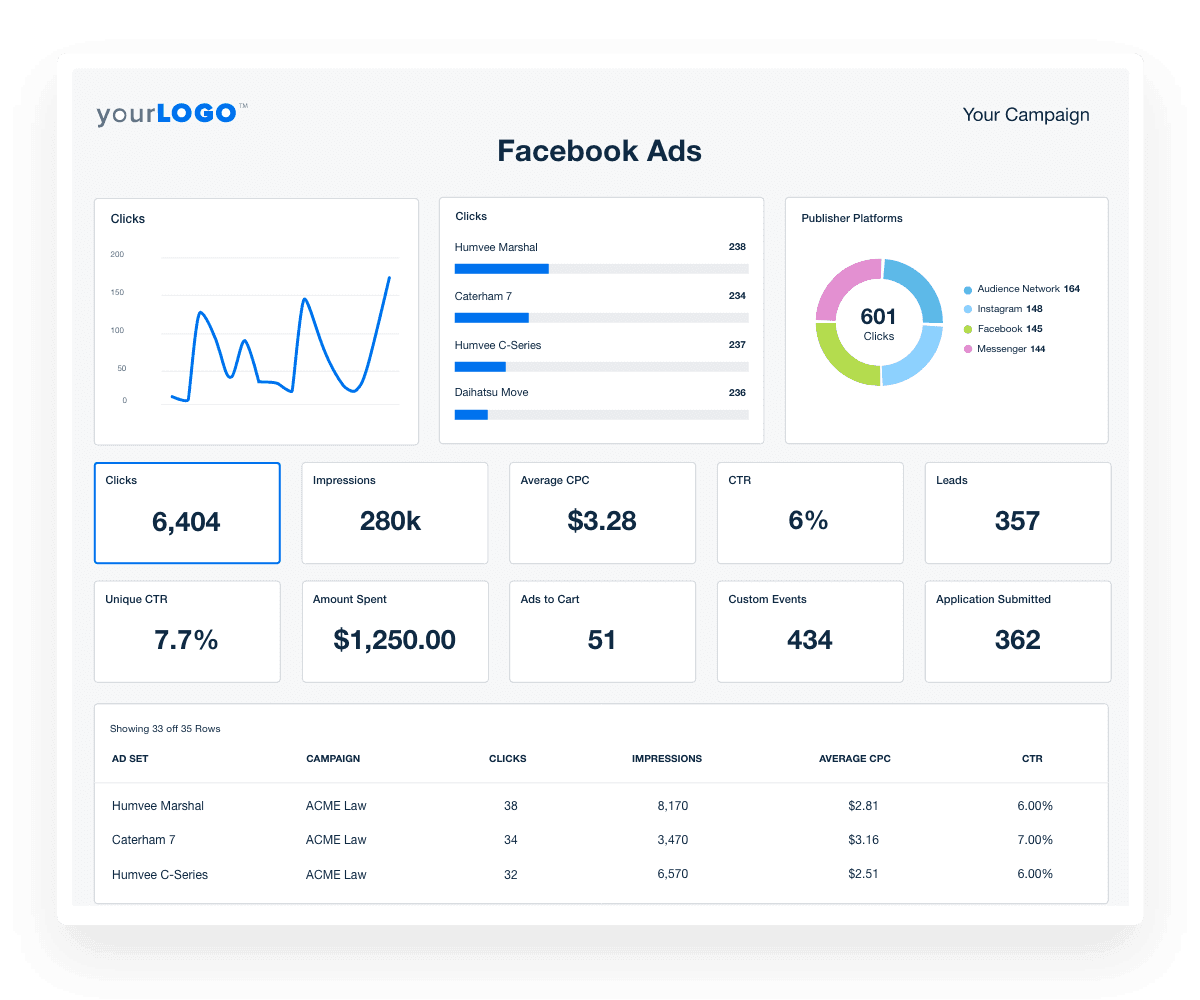
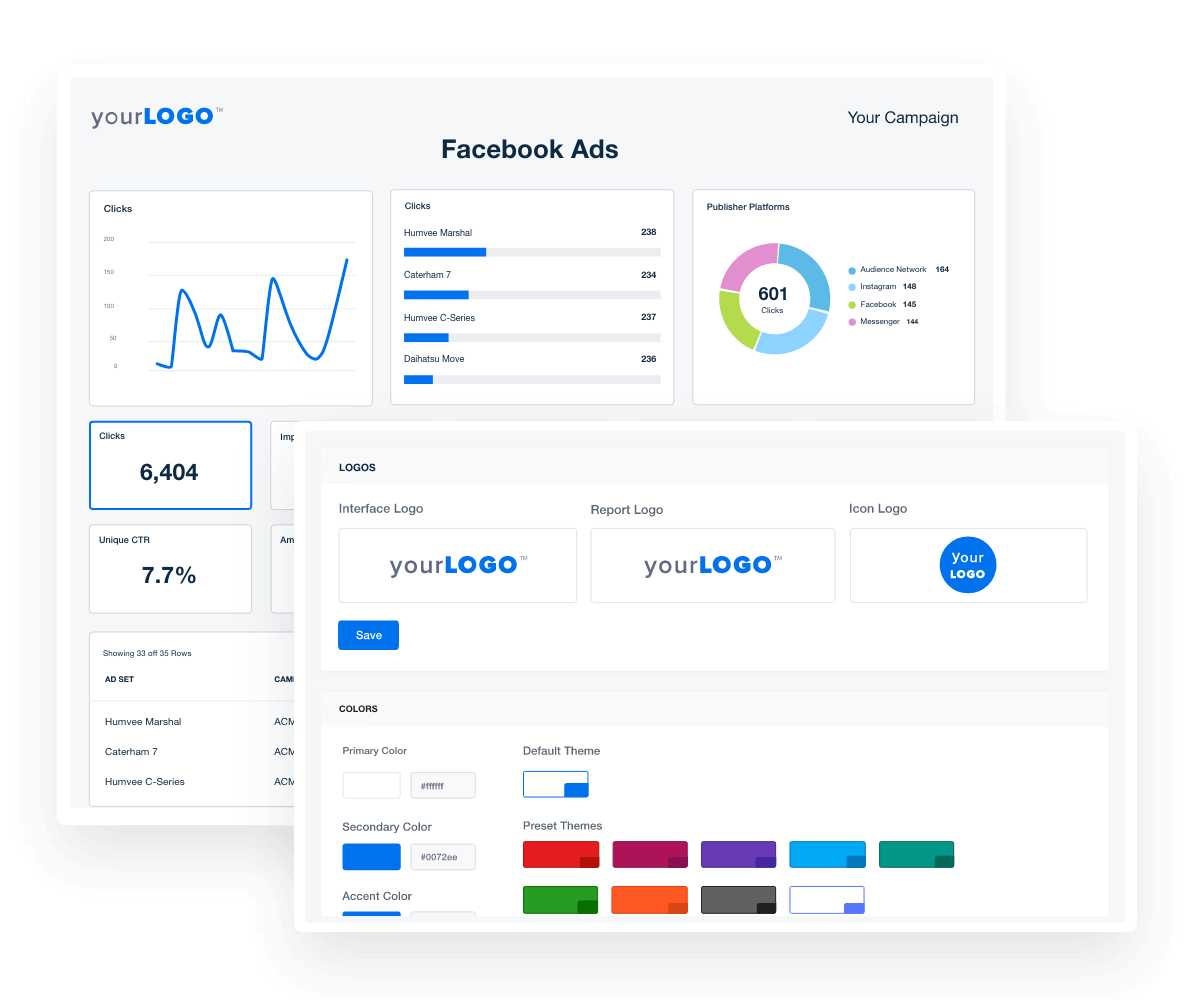
Access your Facebook insights, monitor ad performance, and manage engagement for all your clients with our Facebook Ads dashboard.
Why Should You Be Using a Dashboard to Monitor Facebook Ads?
Hidden in your Facebook Ads manager is a wealth of data and insights ready to be tapped into. The posts shared by users, the engagement from followers, and the interactions on your ad copy all make up for data that you need to monitor to improve performance.
Use AgencyAnalytics’ dashboard to effortlessly track everything you need without logging in and out of multiple accounts. Accessing and monitoring your Facebook Ads campaigns in a single platform unifies jumbled up numbers and insights into an understandable piece. Our platform helps you understand your audience better, assists you create stellar strategies, and reveals how well your campaigns are doing.
We also have a Facebook Ads report template available if you'd prefer to send periodic updates to clients.
Easily Track All Your Client’s Facebook Ads Metrics
Start Your Free Trial Today!What's Included in Our Facebook Ads Dashboard Template
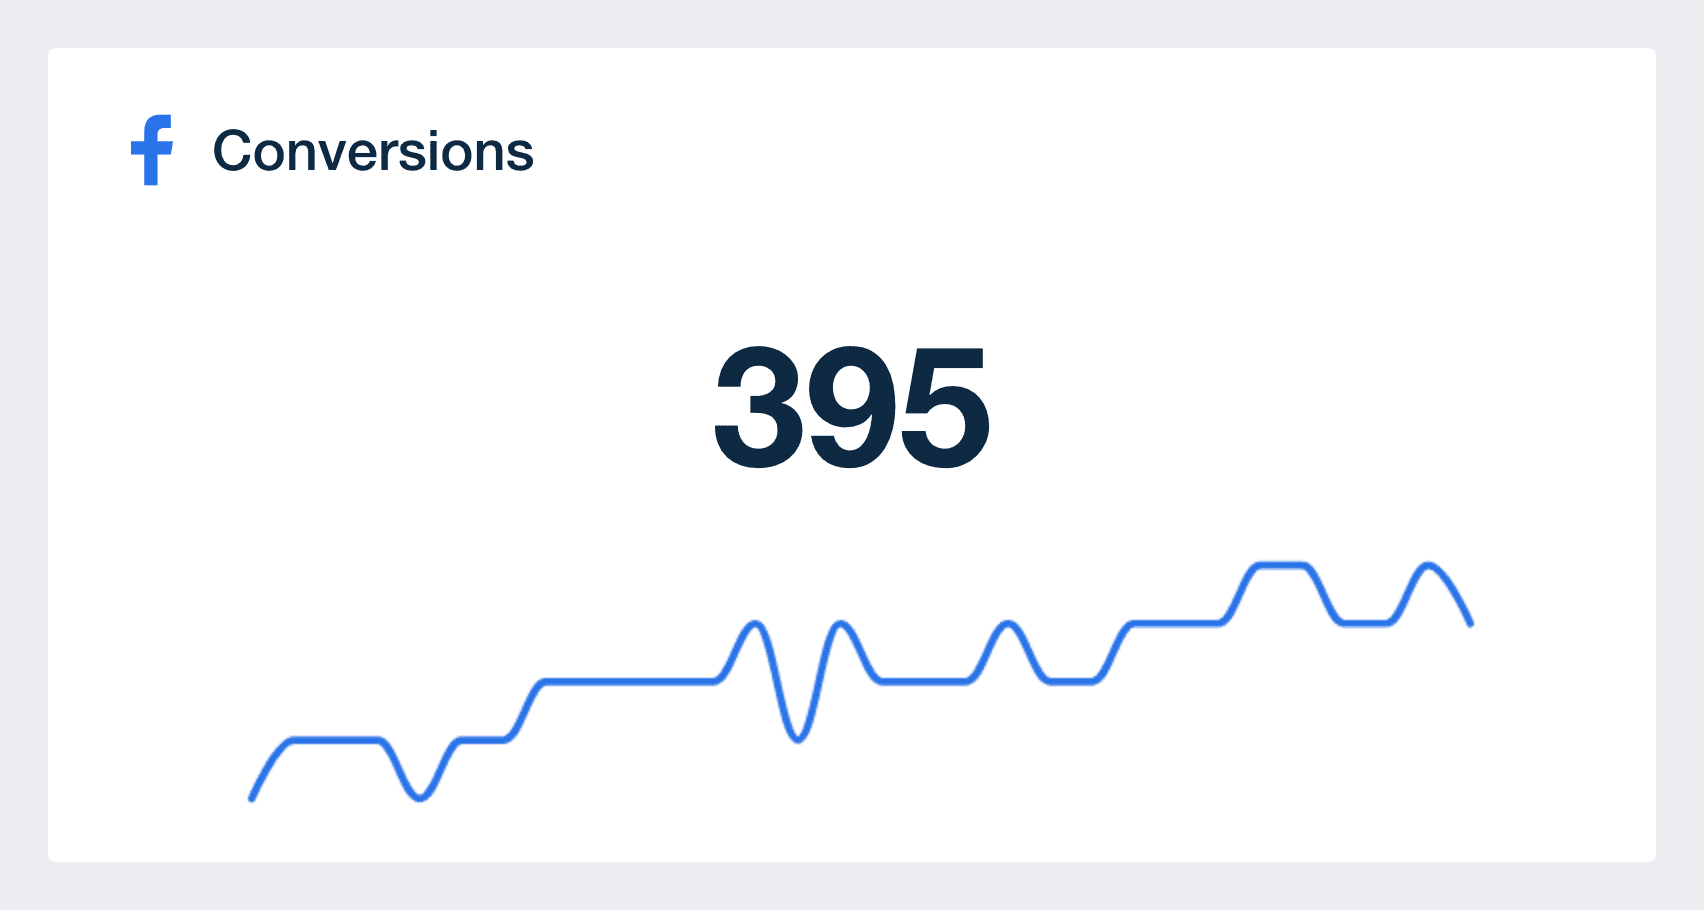
1. Conversions
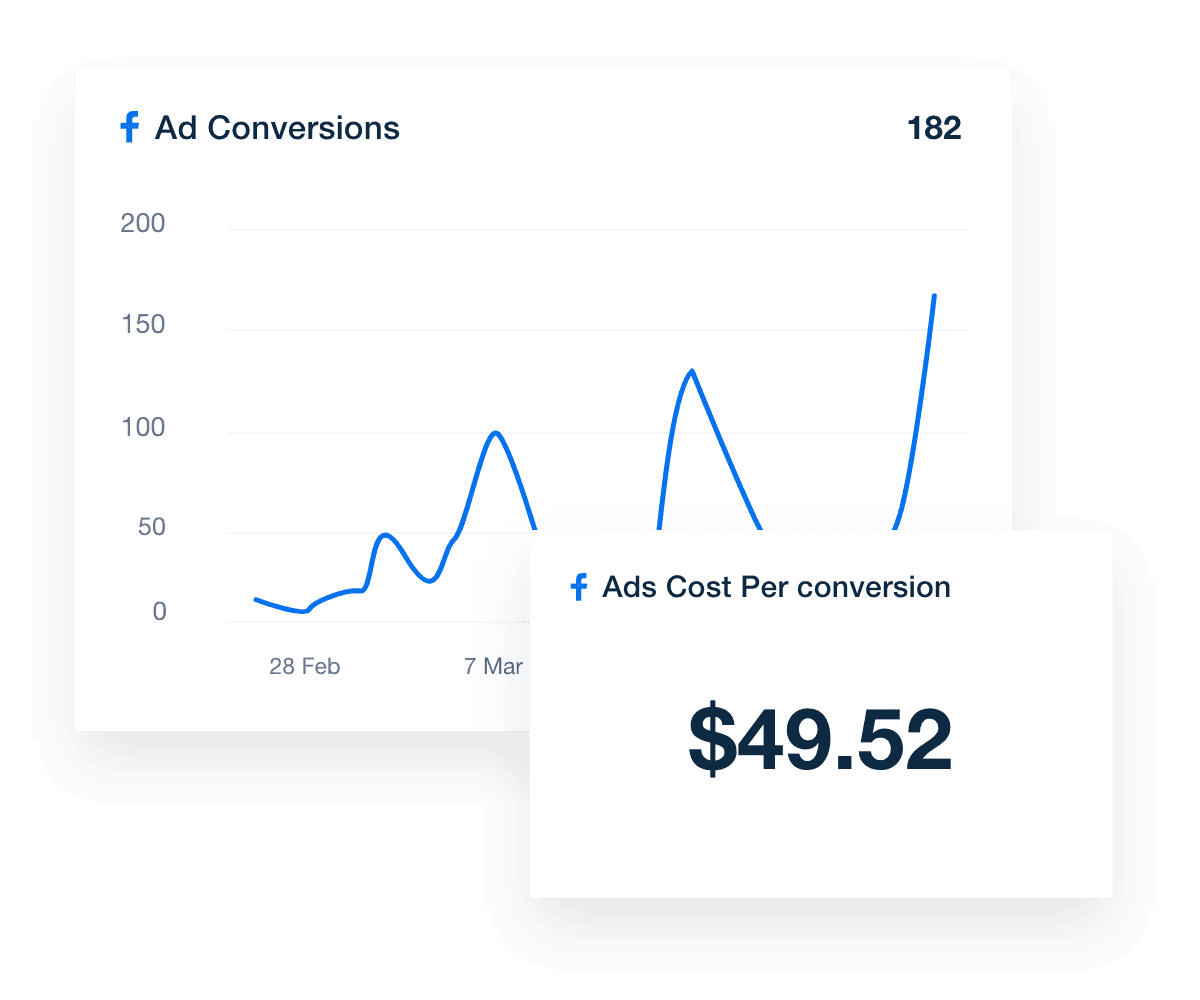
Once a prospect views and clicks on an ad from your Facebook Advertising campaign, a conversion is the ideal end-result. There are different forms of conversions and it all depends on your clients’ goals.
This metric generally involves the prospect clicking on call-to-actions (CTA) at various stages of the consumer's journey that you have mapped out. Facebook Ads can only track online conversions like website form fills or button clicks.

It is possibly the most important metric and helps you gather important insights about the performance of a campaign.
Suppose you have a high CTR on your Facebook Ad CTA, but when visitors come to your landing page they do not convert. This will expose your landing page as the issue. Your next course of action would be to find out why your landing page CTA isn't pulling in conversions.
2. Cost Per Conversion
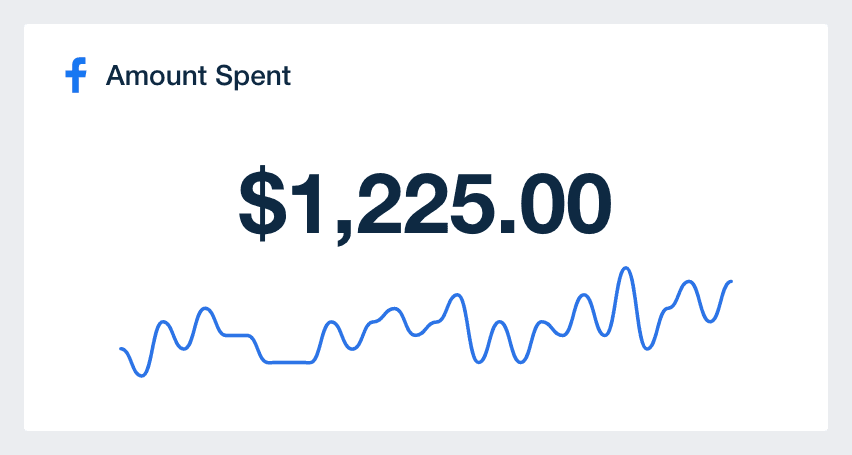
Are Facebook Ads paying off for your clients? Cost per conversion (aka cost per action) is the metric that will answer this. It is one thing to pay for impressions or clicks but another thing entirely to be able to measure your costs for a specific action. Tying ad spend to conversions makes your client's Facebook data more actionable.

Generally it's important to set a target cost per conversion that your clients are happy with. Once you have that goal in mind it's important to constantly monitor and report this number to your clients so they know you're not over spending on their ad account.
3. Impressions
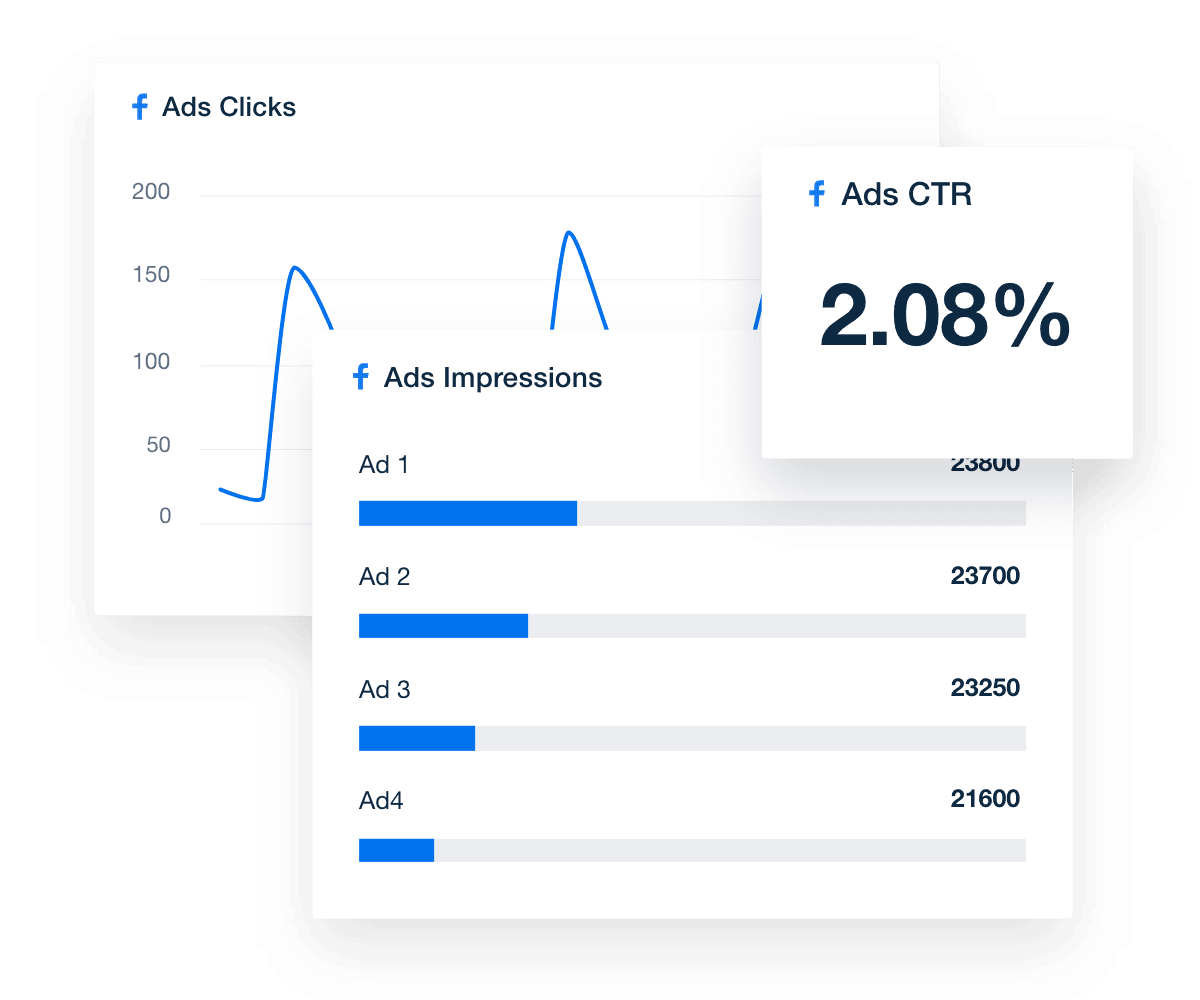
How many times have Facebook users seen your ads within a certain date range? This is the query your impression metric will answer. It is important to note that impressions and reach are two different things. Your impressions data shows you the number of times users have seen an ad within an ad set, even if one person has viewed it multiple times. It doesn’t just take into account unique views but the total number of views.

The impression metric is a crucial one to the success of your campaign because it gives you a clear view of how many times Facebook has displayed your ads to users. If your impressions are sky high but you have no clicks or conversions, you know you need to make changes.
4. Reach
Reach in FB ads refers to the number of Facebook users that have viewed your content. It's different from impressions as it only counts the number of unique users that see the ad, regardless of how many times they see it.
In order to know how well your marketing campaign is doing, you need to know how many people you have reached out to and what percentage of your audience has engaged with your offer.

5. Frequency
Ad frequency is a crucial Facebook metric that is ignored by most advertisers. It is the number of times each user (on average) has seen an ad. It's calculated as = Impressions/Reach.
If people are seeing the same ad over and over again without engaging, you know that something needs to change. Frequency plays a big role in how Facebook serves ads because they want to display as few ads as possible for the most number of clicks. If your frequency is high, FB is repeatedly displaying your ads to the same person.

You need to closely watch your frequency data on your dashboard. If you’re continuously showing the same ad to your client’s audience, you willneed to change things up. A great way to decrease ad frequency is to create numerous versions of your Facebook ads. Rework the visuals or have a different write-up of each version.
6. Clicks
One of the main goals of most FB ad campaigns is clicks. When people click on your ad, they're showing interest in your client’s offer and may be on the path to convert.
The aim is often to get users to your client’s landing page, but that's not always the case with Facebook ads. There are multiple kinds of clicks and each one denotes a different form of interaction. There are over 10 different types including: click to websites, click to call, maps clicks, etc.

When optimizing a campaign it's important to segment the different types of clicks. When reporting to a client though, you may just want to keep it simple and just display all clicks. It's easy to overwhelm them with unnecessary information.
7. CTR (Click Through Rate)
CTR shows you the percentage of consumers who have viewed your ad (impression) and clicked it. It can be calculated as = Clicks/Impressions.
This is such an important metric to keep your eye on as it can affect your campaigns relevance score. If your Facebook ads are receiving impressions void of clicks, Facebook concludes that your target audience does not see your ad as relevant.

You need to ensure that your ad is being clicked, otherwise Facebook will stop serving your ad. Having a high CTR is vital for an efficient campaign.
A low click-through-rate, which is any percentage below the average Facebook Ad CTR of 0.9%, happens when your target audience is simply viewing your ad without taking any action. The outcome of this is that you will end up paying higher for clicks and report a horrible ad performance.
8. CPC (Cost Per Click)
CPC is your cost per click and can be calculated as = Cost/Clicks. Tracking the CPC metric is a crucial way to get the most out of your client’s ad budget. It's one of the best barometers to see if your FB campaigns are becoming more expensive or cheaper, over time.

When your ads gain impressions with low click-through-rate you will end up getting fewer impressions and higher CPC pricing. Without monitoring this metric, you can end up spending a fortune and still fail to meet expected targets.
9. Engagement
Engagement reveals the number of times Facebook users took actions on your posts. These actions could be sharing your post, posting a comment, clicking a link or making a reaction. Engagements show that your target audience isn’t simply ignoring the ads that you're showing them.

The post engagement metric is also an excellent way to analyze the performance of different variations of your ads. If you are in the process of finding out what works best with a particular audience, this is a metric to keep a close watch on.
A post with low engagements tells you that your client’s audience is searching for something else. Now, if the other variation gets high engagement, it's a pointer that the ad is a perfect fit for your target audience.
10. Three-Second Video Views
Unlike other video ad platforms, Facebook video Ads reports impressions only when users see the ad in motion.
With this metric, you learn more about the type of video content that resonates with the audience. Even though it generally takes multiple touches to convert consumers, this metric offers a first clue as to who to retarget and who to ignore.

It could also point to the fact that your video content needs reworking. If the majority of viewers are exiting after just 3 seconds, and not hitting 10 seconds, you know you need to fix something.
Streamline Your Agency’s Facebook Ads Reporting
Start Your Free 14-day TrialWhy Use AgencyAnalytics To Track Facebook Ads
Track Performance Over Time

Intuitive Customer Dashboards

Conversions are King

Give Clients Live, 24/7 Data

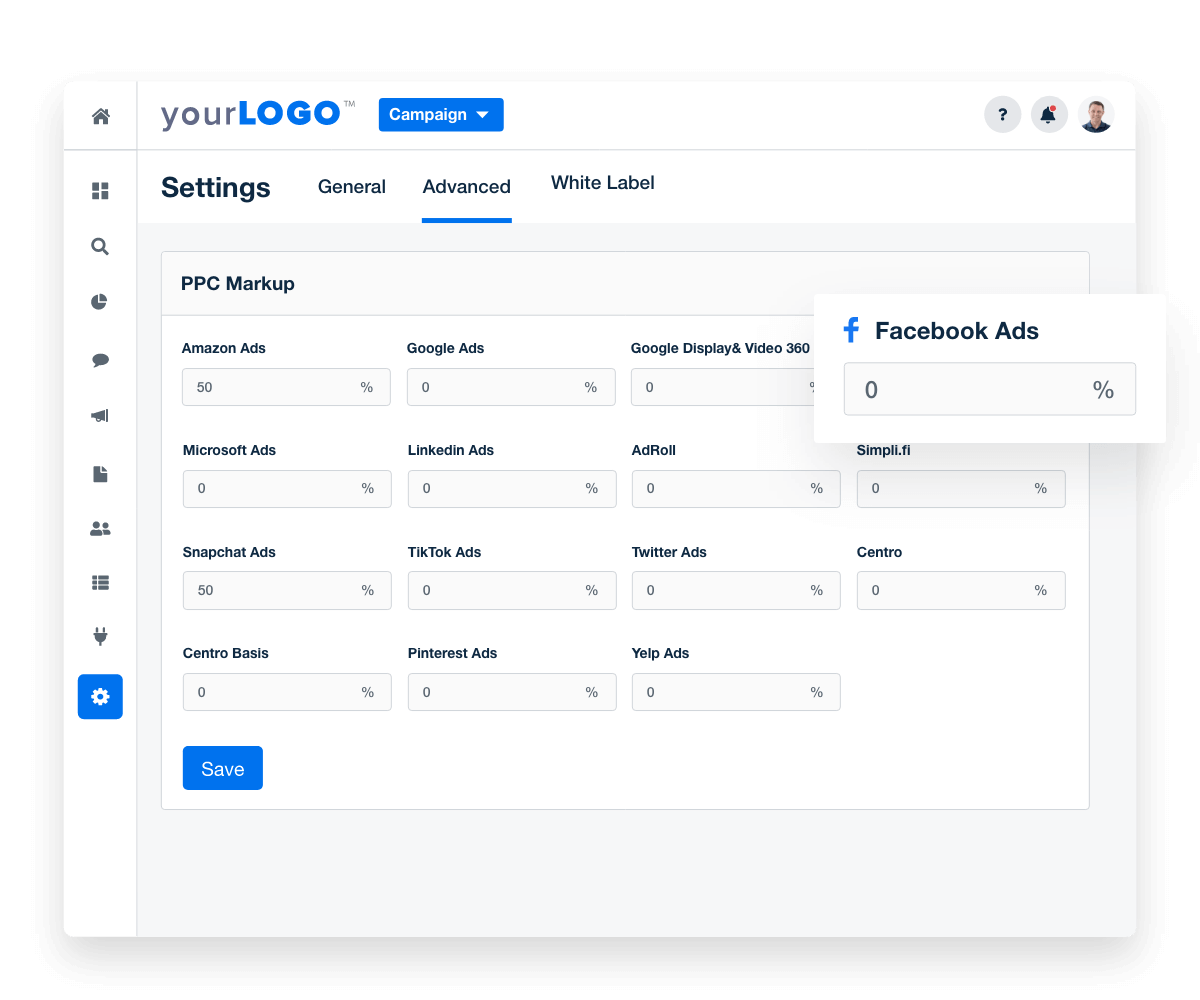
Add Your Markup to Client PPC Data

AgencyAnalytics is scalable, it’s reliable, and it’s easy to use. We have growth goals in our company, and knowing that AgencyAnalytics can scale to the number of campaigns or clients we have without problems is exactly what we need moving forward.

Check out our Facebook Ads Dashboard