Table of Contents
QUICK SUMMARY:
Facebook Ads metrics are quantitative measures used to assess the performance of advertising campaigns on the social media platform. These data points are used to evaluate audience engagement, track return on investment, inform decision-making, and refine ad strategies. This article focuses on the top Facebook Ads metrics to track, what they mean, and how to use them for campaign optimization.
Tracking Facebook Ads metrics is an essential part of any Facebook campaign. Both you and your clients want to know:
Which ads have the best CTR and CPC (Cost Per Click)? How much has been spent? What’s the campaign’s overall ROAS?
A great Facebook Ads report should answer each of these questions (and more).
With over 350 different metrics and ad terms in Facebook Ads Manager, it’s easy to get bogged down by all that data. In fact, a client report that included every one of those Facebook Ads metrics would be downright impossible to follow, and most of them would be completely irrelevant to your client’s campaign.
Not sure where to start? In this guide, we’ll go over the most important Facebook Ads metrics you should pay attention to. We’ll also share how to analyze them effectively and scale your Facebook Ads reporting with pre-built templates.
The best way to track Facebook Ads metrics
Tracking Facebook Ads metrics doesn’t have to be complicated. However, to achieve impactful results, it’s important to put some groundwork in place.
First things first–get clear on what the client is trying to achieve (e.g., awareness, engagement, leads, or conversions). Then, use these objectives to determine which metrics are important and which ones can be ignored.
For reference, here’s how to get started with Facebook Ads tracking:
Start with clearly defined client goals: Understand exactly what ad success looks like from the client’s perspective, which ultimately shapes the metrics you’ll prioritize.
Track marketing metrics that reflect meaningful progress, focusing on key data points such as CTR, cost per result, ROAS, and frequency. Then, use this to set Facebook Ads KPIs that reflect your client’s objectives.
Monitor trends over time: Show clients how performance is improving or where adjustments are needed.
Centralize reporting in one place: A unified dashboard makes it easier to compare campaigns, communicate results clearly, and maintain consistent, accurate reporting for every client.
Review performance regularly and adjust: Use real data to recommend thoughtful, incremental optimizations that clients can trust and rely on.
In short: Define the client’s goals, track the metrics tied to those goals, and use a single source of truth to evaluate performance. This approach will provide your marketing agency and clients with reliable, solid data.
The 13 Facebook Ads metrics that matter most
While there’s an extensive Facebook Ads metrics list, most of these insights fall into three core categories: Performance, Delivery, and Engagement.
These groups appear in the preset column views inside Meta Ads Manager, serving as a helpful framework for understanding campaign performance.
Here’s a quick breakdown for reference:
For top-of-funnel campaigns, engagement metrics like CTR or post interactions help you understand whether your creative is resonating.
For lead generation or ecommerce, performance metrics such as cost per result or ROAS matter far more.
If you're diagnosing visibility or reach issues, delivery metrics indicate whether specific ads are being shown to the right audience.
To keep things simple, we’re focusing on the 13 Facebook Ads metrics that consistently matter most, regardless of industry or campaign type. These metrics provide a reliable view of campaign health, helping your agency make informed optimizations.
Performance metrics | Delivery metrics | Engagement metrics |
|---|---|---|
Results | ||
Cost per result | ||
Result rate (conversion rate) | Post engagement | |
Custom events & conversions |
Performance metrics
Performance metrics reveal how well campaigns are supporting your client’s business goals and what it costs to achieve those results. Here’s an overview of the ones your agency should track.
1. Results
Results are the total number of times your client’s campaign received its desired outcome. This is arguably the most important metric, and will vary based on the type of Facebook Ads campaign and the client’s key performance indicators.
In most cases, results will typically be a conversion metric, such as website purchases or leads. Alternatively, if you're running a brand awareness campaign, traffic or impressions could be your client’s main objective.
For more context, here are a few of the common types of results:
Website purchases: Total number of purchases that occurred on your client’s website.
Leads: Total number of leads acquired on your client’s website.
Form leads: Facebook offers "Lead Ads" that allow users to submit their contact info (which is already pre-populated into the form fields) directly within the app. This result metric counts how many total form submissions occurred.
Custom conversions (downloads, webinar signups, etc.): Track any event occurring on your client’s website as a custom conversion using the Meta Pixel and/or the Conversions API (CAPI).
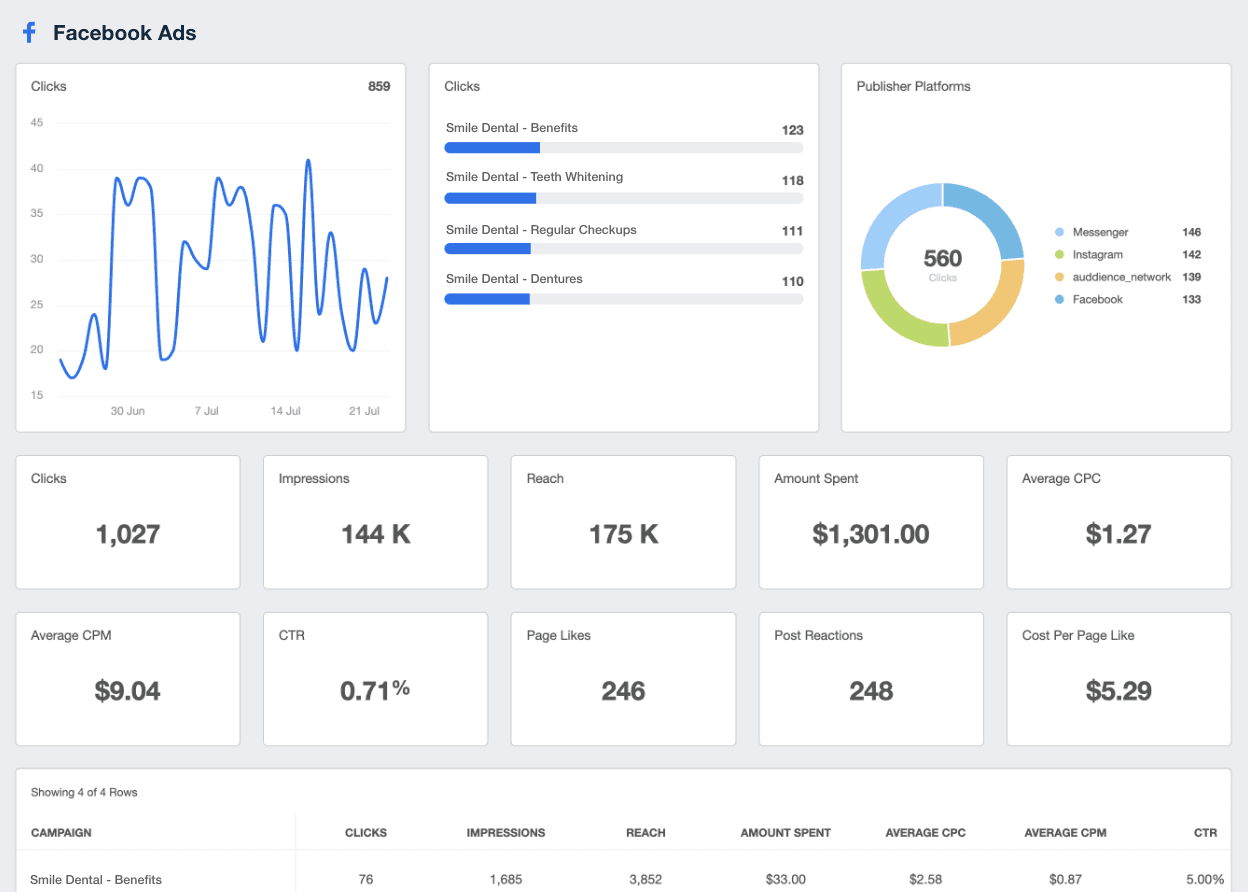
Monitor Facebook Ads performance across multiple clients–no hassle, no switching between accounts. Explore AgencyAnalytics today–it’s free for 14 days.
2. Cost per result
Cost per result measures how much your client is paying for each desired action. On other PPC channels, this metric is similar to cost per action (CPA). Here’s a formula for reference:
Cost per result = Total Spend ÷ Number of Results
The “result” depends on the client’s specific campaign objective—whether that’s generating new leads, driving purchases, or encouraging form submissions. A lower cost per result indicates that your client’s budget is being used efficiently and that the campaign is resonating with the right target audience.
For a broader context, consider how your client’s results compare to industry norms. Take the median cost per lead on the AgencyAnalytics platform (based on data from 7,000+ digital agencies across the US, Canada, UK, New Zealand, and Australia). It currently sits at $50.51, which is a helpful benchmark to frame expectations and set realistic goals.
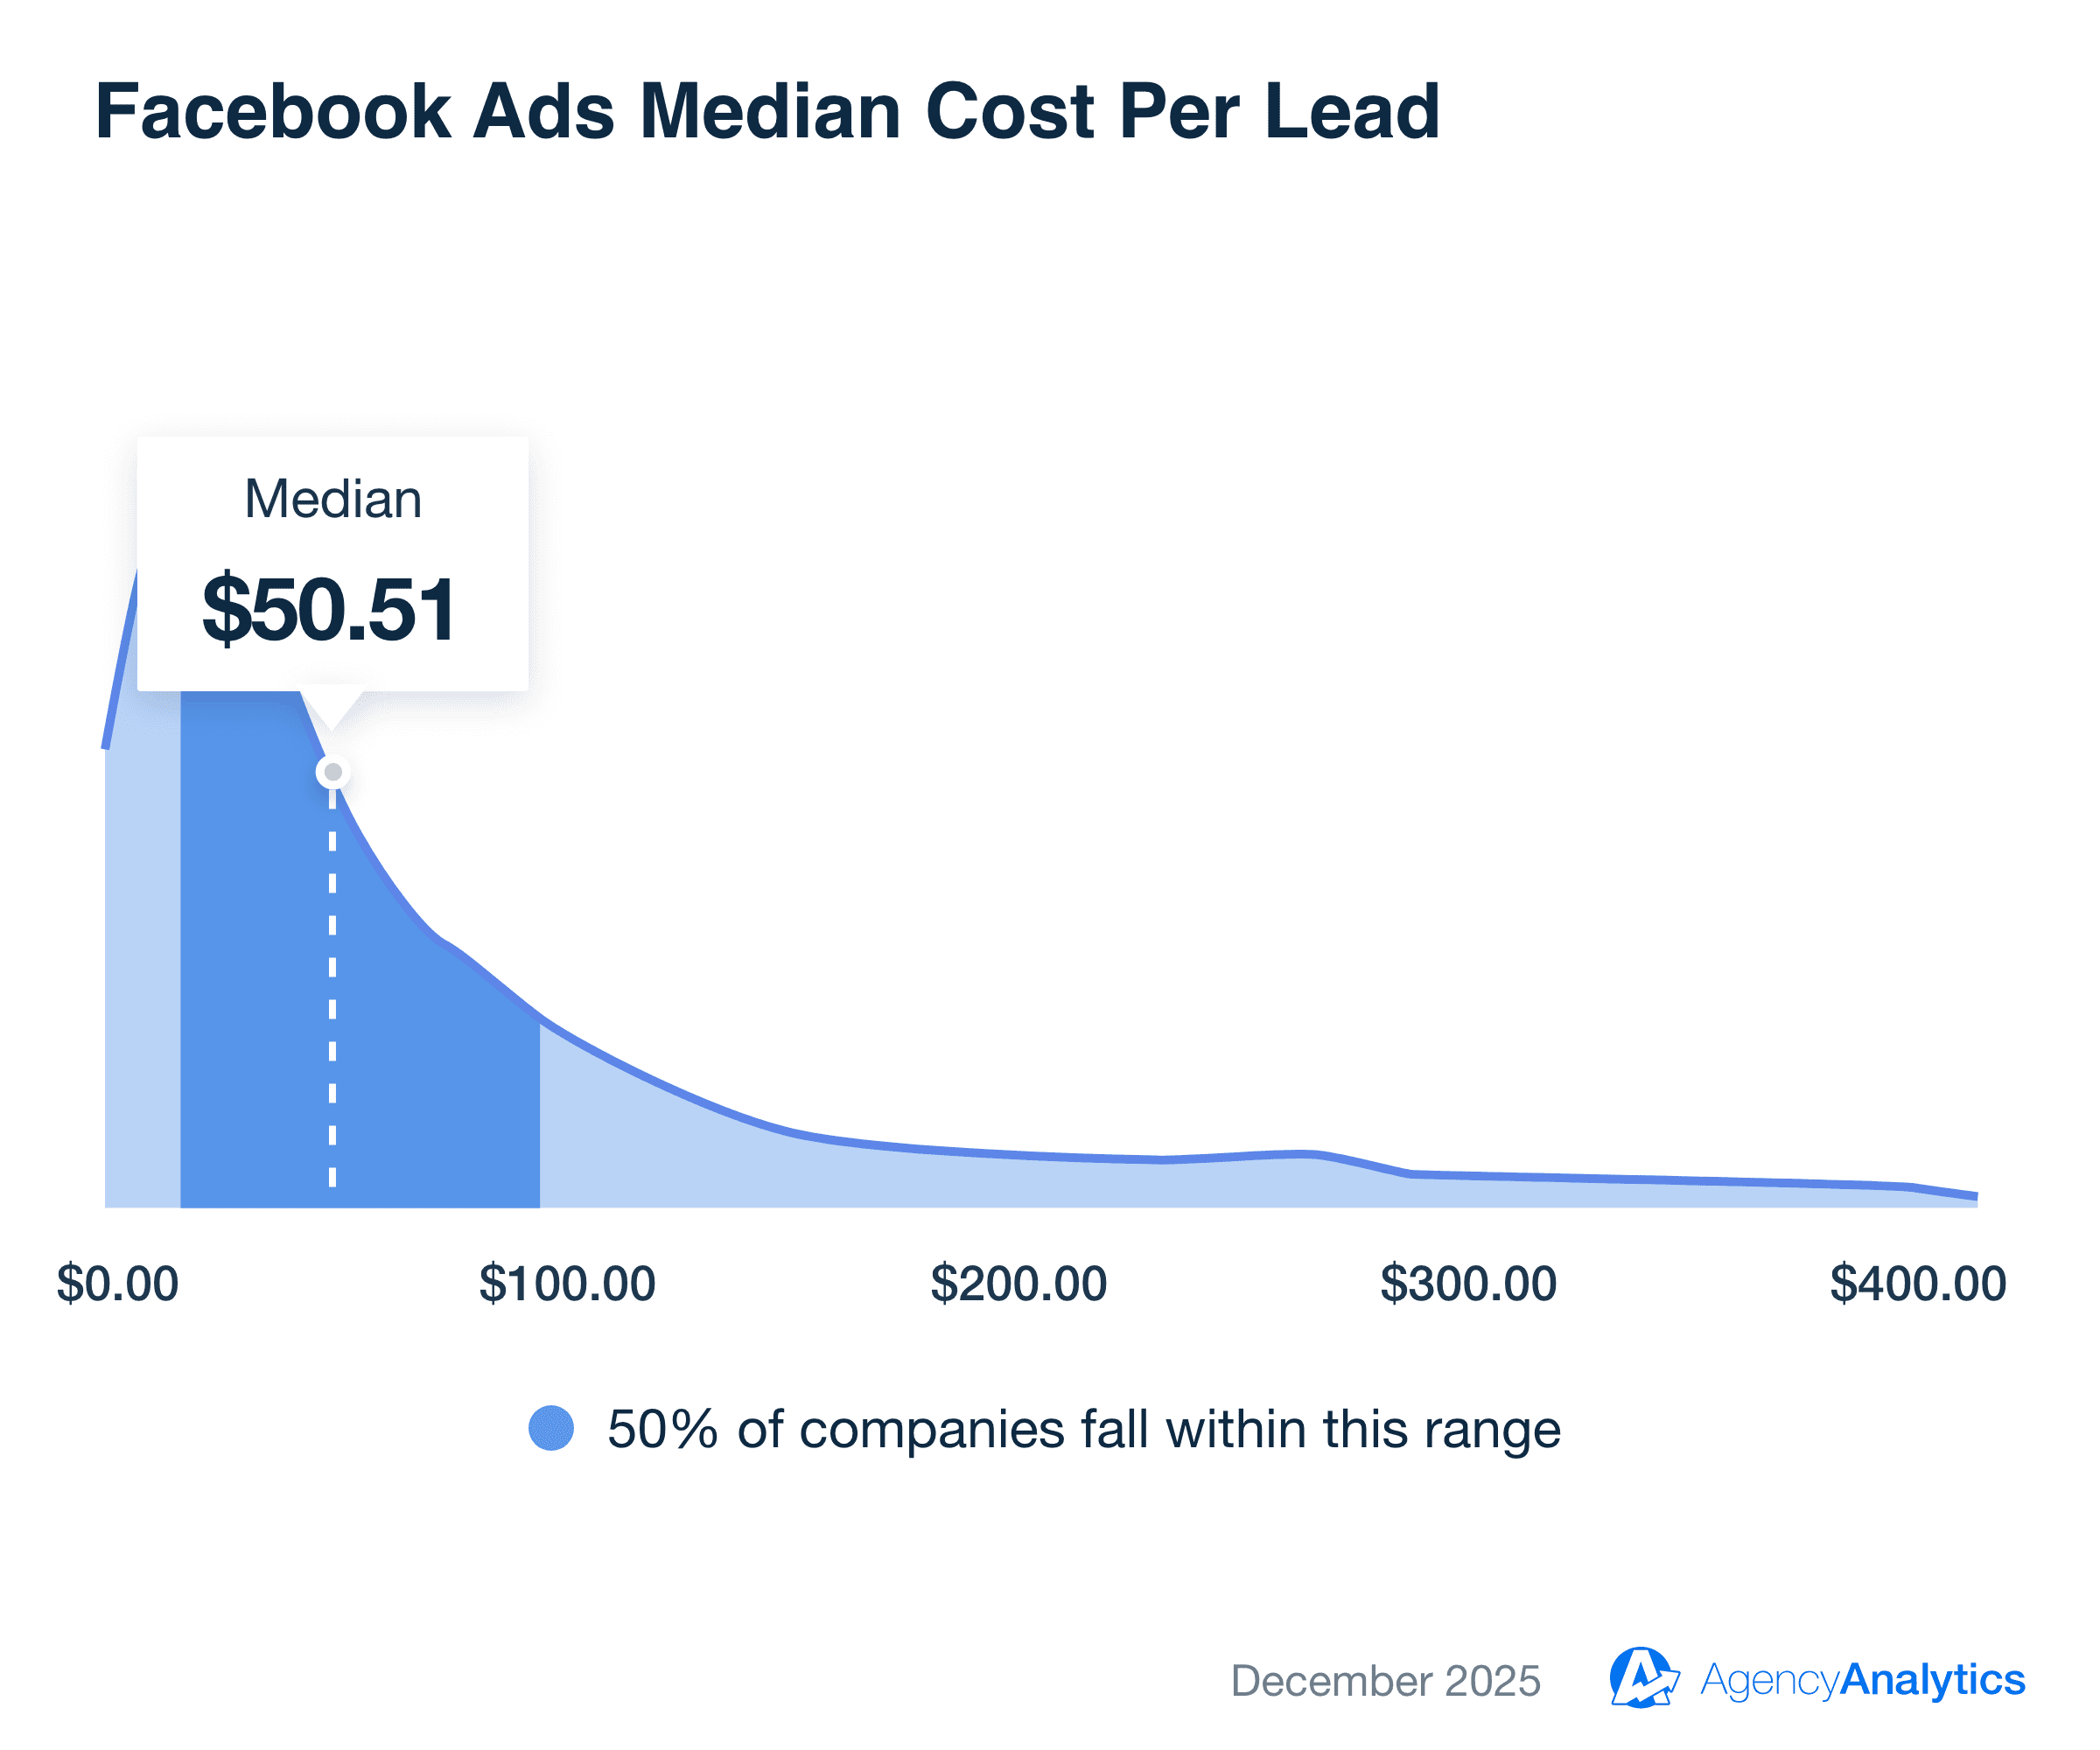
See how your clients are performing on a macro level. Access reliable first-party data benchmarks in the AgencyAnalytics platform–sign up for a free 14-day trial today.
That said, ideal CPL varies significantly by industry. For example, in legal services, the median CPL is $65.06, while the Painting sector sits at $94.14.
This difference reflects the realities of each market—some industries are more competitive, have higher customer value, or require more nurturing to convert. Even geographic region plays a role (e.g., the median CPL in the US across all industries is $99.09, which is significantly higher than the overall benchmark across multiple countries).
In other words, a “good” CPL isn’t universal; it depends on what it costs to acquire a meaningful lead in that client’s specific space.
3. Result rate (conversion rate)
Result rate measures how effectively your client’s ads turn impressions into meaningful actions. It shows the percentage of people who completed the desired outcome—whether that’s a lead, purchase, or other conversion—out of everyone who saw the ad.
Result Rate = Results ÷ Impressions
A strong result rate means your client’s ad is reaching the right audience with the right message. A low result rate typically signals a disconnect. It could be that the ad creative isn’t compelling enough, the offer isn’t resonating, or the landing page isn’t aligned with what the ad promises.
4. ROAS (return on ad spend)
ROAS (return on ad spend) measures how much revenue your client’s Facebook Ads generate for every dollar spent. It’s one of the most important indicators of whether a campaign is profitable and performing at a level that meets your client’s goals.
The formula is simple:
ROAS = Revenue ÷ Ad Spend
If you’re running an ecommerce campaign and tracking purchases using the Meta Pixel and/or Conversions API, Facebook calculates ROAS automatically.
For campaigns that don’t track direct purchases—such as lead generation, brand awareness, or offline conversions—you’ll need to calculate ROAS manually. In these cases, tie revenue back to the value of each conversion type to understand whether your ad spend is generating a meaningful return on investment.
Wondering how this looks in the real world? Say you’re running a lead generation campaign, and each qualified lead is worth $50 to your client. If their ads brought in 20 leads with a total ad spend of $500, their ROAS works out to 2.0. This means that for every $1 spent on Facebook Ads, the campaign generated $2 in value.
Impress clients and save hours with custom, automated reporting.
Join 7,000+ agencies that create reports in under 30 minutes per client using AgencyAnalytics. Get started for free. No credit card required.
Already have an account?
Log inDelivery metrics
Delivery metrics show how your client’s Facebook Ads are being served and how their budget is being used. These metrics go beyond spend—they show whether your client’s campaigns are pacing correctly, reaching the right audiences, and generating value.
5. Spend
Spend is the total amount your client has paid for their ads during a selected time period. It’s a key metric to include in any client dashboard because it provides full visibility into how their budget is being allocated. Note that:
Monitoring ad cost ensures you stay within your client’s budget, but it’s only one piece of the picture. To understand whether that budget is driving results, it’s also important to track supporting cost metrics, such as cost per result, average CPC, and ROAS.
Spend works hand-in-hand with other delivery metrics. For example, monitoring ad frequency helps prevent audience fatigue and reduces wasted spend on impressions that are no longer effective.
To give clients helpful context, consider that the median monthly Facebook Ads spend across industries is $1,051.86. If a client’s budget is far below the norm, they may struggle to achieve the reach or results they’re aiming for. On the other hand, if their spend is significantly higher, it becomes even more important to ensure cost efficiency.
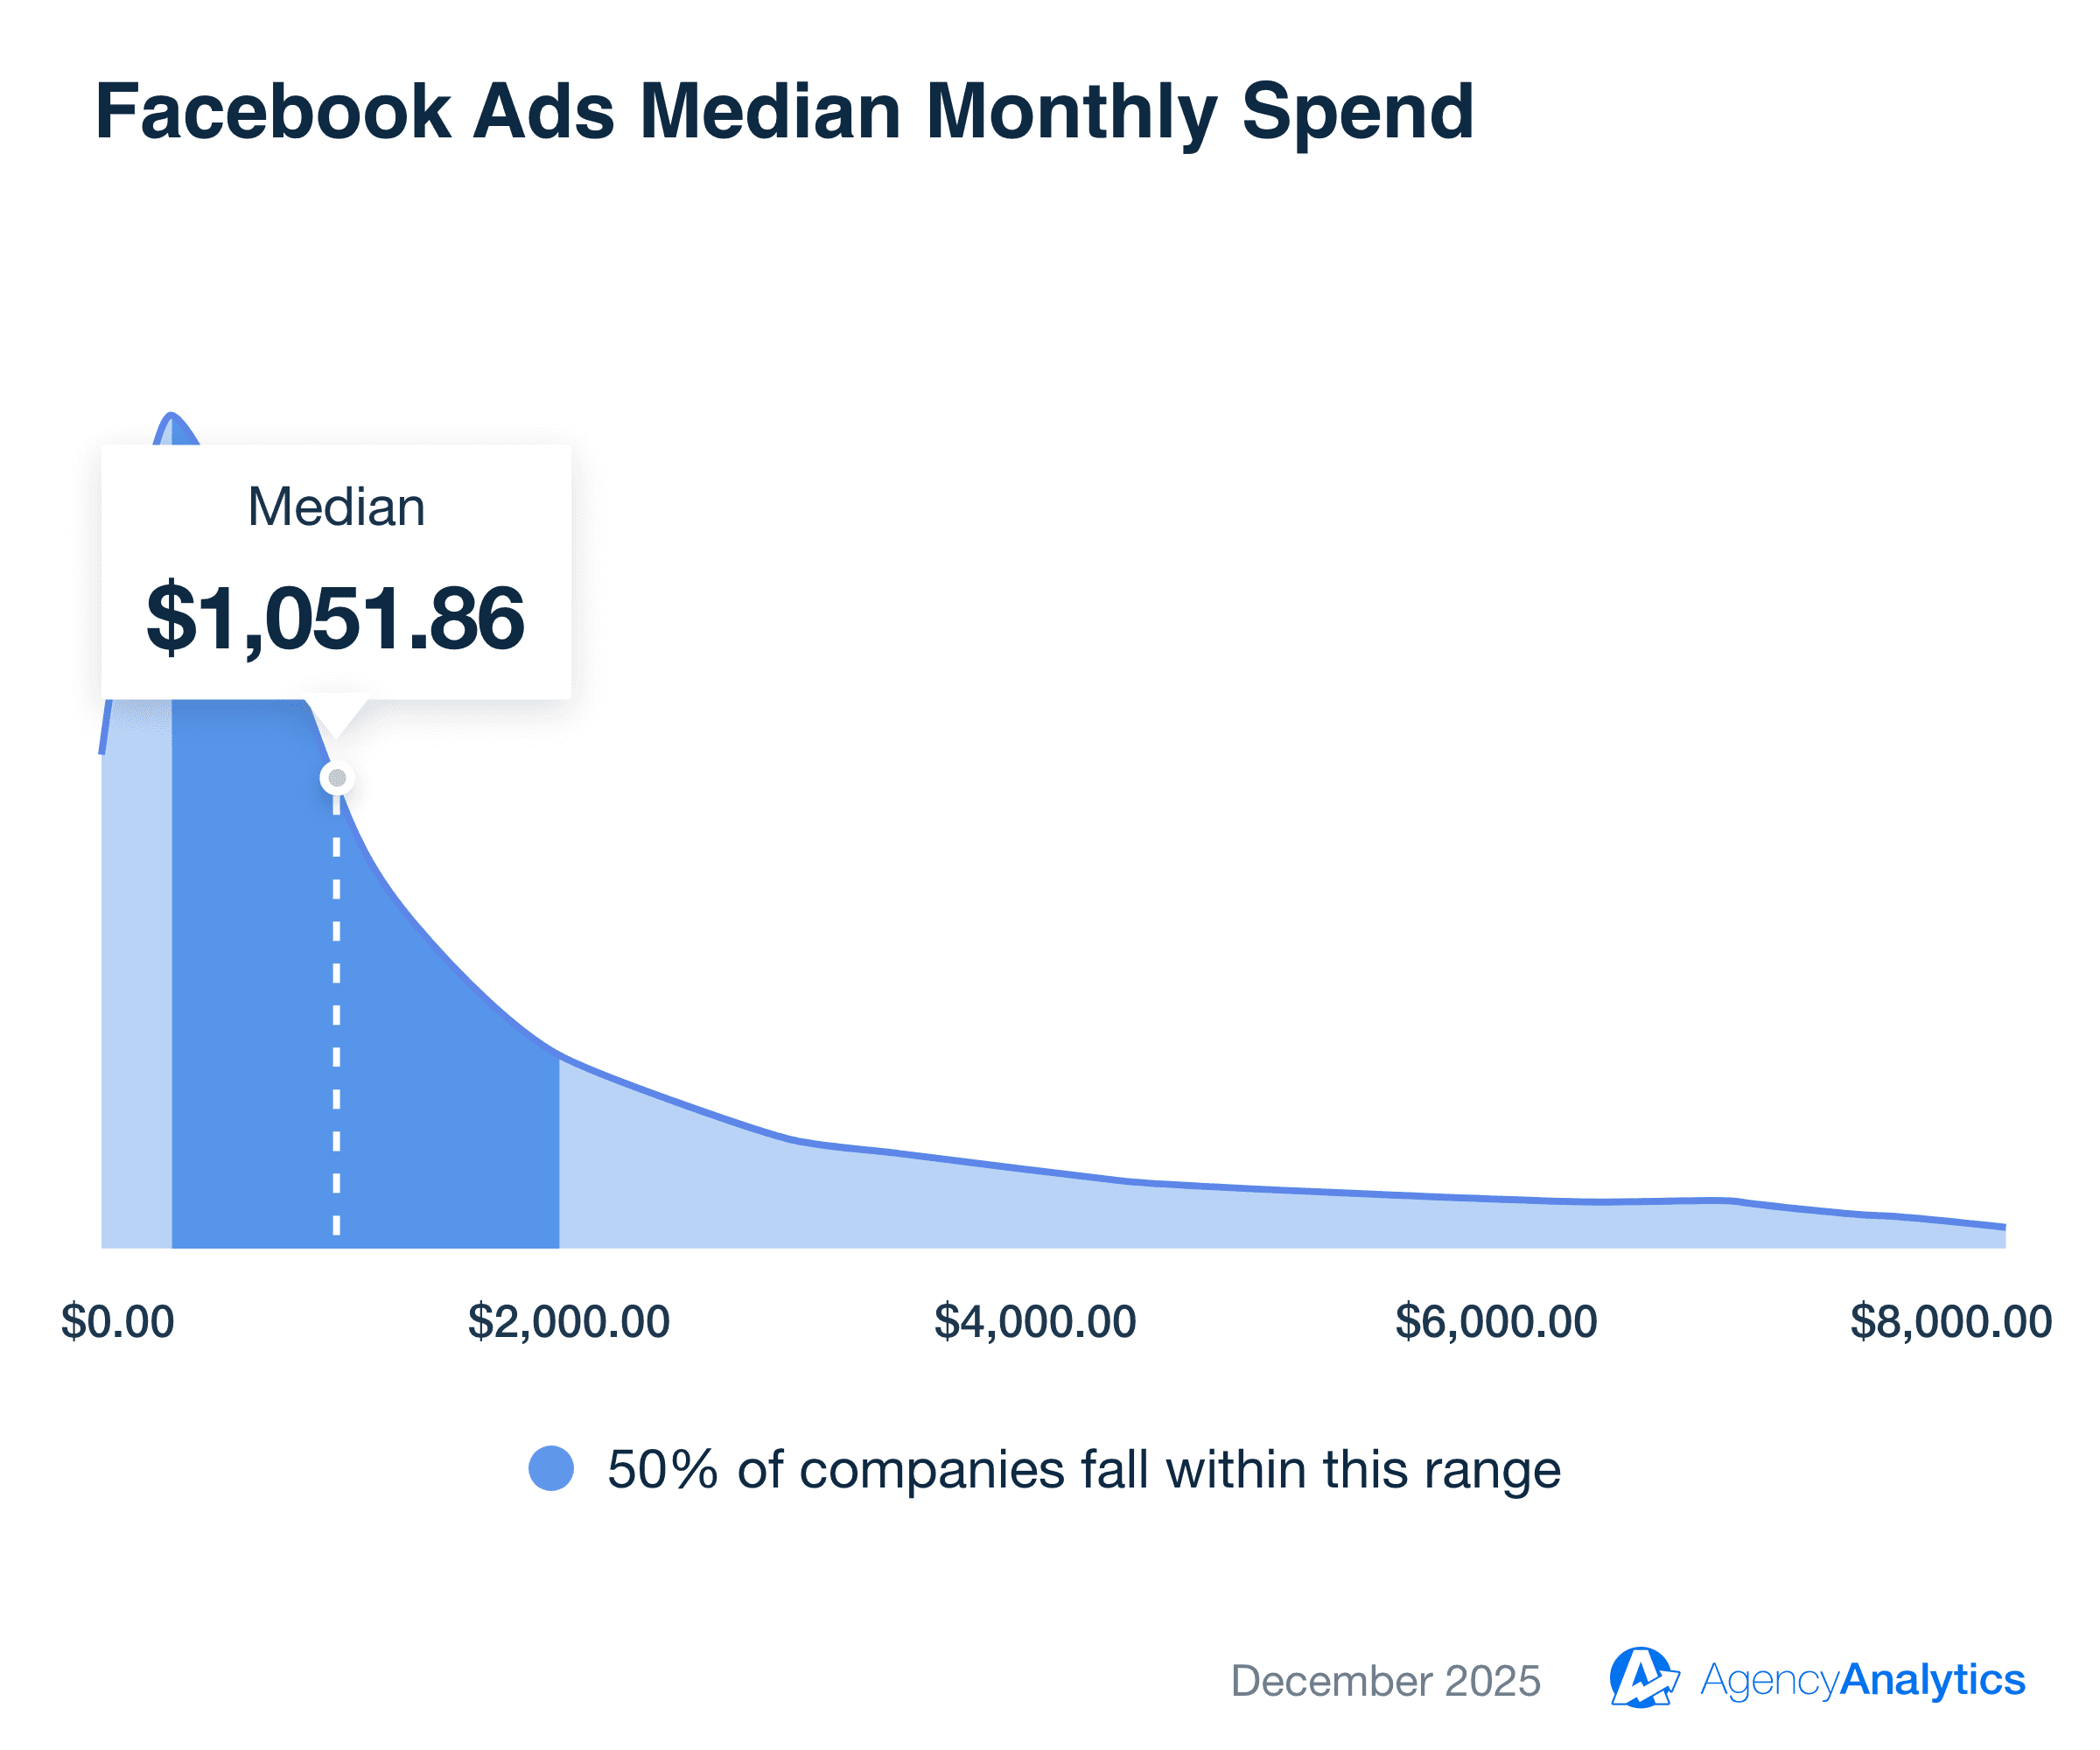
Keep in mind that monthly budget benchmarks vary widely by industry. For example, Apparel & Fashion brands have a median monthly Facebook Ads spend of $3,565.68, which is considerably higher than industries like Cleaning Services, where the median spend is $618.44. This difference reflects factors such as market competitiveness, audience size, and the cost of acquiring customers in each industry.
This comparison helps determine whether a client’s budget is competitive within their industry and realistic for the goals they aim to achieve.
6. Impressions
Impressions represent the total number of times your client’s ad appears to users. This metric reflects the overall visibility of their campaigns and helps you understand how effectively Facebook is distributing their ads across the selected audience.
Impressions = Reach × Frequency
Ad impressions also provide helpful context when evaluating other delivery metrics. For example:
Pairing impressions with frequency shows whether the same users are seeing the ads too often.
Comparing impressions with spend helps determine whether the budget is sufficient to generate meaningful visibility.
A healthy number of impressions indicates that your client’s targeting, budget, and bidding strategy are aligned well enough for Facebook to serve their ads consistently.
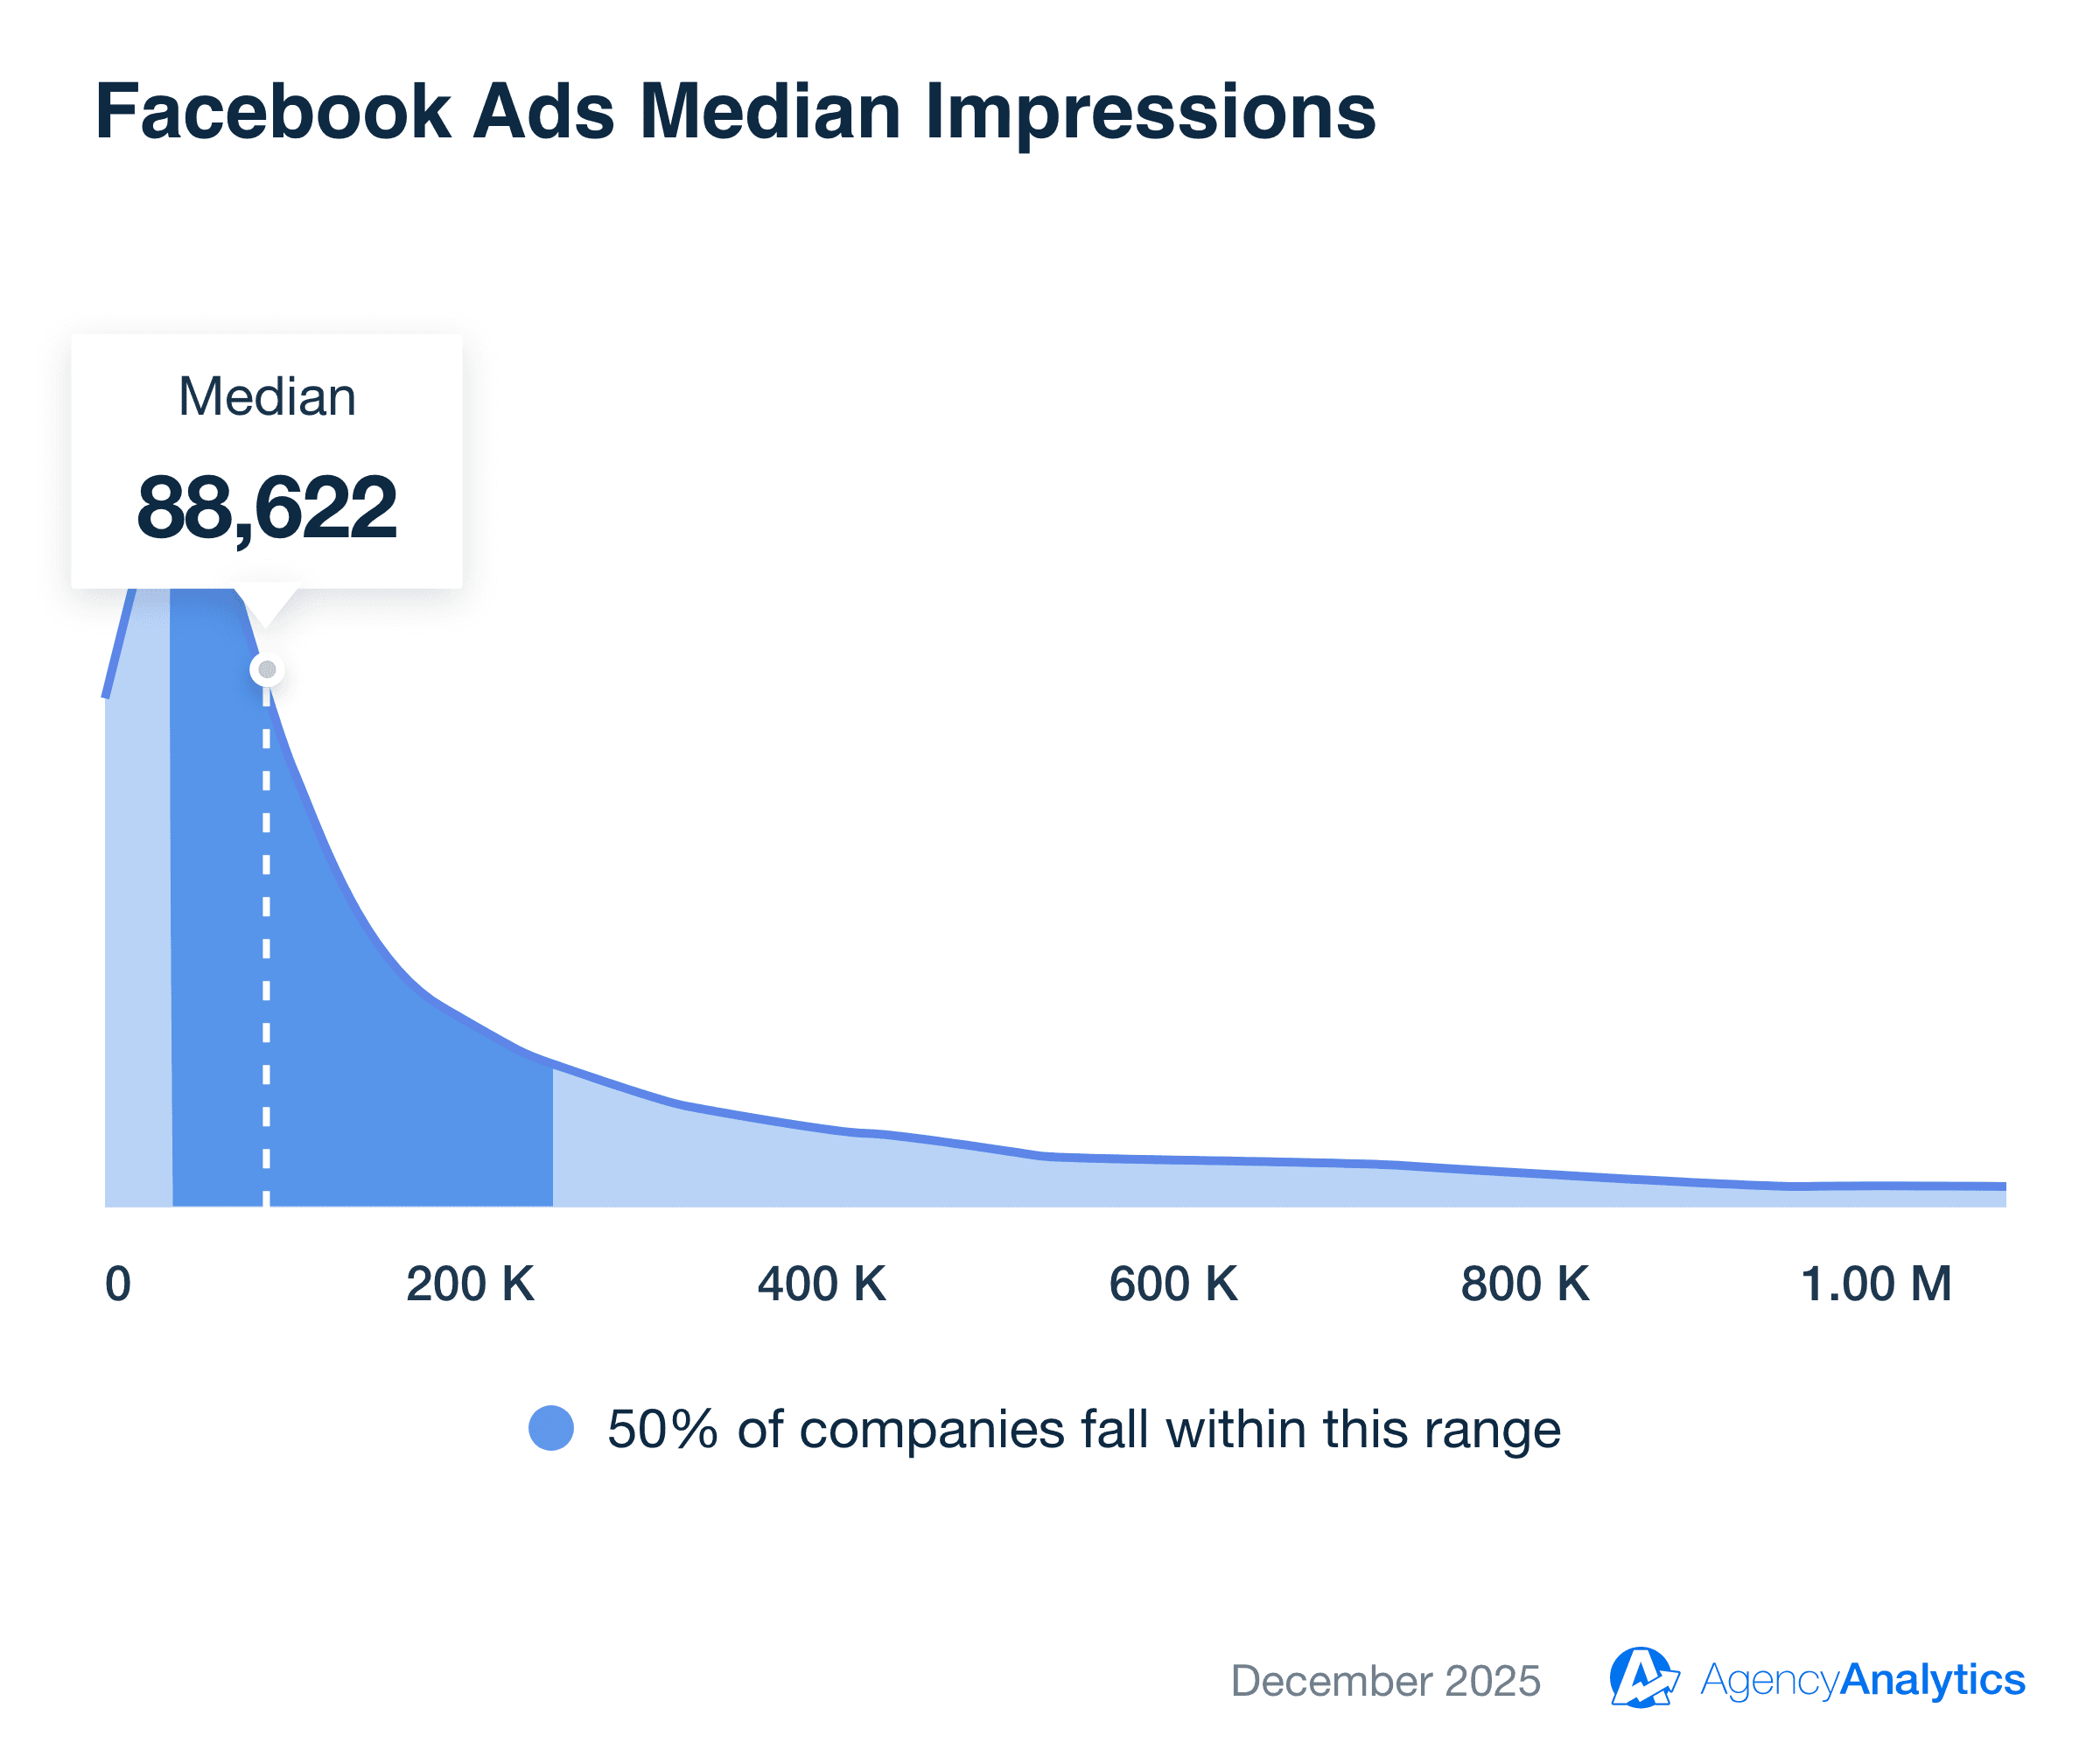
Facebook Ads is known for its ability to reach a broad audience, which is why the average client campaign receives approximately 88,622 impressions each month (based on AgencyAnalytics’ benchmarking data from December 2025).
7. Cost per mille (CPM)
CPM is the amount your client pays for every 1,000 impressions their ad receives. It's a core delivery metric across all online advertising, helping your agency to evaluate the cost-effectiveness of reaching users on Facebook.
CPM = (Total Campaign Cost ÷ Impressions) × 1,000
Enter your total campaign cost and total number of impressions to calculate your CPM (Cost per Thousand Impressions).
CPM: $0.00
CPM is especially useful for comparing the cost of visibility across different campaigns, audiences, or platforms. Because Facebook Ads run on an auction system, CPM is directly influenced by competition. If CPM rises, it may signal that more advertisers are targeting the same audience or that demand is increasing during seasonal periods.
8. Cost per click (CPC)
CPC shows how much your client pays for each click on their Facebook Ads. It reflects the cost of driving traffic and is a key metric for assessing the efficiency of your creatives and targeting.
CPC = Ad Spend ÷ Number of Clicks
CPC also helps uncover why costs might be rising. Since Facebook Ads operate through an auction, a higher CPC may signal increased competition for your client’s audience. On the other hand, it may point to issues with relevance or declining conversion rates.
Looking at CPC alongside CPM helps you determine whether rising costs are due to the platform becoming more expensive or the campaign becoming less efficient. Together, they paint a clearer picture of how pricing is shifting for your client’s chosen placements.
Based on AgencyAnalytics performance insights, the median CPC for Facebook Ads campaigns across industries is $0.57 (December 2025).

9. Frequency
Frequency measures the average number of times each user has seen your client’s ad. It shows how often the same audience is being exposed to the campaign and whether you’re striking the right balance between visibility and overexposure. For reference:
Frequency = Impressions ÷ Reach
A healthy frequency ensures your client’s message is seen enough times to make an impact, but not so often that it leads to ad fatigue. When frequency gets too high, performance typically declines—click-through rates drop, costs rise, and users may start ignoring or even hiding the ads. This results in wasted spend and a less efficient campaign.
On the other hand, a low frequency can limit exposure, making it harder for your client’s message to gain traction or drive meaningful results.
Engagement metrics
Engagement metrics highlight how people respond to your client’s ads. They’re essential for understanding which creatives resonate and where there’s room to improve.
10. Clicks
Clicks measure how users interact with your client’s ad, and they’re one of the clearest indicators of audience interest. Before conversions can happen, people need to engage, and clicks show whether your client’s ad is compelling enough to drive that first step.
The only way to assess audience perception is by studying the reactions. Clicks, shares, and replies are the "facial expressions" and "words" that a person uses to communicate. And that will tell you how well your conversation is going.
Seth Giammanco, Principal, Strategy and Technology, Minds On Design Lab
There are two types of click metrics you’ll see in Facebook Ads Manager:
Link Clicks: The number of times someone clicked the main link in your ad and was taken to your landing page or destination. These clicks are most closely tied to conversions and should be your primary focus in reporting.
Clicks (All): The total number of all click interactions on the ad, including link clicks, profile clicks, clicks to your Facebook Page, and other non-conversion actions.
While “Clicks (All)” helps show general engagement, it doesn’t reflect actions that move users further down the funnel. That’s why Link Clicks are the most meaningful metric for understanding whether your client’s audience is interested in their offer.
To provide context, AgencyAnalytics' recent Facebook Ads performance benchmarks show that a typical campaign generates 1,727 link clicks per month. For more granular insights—such as click benchmarks by industry or country—sign up for a free 14-day trial today.
11. CTR (Click-through rate)
CTR shows how many people clicked your client’s ad compared to how many times it was shown. It’s one of the quickest ways to understand whether the ad is actually engaging the audience.
CTR = (Link Clicks ÷ Impressions) × 100
That said, clicks alone don’t tell the whole story. For example, 100 clicks might look good at first. However, if the ad had 100,000 impressions, that’s a 0.1% CTR, which signals weak engagement.
If those same 100 clicks came from 1,000 impressions, the CTR jumps to 10%, which is much stronger. That’s why CTR matters: It puts clicks in the right context. Plus, higher CTR typically improves performance in Facebook’s auction, while lower CTR often increases costs.
To understand performance, you need a range of KPIs, and they need to be analyzed together. For example, traffic is no good unless you understand what’s driving it and whether it’s generating clicks or conversions.
Paul Morris, Managing Director, Superb Digital
Based on recent AgencyAnalytics performance benchmarks, the median Facebook Ads CTR across all industries is 1.92%. If your client’s campaigns are well below this number, it could be a sign that their creative, targeting, or ad format needs a refresh.
12. Post engagement
Post engagement measures the total number of reactions, comments, shares, and clicks your client’s ad receives. It’s a key indicator of how strongly the ad is connecting with the audience and how effectively it’s driving interaction beyond simple visibility.
Post engagement is especially useful for campaigns focused on awareness, storytelling, or community building. Even when clicks or conversions aren’t the primary goal, engagement helps show whether the content is connecting with the right people.
Post Engagement = Total interactions on the ad (likes, comments, shares, saves, etc.)
High post engagement indicates that the ad is capturing attention and sparking interest or conversation. This type of engagement can also help improve performance in Facebook’s auction system. When users interact with your ad, Facebook sees it as more relevant—often resulting in lower costs and better delivery.
Low engagement, on the other hand, may signal that the creative isn’t compelling enough or that the audience isn’t aligned with the message. For clients, this metric provides valuable insight into how their brand is being perceived and whether the ad is strong enough to encourage interaction.
13. Custom events & conversions
Custom events and conversions reflect the actions that matter most to your client’s business. These may include purchases, form submissions, add-to-carts, phone calls, or any other step in the customer journey that aligns with your client’s goals.
Here’s how Facebook lets you track these important actions more accurately:
Custom events: Set up through the Meta Pixel or Conversions API to track specific user actions on your client’s website. These are fully customizable and give you detailed insight into how users interact with key parts of the funnel.
Custom conversions: Created directly in Ads Manager by defining rules (such as URL visits or event parameters) to measure specific outcomes without additional technical setup.
Custom events and conversions show which actions your client’s advertising efforts drive the most results, while helping Meta optimize delivery toward users more likely to convert. They also improve the accuracy of key metrics like CPA and ROAS.
How to analyze Facebook Ads metrics
Analyzing Facebook Ads metrics is essential for understanding what’s working, what needs improvement, and how to drive better results for your clients. There are two main ways to review performance data: Directly inside Facebook Ads Manager or through a third-party reporting platform. Let’s explore further.
Using the Facebook Ads interface
Facebook Ads Manager gives you full access to every campaign, ad set, and ad-level metric. Here’s how to get the most out of it:
Start with the right columns: Switch to a preset like Performance or Performance & Clicks. Alternatively, customize your columns to include impressions, clicks, CPC, CTR, conversions, CPA, and ROAS.
Use breakdowns to understand behavior: Look at results by age, gender, ad placement, device, or time of day to see which segments are driving the strongest results.
Compare date ranges: Use the date selector to compare performance week-over-week or month-over-month. This helps you identify trends, ad fatigue, or seasonal shifts.
Check delivery first: Review impressions, reach, frequency, and CPM to confirm your ads have enough visibility before analyzing deeper performance metrics.
Evaluate engagement and results: Look at CTR, clicks, conversions, and cost metrics to understand whether your ads are resonating and driving meaningful actions.
Review attribution: Use the attribution settings to understand how Facebook credits conversions. This helps explain why certain results appear higher or lower than on other platforms.
Using a 3rd party platform
A third-party platform consolidates marketing data and makes analysis far more efficient. Instead of toggling between multiple ad accounts, tabs, and date ranges, you’ll get one unified view of your clients’ data. A platform like AgencyAnalytics makes it simple to see exactly how client campaigns are performing—all in one place. Forget jumping between platforms or piecing together spreadsheets; this is the easier, smarter way to track what matters. Use this tool to:
Automatically retrieve data across 80+ platforms.
Get a clear view of key metrics—impressions, clicks, conversions, ROAS, and more.
Monitor real-time data without digging through each client’s individual Facebook Ads account.
Benchmark Facebook Ads results to understand how your clients compare to industry norms.
And that’s just the start. Using a centralized platform saves time, improves accuracy, and makes it much easier to show clients the results you’re driving.
I’ve been using AgencyAnalytics for a few years now. The product has evolved immensely, and the fact I can use it for Google Ads, SEO, and Facebook Ads reporting makes life that much easier!

Mitch Gibson Coaching
Streamline your Facebook Ads metrics reporting with AgencyAnalytics
Effective Facebook advertising starts with understanding how the platform measures performance—and knowing which metrics actually matter. When you focus on the right data, campaigns stay aligned with client goals, targeting improves, and results become easier to optimize.
It’s also equally important to share those results in an easy-to-understand format. After all, clear reporting builds trust and reinforces the value of your work. But as your roster grows, manually checking campaigns and assembling reports becomes time-consuming and difficult to scale.
AgencyAnalytics simplifies the process by bringing all key Facebook Ads metrics together in one place, alongside campaign metrics from other marketing efforts. That way, you’ll be in a much better position to track performance across multiple channels, create impactful reports, and share data-driven insights that clients will appreciate.
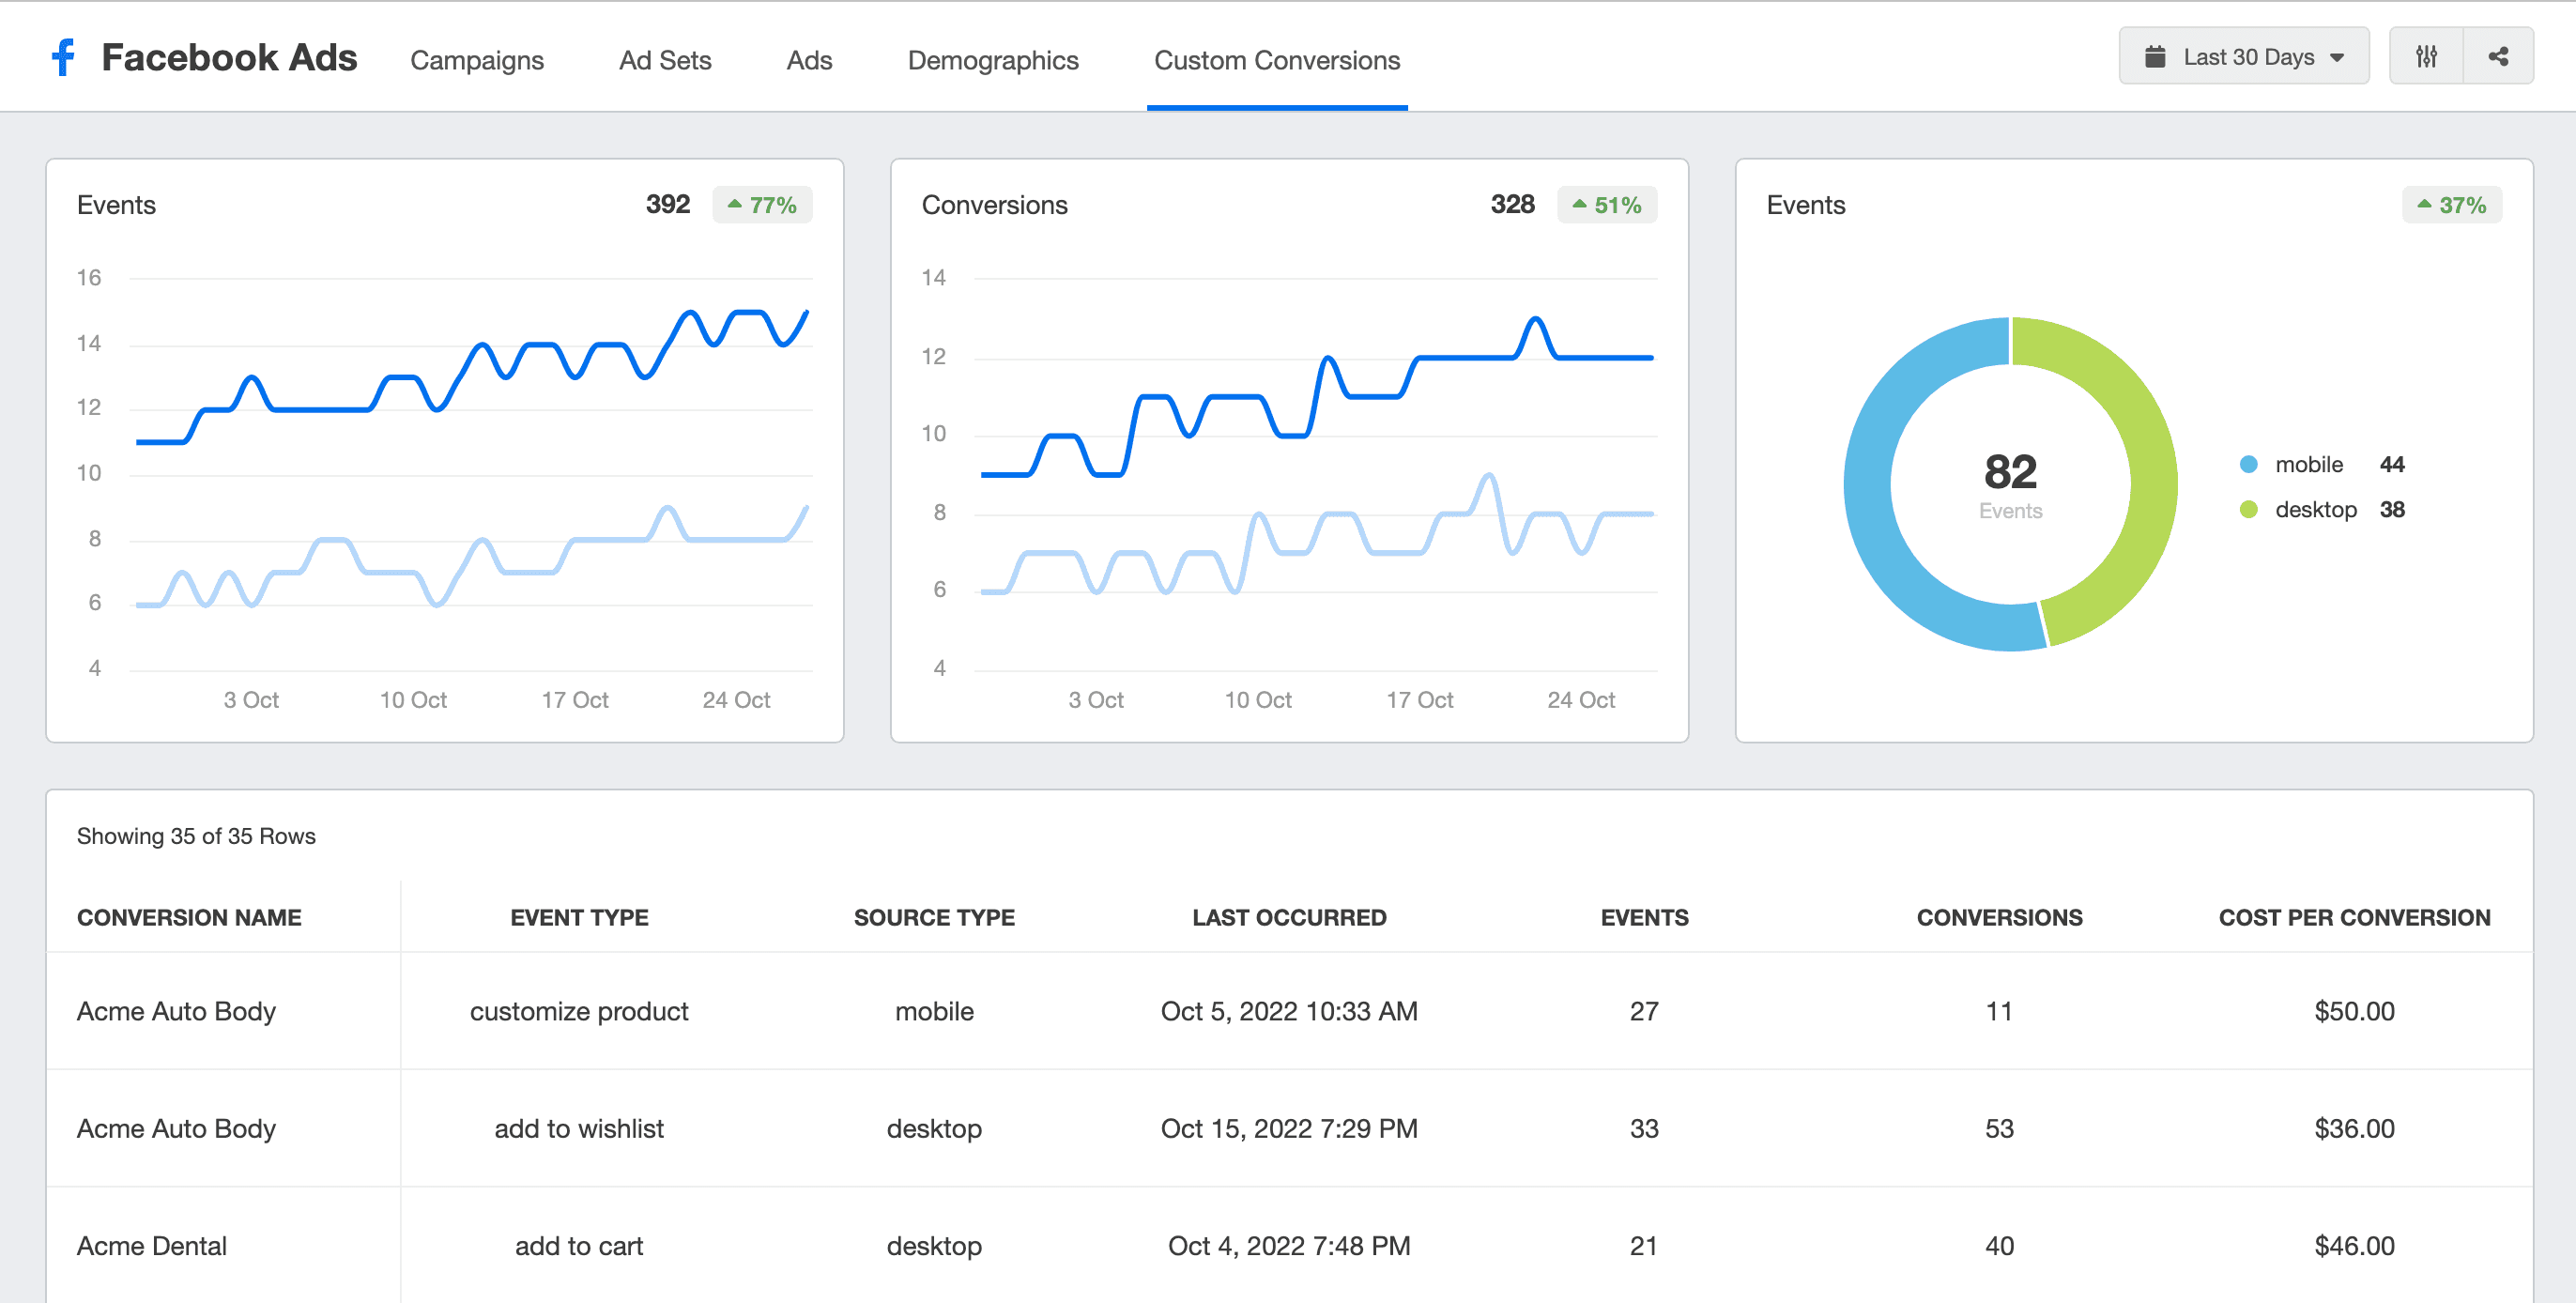
No need to log into each client’s Facebook Ads account–consolidate all this data in one place. Try the Facebook Ads integration in AgencyAnalytics–it’s free for 14 days.
FAQs About Facebook Ads Metrics
Looking for more insights into Facebook Ads metrics? We’ve got you covered.
When running Facebook ads, agencies should categorize metrics into five key types. This structure simplifies reporting, filters out noise, and helps clients see how Facebook ad performance aligns with their business goals.
Performance Metrics: Measure how effectively ads achieve desired outcomes such as conversions, sales, or leads. Key metrics include conversion rate, cost per action (CPA), return on ad spend (ROAS), and cost per conversion. These are the clearest indicators of profitability and campaign success.
Delivery Metrics: Reveal how ads are served and distributed to the audience. Important metrics include impressions, CPM (cost per 1,000 impressions), reach, and ad frequency. They help you understand whether the campaign is reaching enough people at a sustainable advertising cost.
Engagement Metrics: Track how users interact with ad content. Focus on click-through rate (CTR), post engagement, reactions, comments, and shares. These metrics show audience engagement and are strong indicators of ad relevance and creative effectiveness.
By grouping your Facebook ads metrics list this way, you create a focused reporting structure that highlights what truly drives outcomes—allowing agencies to make smarter, data-driven optimizations for better ads.
The best KPIs for Facebook ads vary by campaign objective, but typically include Click‑through rate (CTR), Cost per click (CPC), Return on ad spend (ROAS), and Conversion rate. For awareness campaigns you might prioritize CPM and reach; for lead generation you’ll track cost per lead and conversions. It’s important to align the Facebook ads KPIs with overall client goals — target audience size, budget limits, high quality leads vs volume — rather than chasing every metric in the dashboard.
CTR and post engagement show whether your client’s audience is clicking, reacting, or commenting on ads. High engagement means the messaging and creative are working. Low numbers suggest the need to change the visuals, copy, or targeting. These metrics guide ad adjustments that improve conversions and help clients reach campaign goals faster.
AgencyAnalytics centralizes Facebook ad metrics in one dashboard. There’s also the option to create login profiles, which gives clients on-demand access to real-time data. Additionally, agencies can easily deliver professionally designed, white labeled, and fully customizable reports–all with one tool. This holistic view helps clients understand how Facebook Ads fit into their broader digital marketing mix, rather than existing in isolation.
A Facebook ad is performing well when it meets or exceeds industry benchmark values for CPC, CTR, CPA, and ROAS based on your client’s industry and funnel stage. For instance, a high CTR paired with low conversions might hint at ad copy or landing page issues despite good engagement. Conversely, low frequency and high relevance score with above‑average ROAS suggests optimal targeting and creative.
Impressions show how often ads are seen. On the other hand, CPM shows how much it costs to reach 1,000 views. These metrics reveal whether the ad spend is reaching the right audience at a sustainable cost. While impressions and CPM (cost per 1,000 impressions) are foundational delivery metrics, it’s equally important to cross‑reference ad frequency, ad content variation, and placement performance (e.g., News Feed vs Audience Network).
A campaign with low CPM but high frequency may be oversaturating the same audience, raising the risk of declining effectiveness. Monitoring the ratio of impressions to reach provides insight into how many unique users saw your ad versus repeat views — a key indicator of healthy campaign delivery.
Vanity metrics are numbers that look impressive but don’t link to meaningful business outcomes or ad success. In Facebook Ads, examples include video views without duration context, likes that don’t lead to clicks or conversions, and reach or impressions unaccompanied by engagement or actions. Such metrics may inflate perceived performance but fail to drive ROI or revenue. Agencies should steer clients away from focusing on these alone, and instead prioritize metrics like conversion rate, ROAS, and cost per acquisition.
ROAS quantifies the revenue returned for every dollar spent. High ROAS confirms campaign profitability, while low ROAS highlights inefficiencies (e.g., poor audience targeting, weak ad creative, or an underperforming landing page). It’s the clearest way to show clients whether ads are worth the investment. Beyond the basic ROAS (return on ad spend) metric, agencies should tie ROAS back to specific campaign view insights—such as which placements, creatives or audiences contributed most to high‑return ads. Segmenting ROAS by variable groups (e.g., video ads vs static images) uncovers where your budget delivers the most value.
Custom conversions track the exact actions clients care about, like purchases, form submissions, downloads, or signups. They add a layer of specificity and align reporting with tangible business outcomes. Custom conversions are powerful—but they’re most effective when paired with proper setup, domain verification, and consistent tagging across your site or app. By assigning unique conversion events for actions like “newsletter signup,” “add to cart,” or “checkout completed,” you enrich your Facebook ads analytics with business‑relevant behavior.

Written by
Melody Sinclair-Brooks brings nearly a decade of experience in marketing in the tech industry. Specializing in B2B messaging for startups and SaaS, she crafts campaigns that cut through the noise, leveraging customer insights and multichannel strategies for tangible growth.
Read more posts by Melody Sinclair-BrooksSee how 7,000+ marketing agencies help clients win
Free 14-day trial. No credit card required.


