Table of Contents
Table of Contents
- What is a KPI report?
- Why are KPI reports important?
- What are KPI reports used for?
- How do you measure KPIs?
- Which key performance indicators should you use?
- Types of KPI reports
- 7 KPI report examples and templates
- How to create a KPI report
- KPI reporting best practices & common mistakes
- Streamline and automate your KPI reporting
7,000+ agencies have ditched manual reports. You can too.
Free 14-Day TrialQUICK SUMMARY:
Key performance indicators (KPIs) serve various purposes, like tracking progress, analyzing historical data performance, guiding resource allocation, and informing business intelligence decisions. More specifically, KPI reports show how campaigns support business goals and share insights in a way that’s easy to understand. This article breaks down everything about KPI reporting, from choosing relevant metrics to building actionable reports. It also includes clear KPI examples, data insights, and templates to help your agency measure performance with confidence.
Choosing the right KPIs starts with understanding what your client is trying to achieve. They need actionable metrics that tie directly to their broader goals, not just numbers for the sake of reporting. But when you’re pulling data from multiple platforms and trying to determine what actually matters, things get overwhelming fast.
That’s exactly why KPI reporting is so important. It clearly communicates the real impact of your work, helps clients understand how their marketing is performing, and keeps everyone aligned on what success truly looks like.
In this article, we’ll walk through how to choose meaningful KPIs, structure them into a clear report, and highlight insights clients will actually use. We’ll also cover why an automated reporting tool is a must-have for delivering accurate and timely KPI reports.
What is a KPI report?
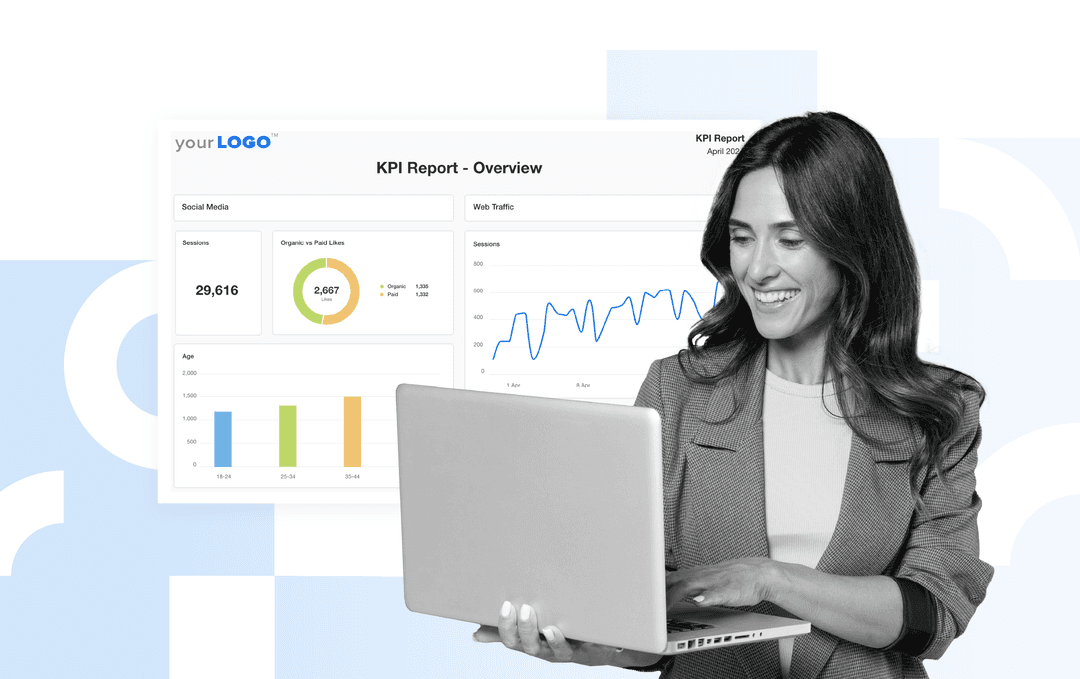
A KPI report is a structured summary of the key metrics that show how well a client or campaign is performing against specific goals. Instead of listing every available data point, a KPI report highlights only the indicators that matter most, such as conversions, cost per lead, search visibility, or engagement rate. Think of it as a highlight reel that surfaces only the most meaningful insights.
Essentially, KPI reports are a strategic tracking method that delivers a window into your clients’ most essential activities and results.
Why are KPI reports important?
KPI reports bridge the gap between day-to-day performance and a client’s broader business goals. By focusing on the metrics that matter most, they give clients a clear view of how their marketing activities are contributing to meaningful outcomes.
KPIs are important to our agency because they give us common metrics that the client and us agree are valuable, allowing us to have beneficial conversations that move their business in the direction they want. We're not wasting time or resources moving metrics positively that the client doesn't understand.
Lane Rizzardini, Co-Owner, Marion Relationship Marketing
More specifically, KPI reports:
Clarify performance: Numbers alone don’t mean much until they’re tied to context. KPI reports show what success looks like in measurable terms (e.g., a 12% increase in recurring revenue or a 5% drop in churn).
Focus effort: KPI reporting narrows the lens to the few metrics that truly drive business growth. That way, your team is able to identify and improve what matters most to the client.
Visualize what matters: Well-designed KPI reports transform complex data into clear, easy-to-understand data visualizations. That way, clients can immediately understand performance without digging through raw numbers.
At their best, KPI reports are less about reporting and more about learning. They replace intuition with evidence, align teams around shared priorities, and create a continuous feedback loop for improvement.
What are KPI reports used for?
A well-built marketing KPI report shows where progress is strong, where momentum is slowing, and where your agency needs to make adjustments. Here are some use cases to provide additional context.
1. Monitor company health
KPIs are like a scorecard for company health. Only measure what your clients think are the most important KPIs that align with their larger business goals (e.g., they could be growth-related, such as new customers or sales).
By aligning on what matters most, you'll create reports that are based on actual outcomes, not vanity metrics.
Any metric taken in isolation is a vanity metric. To understand performance, you need a range of KPIs, and they need to be analyzed together. For example, traffic is no good unless you understand what keywords are driving that traffic and whether they're generating conversions or sales.
Paul Morris, Managing Director, Superb Digital
2. Track progress
It's typical to set targets at the beginning of each year and quarter, then using weekly KPIs to measure progress towards these larger goals.
This approach provides consistent visibility into how initiatives are steadily performing, making it easier to address issues before they impact results.
Measure real-time progress towards revenue growth, cash flow goals, and other financial KPIs. Include this goal and budget tracking feature in your own KPI report–try AgencyAnalytics, free for 14 days.
3. Spot patterns in performance
Consistent KPI tracking makes it easier to identify trends over time. Whether it’s a spike in engagement during a launch or a gradual drop in organic traffic, these patterns make it easier to see what’s working and what needs attention.
Need a quick way to identify those trends? Try the Ask AI feature in AgencyAnalytics—it’s an efficient way to uncover wins, flag emerging issues, and surface insights you might otherwise miss.
4. Adjust strategy and stay on track
Once trends emerge, use KPI data to adjust marketing campaigns in real time. If conversion rates dip, it’s a sign to refine messaging or landing pages. A rise in email open rates, on the other hand, can reveal which types of content or subject lines are resonating most.
KPI insights provide your agency with a clear path forward, which gives clients confidence that their strategy is moving in the right direction.
When you use KPIs to clearly demonstrate your client’s ROI from your efforts month over month, it increases your retention rate and keeps clients paying you month after month.
Jacob Hicks, Owner, Magnyfi
How do you measure KPIs?
KPI measurement comes down to collecting accurate data from the right sources. After deciding on targets, most KPIs are tracked through tools like Google Analytics, CRM platforms, ad managers, email providers, and social media channels. Here’s an overview of how diverse those sources can be:
KPI | Source |
|---|---|
Organic search rankings | |
Social follower growth | |
Conversion rate |
Needless to say, it’s a lot of data to keep track of, especially when you’re managing multiple clients.
To avoid anything slipping through the cracks, invest in a solid reporting tool that does the heavy lifting for you. That way, you won’t have to worry about taking screenshots, compiling performance metrics in a spreadsheet, or data accuracy issues.
Impress clients and save hours with custom, automated reporting.
Join 7,000+ agencies that create reports in under 30 minutes per client using AgencyAnalytics. Get started for free. No credit card required.
Already have an account?
Log inWhich key performance indicators should you use?
A helpful way to narrow this down is by using a mix of leading and lagging KPIs. For reference:
Leading KPIs signal what’s likely to happen next. They’re early predictors of performance, like engagement rate, website traffic quality, or email click-throughs. These metrics help agencies anticipate results and adjust strategy before outcomes are locked in.
On the other hand:
Lagging KPIs show what has already happened. They reflect final outcomes such as revenue, conversions, or customer acquisition. These metrics confirm whether your strategy produced the intended results.
In other words, leading indicators reveal momentum, while lagging indicators validate impact. To break this down further, the following are examples of leading and lagging indicators.
Examples of leading KPIs
Leading KPI | Why it’s important |
|---|---|
Indicates whether SEO and content efforts are gaining traction before conversions follow. | |
Social media engagement | Shows how well content resonates with the audience and predicts future reach and traffic. |
Email open rate | Signals whether subject lines and sender reputation are effective and if subscribers are paying attention. |
Reveals whether email content and calls to action are compelling enough to drive next steps. | |
Ad click-through rate (CTR) | Predicts ad performance by showing whether targeting and creative are attracting the right audience. |
Landing page scroll depth | Measures early engagement and suggests how likely visitors are to convert. |
Number of marketing qualified leads | Provides an early read on the volume and quality of leads before revenue outcomes are known. |
Returning website visitors | Indicates audience interest and relevance, often preceding higher conversion rates later. |
Net Promoter Score (NPS) | Measures how likely customers are to recommend the brand. This customer satisfaction score is an early indicator of future loyalty, retention, and long-term growth potential. |
Examples of lagging indicators
Lagging KPI | Why it’s important |
|---|---|
Conversion rate by marketing channel | Confirms which channels delivered the strongest results and where ROI is highest. |
Shows how much it actually costs to acquire a lead and whether campaigns are financially efficient. | |
Sales revenue | Validates the bottom-line impact of marketing and sales efforts. In turn, this any sales team to helps forecast future business performance. |
Number of customers acquired | Indicates overall effectiveness of marketing, sales, pricing, and customer experience. |
Customer lifetime value (CLV) | Reflects long-term financial value of acquired customers and helps guide budget allocation. |
Landing page conversion rate | Demonstrates how effectively landing pages turn visitors into leads or customers. |
Confirms whether paid campaigns generated profitable returns relative to the client’s marketing investment. |
Types of KPI reports
There are different types of KPI reports depending on a client’s goals, marketing channels, and business model. Each type serves a distinct purpose, pulling from unique data sources to deliver meaningful insights.
Here are some common KPI reports to know about:
Marketing KPI report: Tracks digital performance across channels—such as website traffic, conversion rates, and social engagement—to show how well marketing efforts are working.
Brand awareness report: Measures visibility and perception in the market using metrics like brand recall, social mentions, media coverage, and reach.
Financial KPI report: Focuses on business health indicators, including Cost of Goods Sold (COGS), customer churn rate, net profit margin, and other key financial metrics.
Customer service KPI report: Focuses on core customer service KPIs like response times, resolution rates, satisfaction scores, and support trends.
Customer Lifetime Value (CLV) report: Analyzes long-term value based on repeat purchases, average order value, purchase frequency, and customer satisfaction.
Campaign-specific KPI report: Tracks performance tied to a specific initiative, such as ROI, engagement, conversions, event attendance, or app downloads.
A strong KPI reporting framework gives clients clarity across every area of their business, helping them understand performance and stay aligned with their long-term strategic objectives.
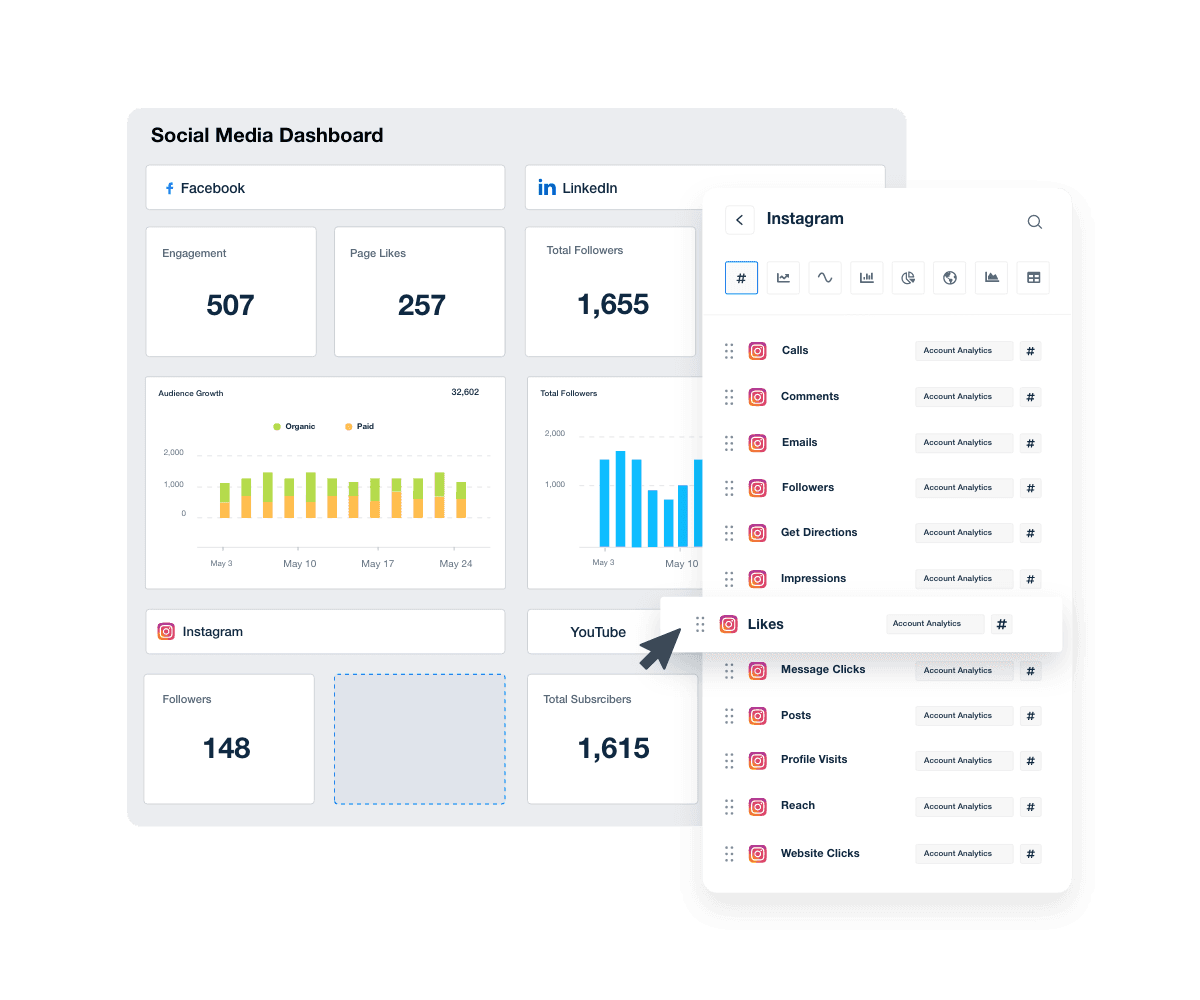
Measure progress towards KPI targets through a fully customizable dashboard. Help clients reach their strategic goals with AgencyAnalytics–sign up for a free 14-day trial.
7 KPI report examples and templates
Every client’s goals are different, and their report should reflect that. To provide the most value, we’ve compiled the seven top KPI report templates to track results and enhance operational efficiency.
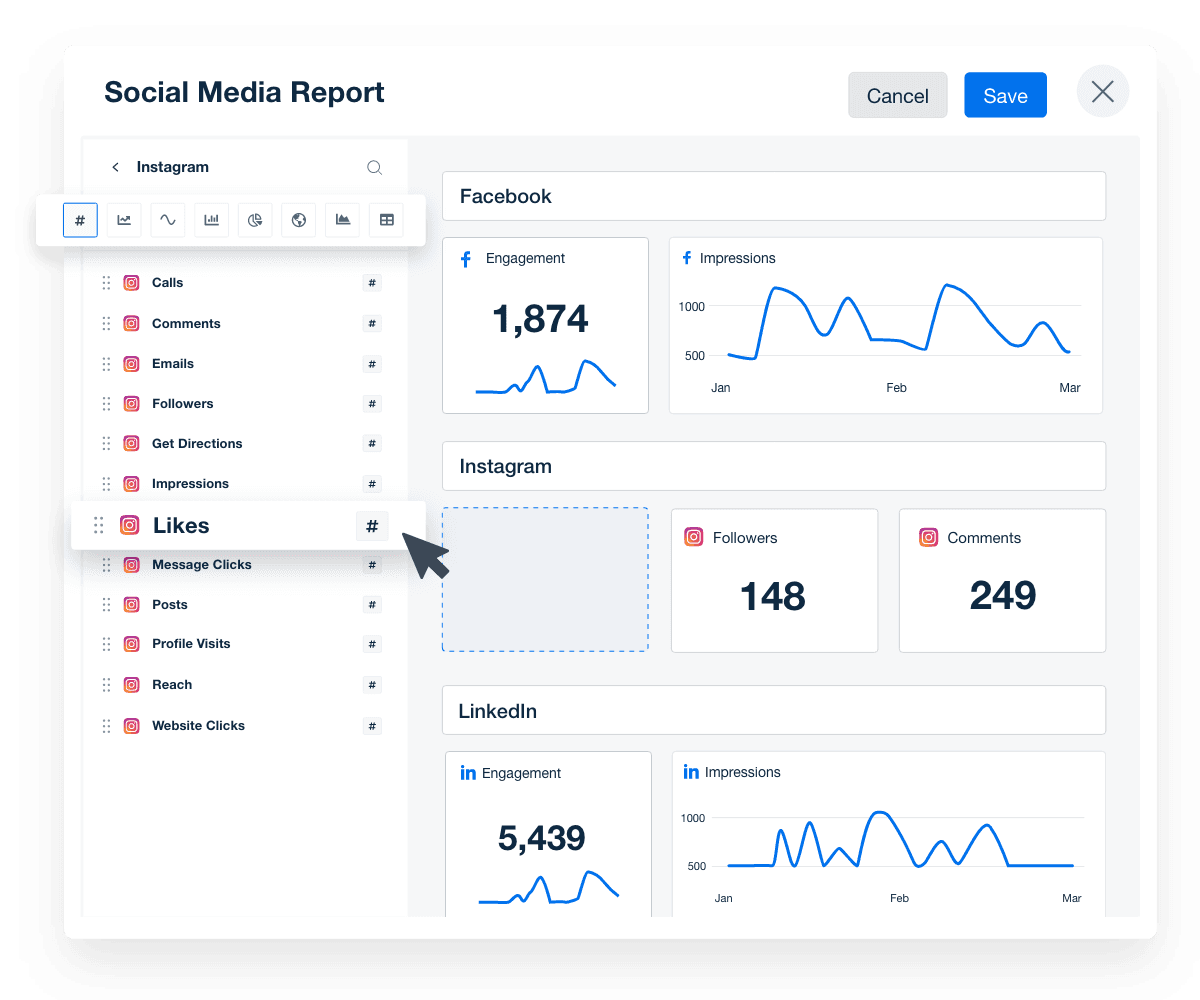
1. Social media report template
A social media KPI report helps identify which platforms and content types drive the most awareness and engagement. Use this report to track social media KPI performance across channels, monitor follower growth rate, identify top-performing content, and improve overall reach.
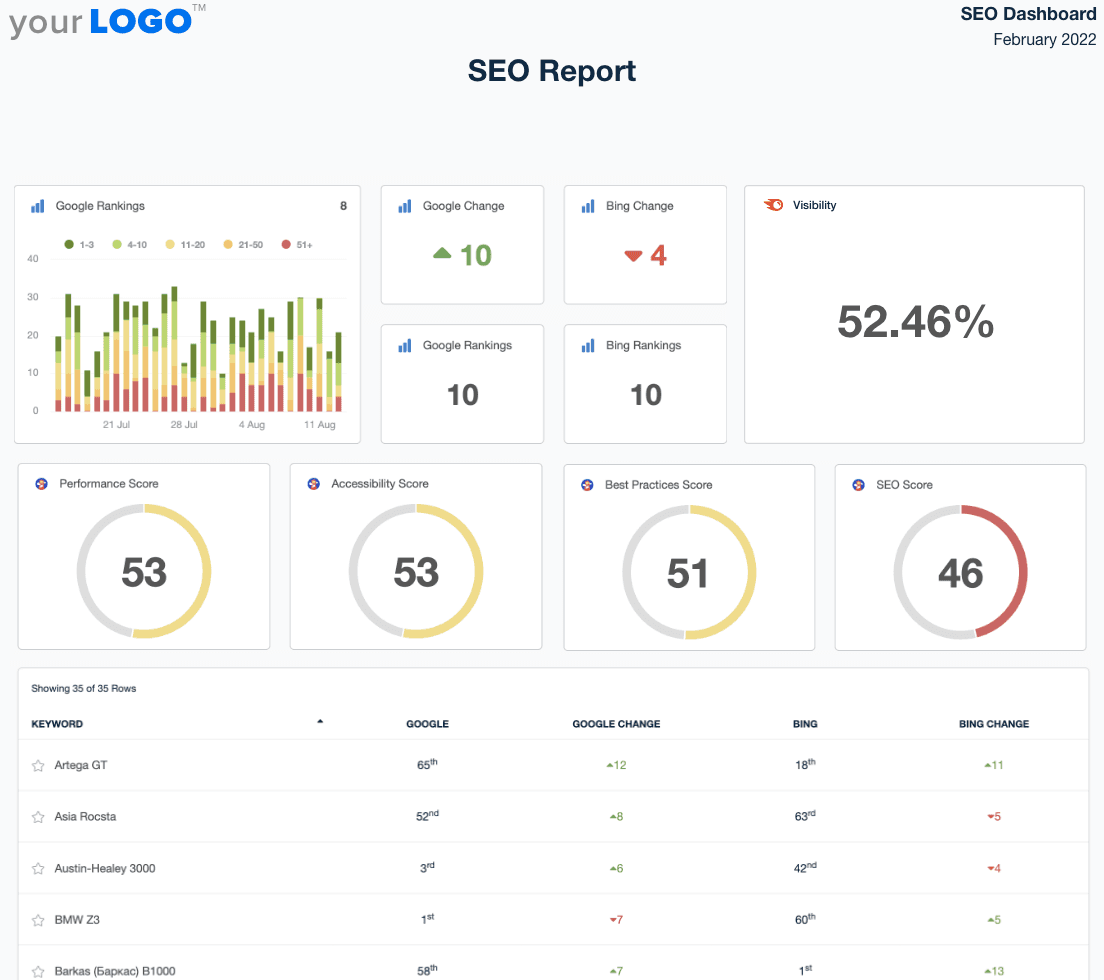
2. SEO report template
An SEO report measures visibility, ranking improvements, and organic traffic performance. Key metrics include keyword rankings, impressions, backlinks, and organic conversions. Use this template to show clients how your SEO work impacts discoverability and long-term growth.
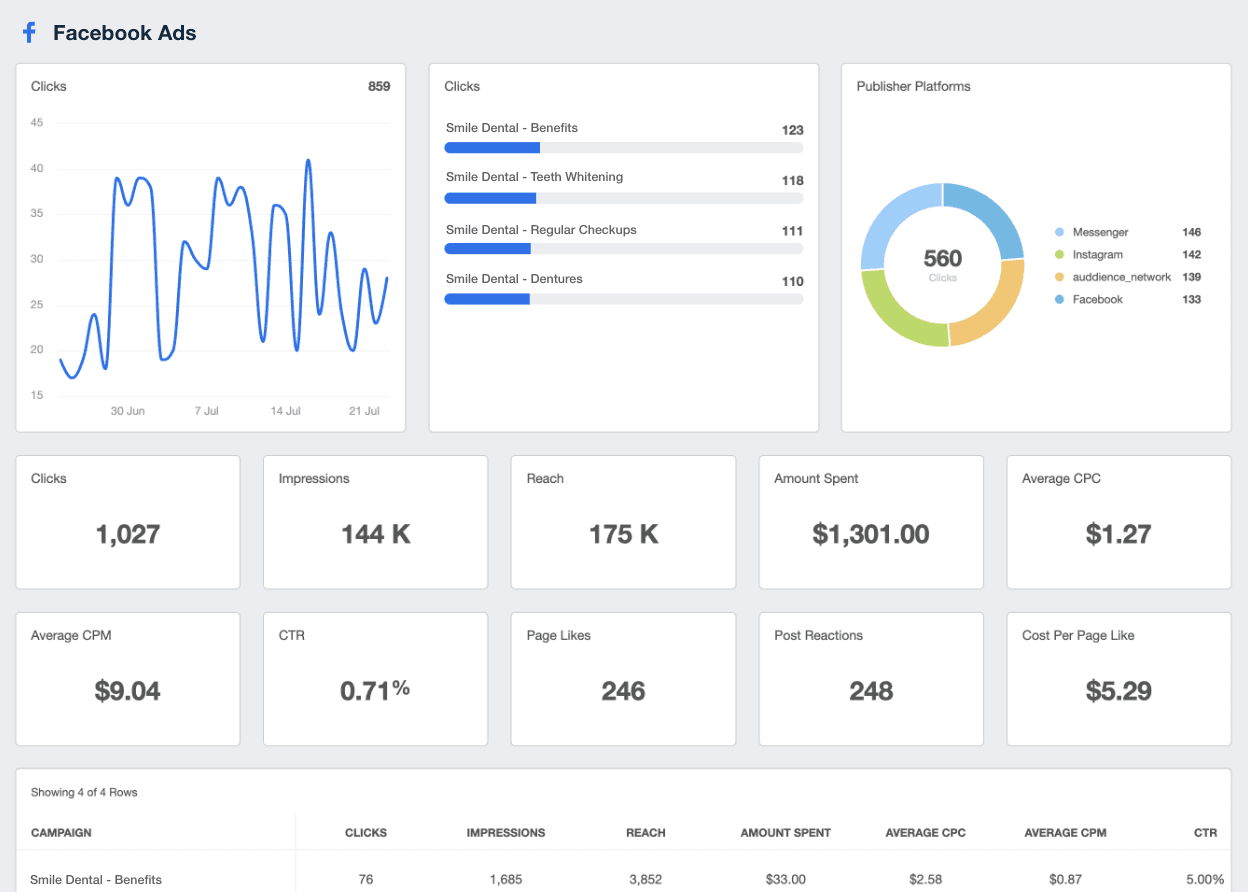
3. Facebook Ads report template
A Facebook Ads report focuses on paid performance within Meta Ads Manager. Track metrics like impressions, click-through rate (CTR), cost per click (CPC), conversions, and return on ad spend (ROAS).
It’s ideal for showing which audiences, creatives, and placements deliver the best ROI and where ad spend can be optimized.
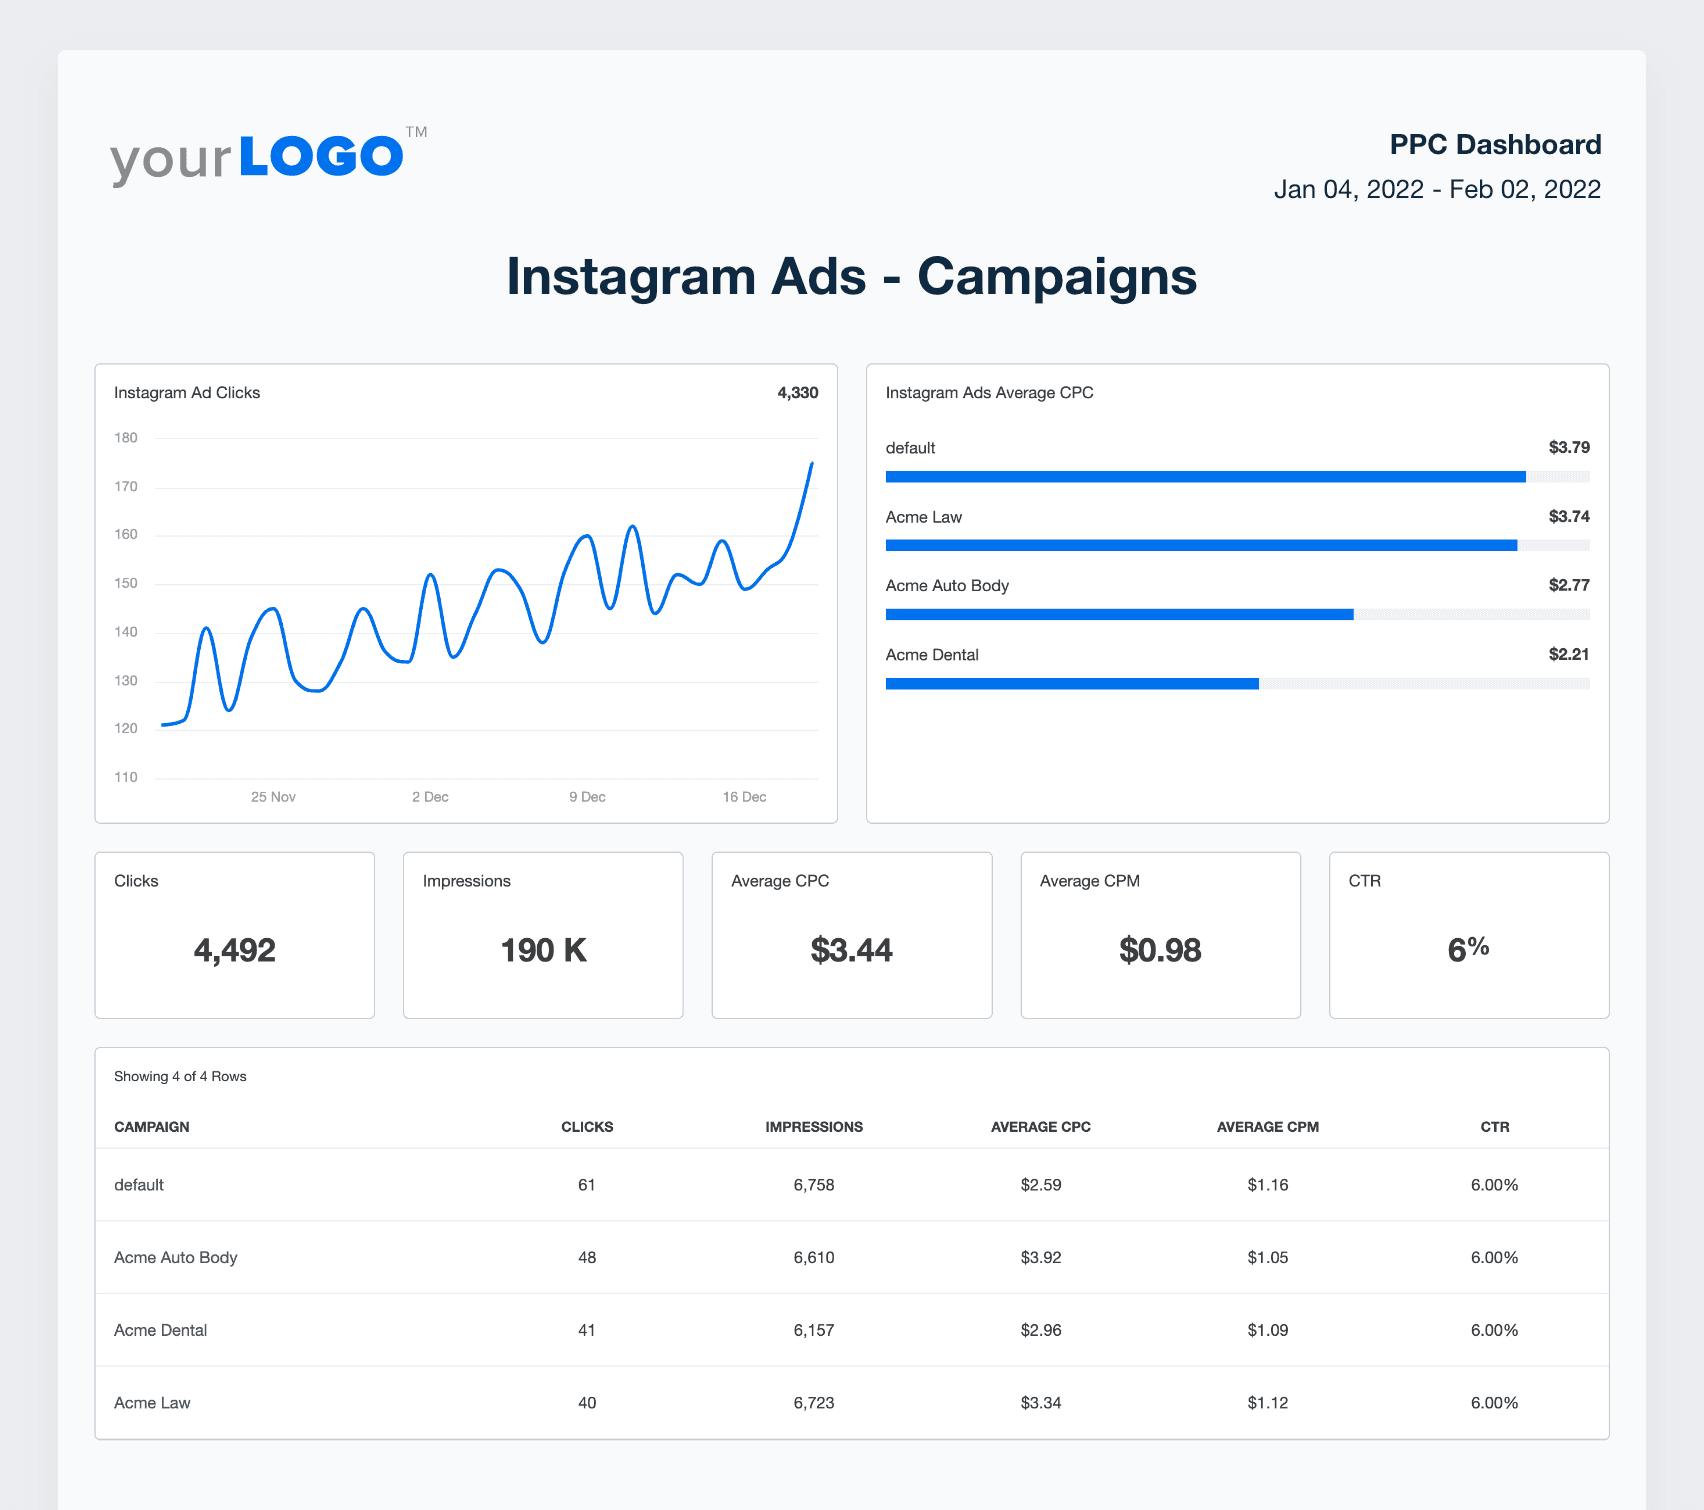
4. Instagram report template
Use an Instagram report template to analyze platform-specific metrics, including follower growth, engagement rate per post, story views, and reach by content type.
This helps visualize how visual content drives brand awareness and audience interaction. It also shows which formats (reels, carousels, stories) are performing strongest.
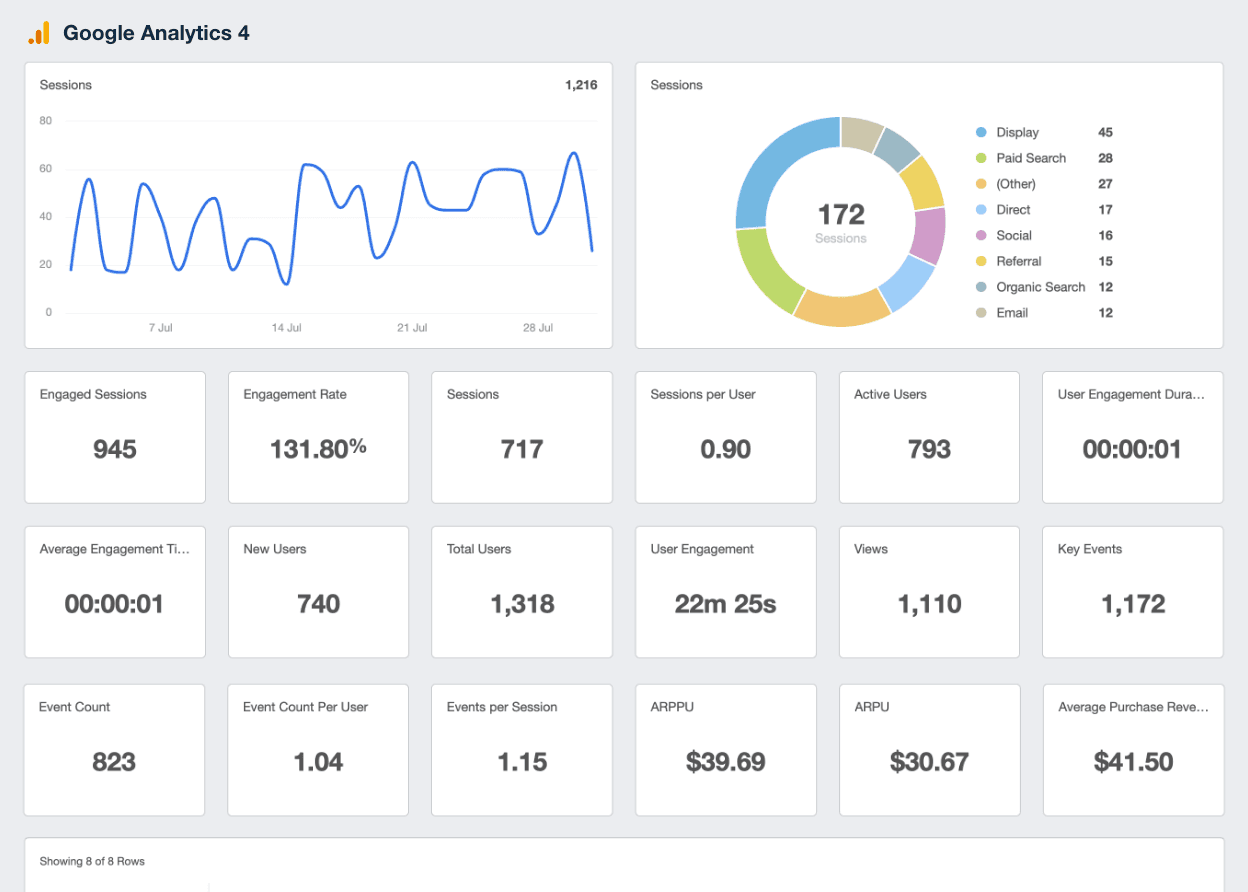
5. Google Analytics report template
This report pulls data directly from Google Analytics to show how users find and interact with your client’s website. Easily share GA metrics like sessions, traffic sources, bounce rate, top landing pages, and conversions.
A Google Analytics report template is essential for understanding user behavior, content performance, and how different channels contribute to conversion goals.
6. Web analytics report template
Similar to the Google Analytics report, this web analytics template is fully customizable, allowing your agency to provide a full view of on-site performance. Share granular page performance, top-performing web metrics, and even add widgets for Google Search Console data.

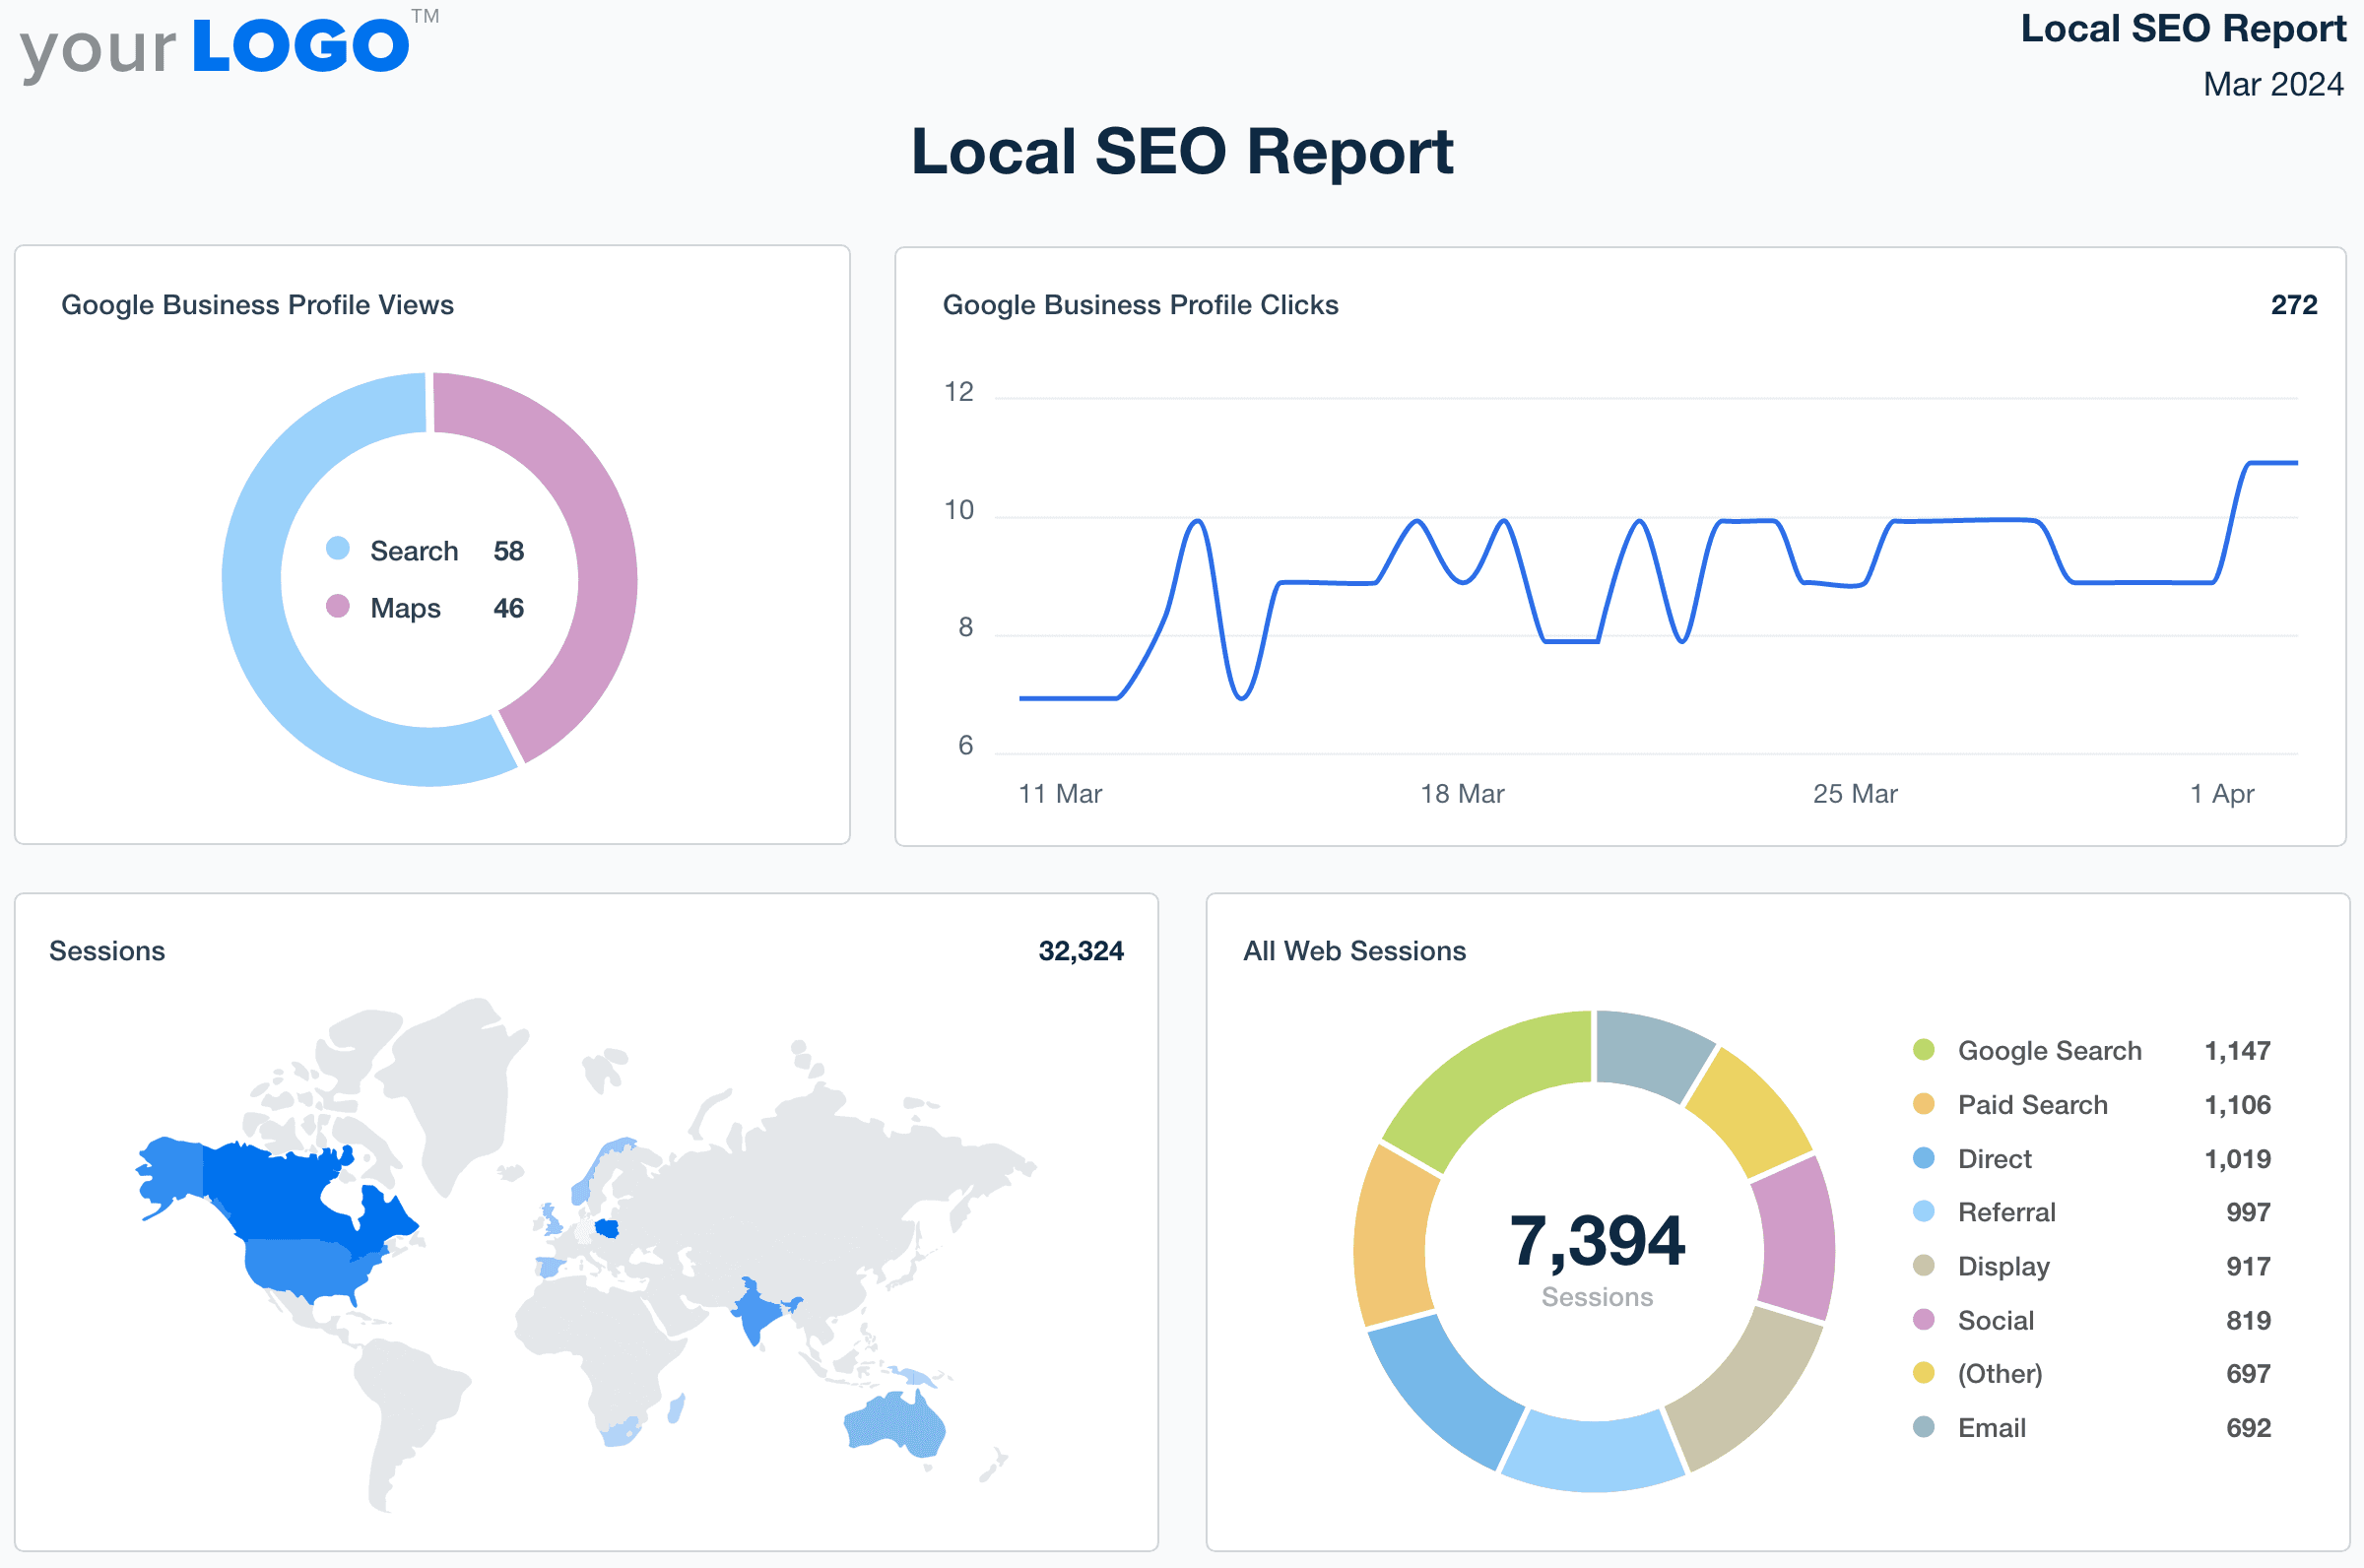
7. Local SEO report template
Perfect for clients targeting specific geographic areas, this local SEO report highlights local search visibility and engagement. Include metrics like Google Business Profile views, map pack rankings, local keyword performance, and customer reviews.
This KPI report also helps demonstrate how local SEO efforts are driving foot traffic, calls, and in-market visibility.
How to create a KPI report
Generating a KPI report doesn’t need to be complicated. The goal is to organize the right data, present it clearly, and make it easy for clients to understand performance.
Not sure where to start? Here’s a simple process to create KPI reports that deliver real insight and value.
1. Identify the client’s KPIs
Start by confirming what success looks like for your client. Once you’ve established their main business objectives, define KPIs that track progress toward those goals.
For example, if the goal is to increase revenue, relevant KPIs might include sales qualified leads, average order value, or cost per acquisition. Similarly, if the goal is to increase brand visibility, KPIs such as organic impressions, social reach, or share of voice would be more suitable.
Every client has unique challenges and goals, so it's crucial to take the time to tailor your reports to their specific needs. By doing so, you'll be able to provide valuable insights that speak directly to their business objectives, and ultimately help build stronger relationships with your clients.
Adam Binder, Founder + CEO, Creative Click Media
2. Set up your AgencyAnalytics trial
Next, sign up for an AgencyAnalytics trial to start building reports quickly–it’s free for 14 days! This gives you access to useful features like:
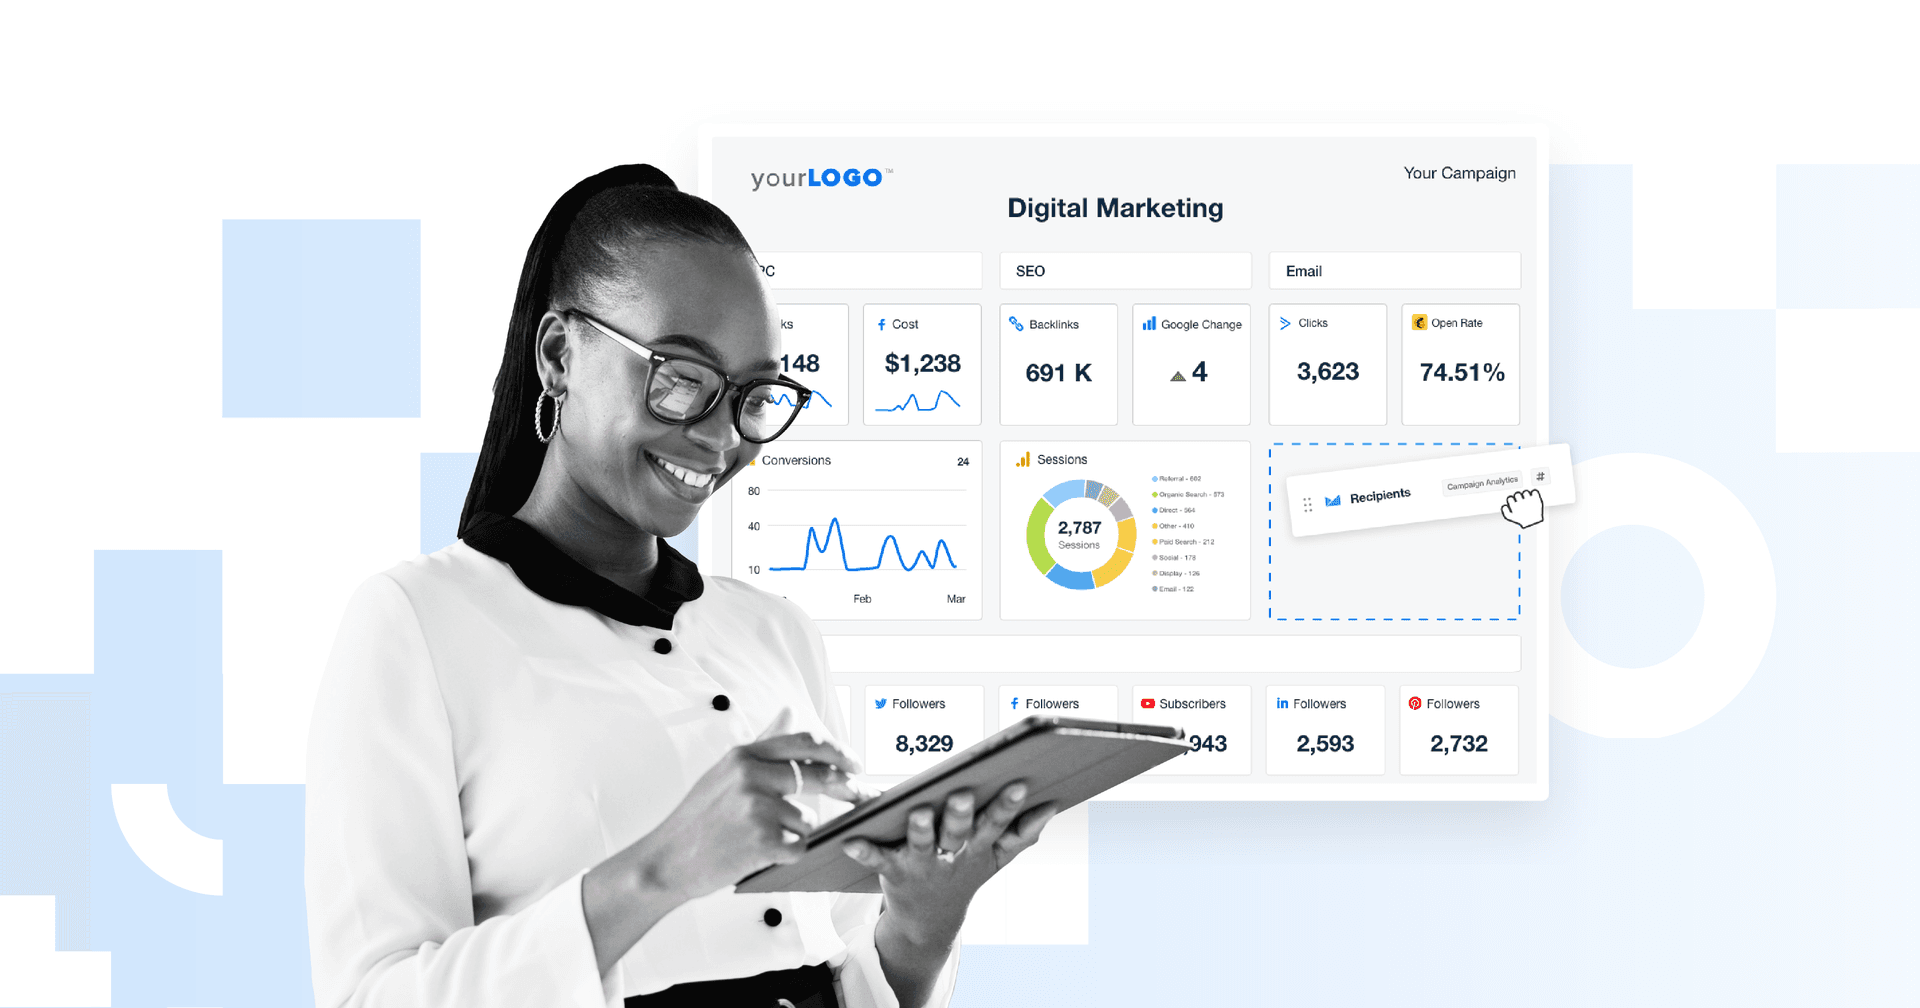
Pre-built report and KPI dashboard templates: Get access to professionally designed KPI templates for SEO, PPC, social media, email, and multi-channel reporting.
Dynamic goal tracking: Set targets for each KPI and see instantly whether performance is ahead, on track, or falling behind, making it easier to manage progress throughout the month.
First-party data benchmarks: Access aggregated performance insights to understand how your results compare to similar businesses and identify where improvement opportunities may exist.
White-labeling: Add your own logo, colors, and branding to every report and dashboard. This creates a seamless, client-ready experience without manual design work.
Impress clients and save hours with custom, automated reporting.
Join 7,000+ agencies that create reports in under 30 minutes per client using AgencyAnalytics. Get started for free. No credit card required.
Already have an account?
Log in3. Connect integrations and plug in the data
After you’ve signed up for a free trial, it’s time to connect your client’s integrations. To do this:
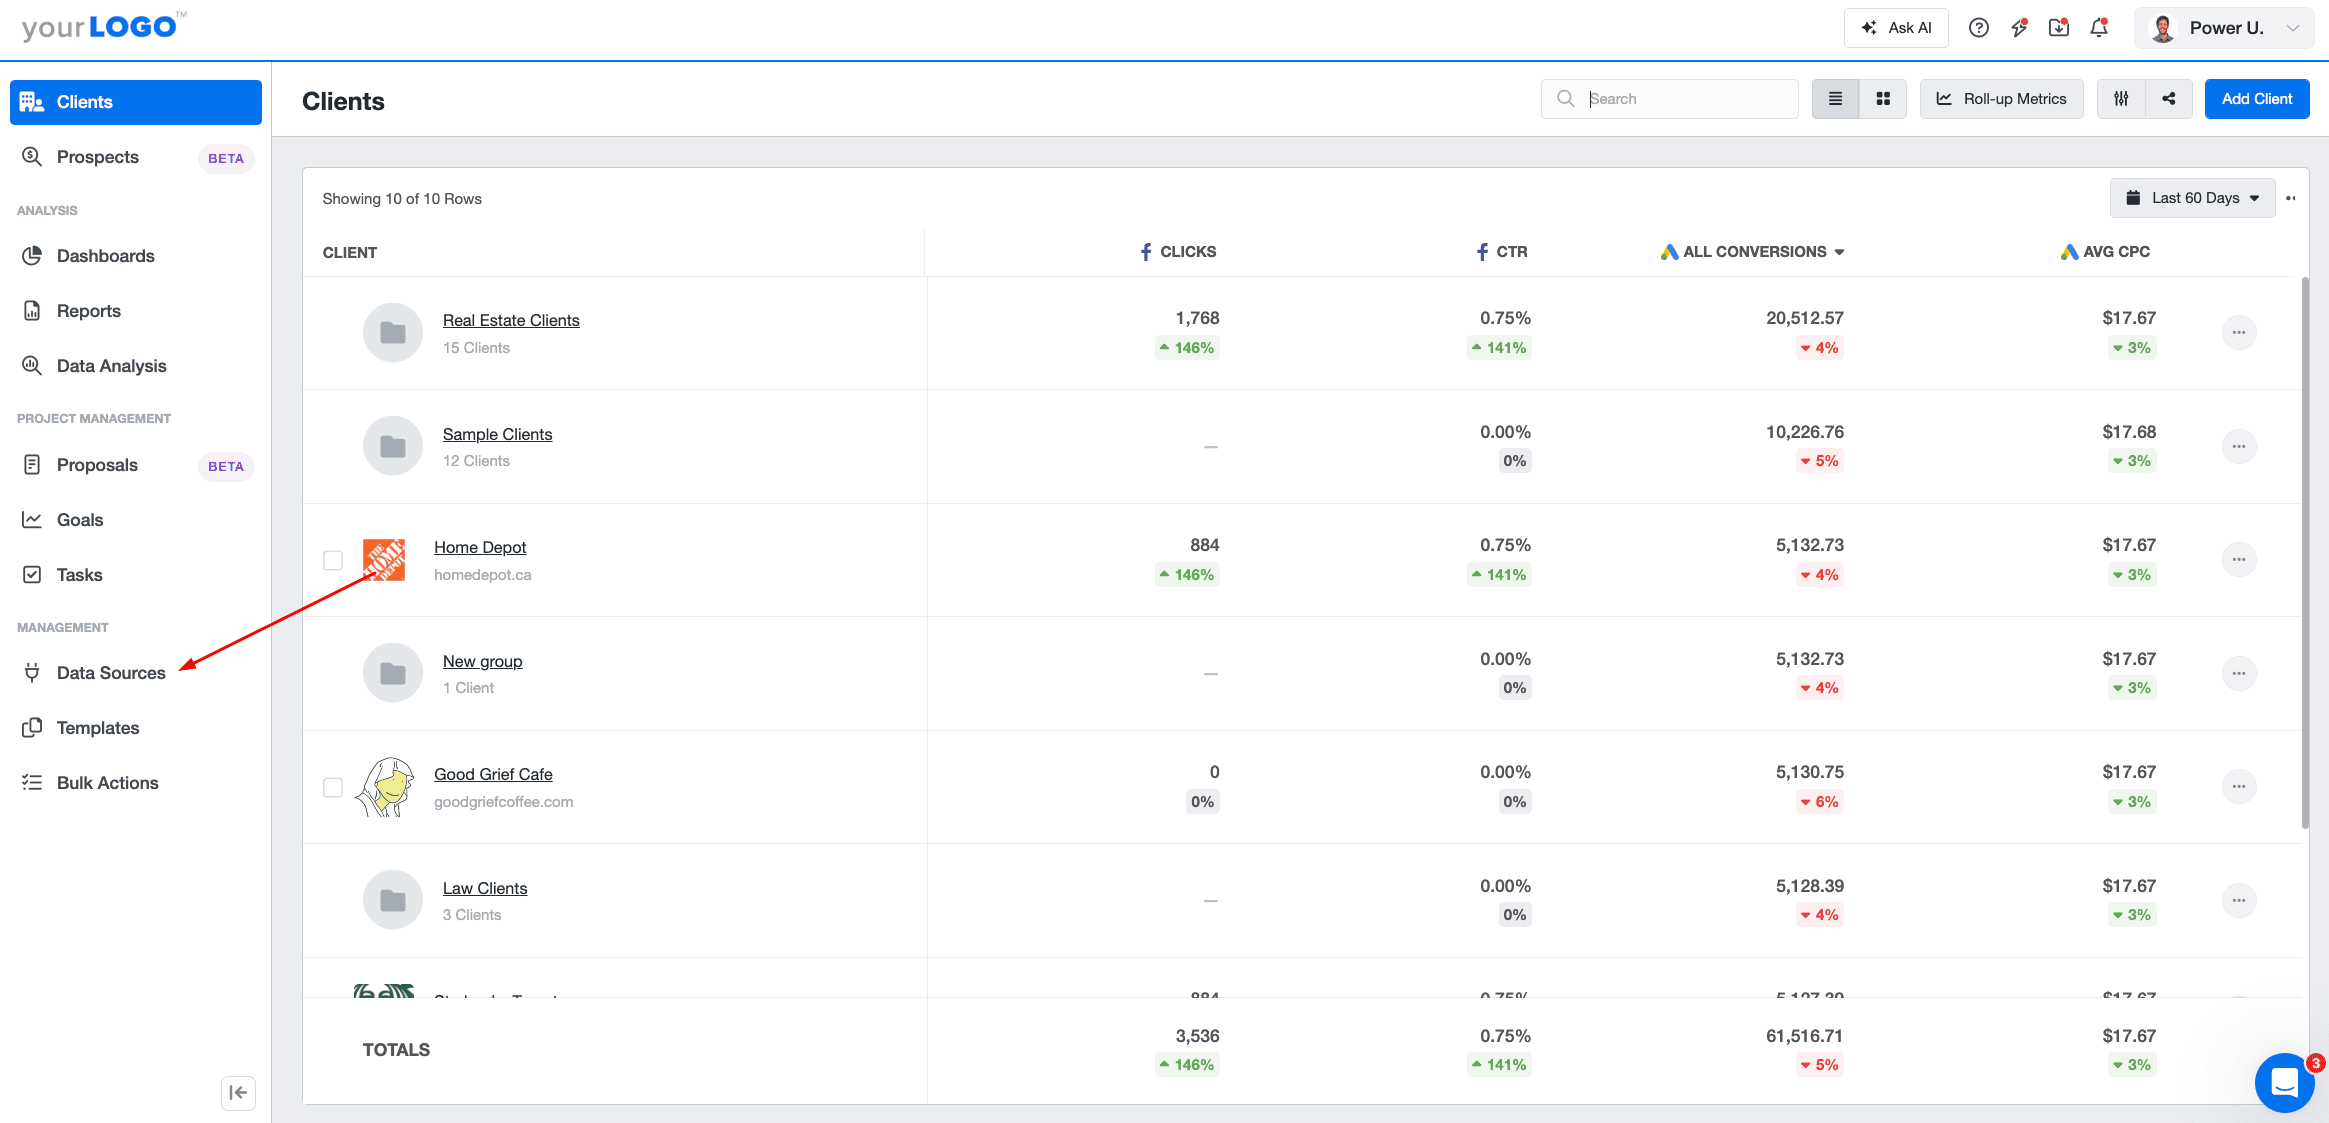
Open the “Data Sources” section from the left-hand navigation menu.
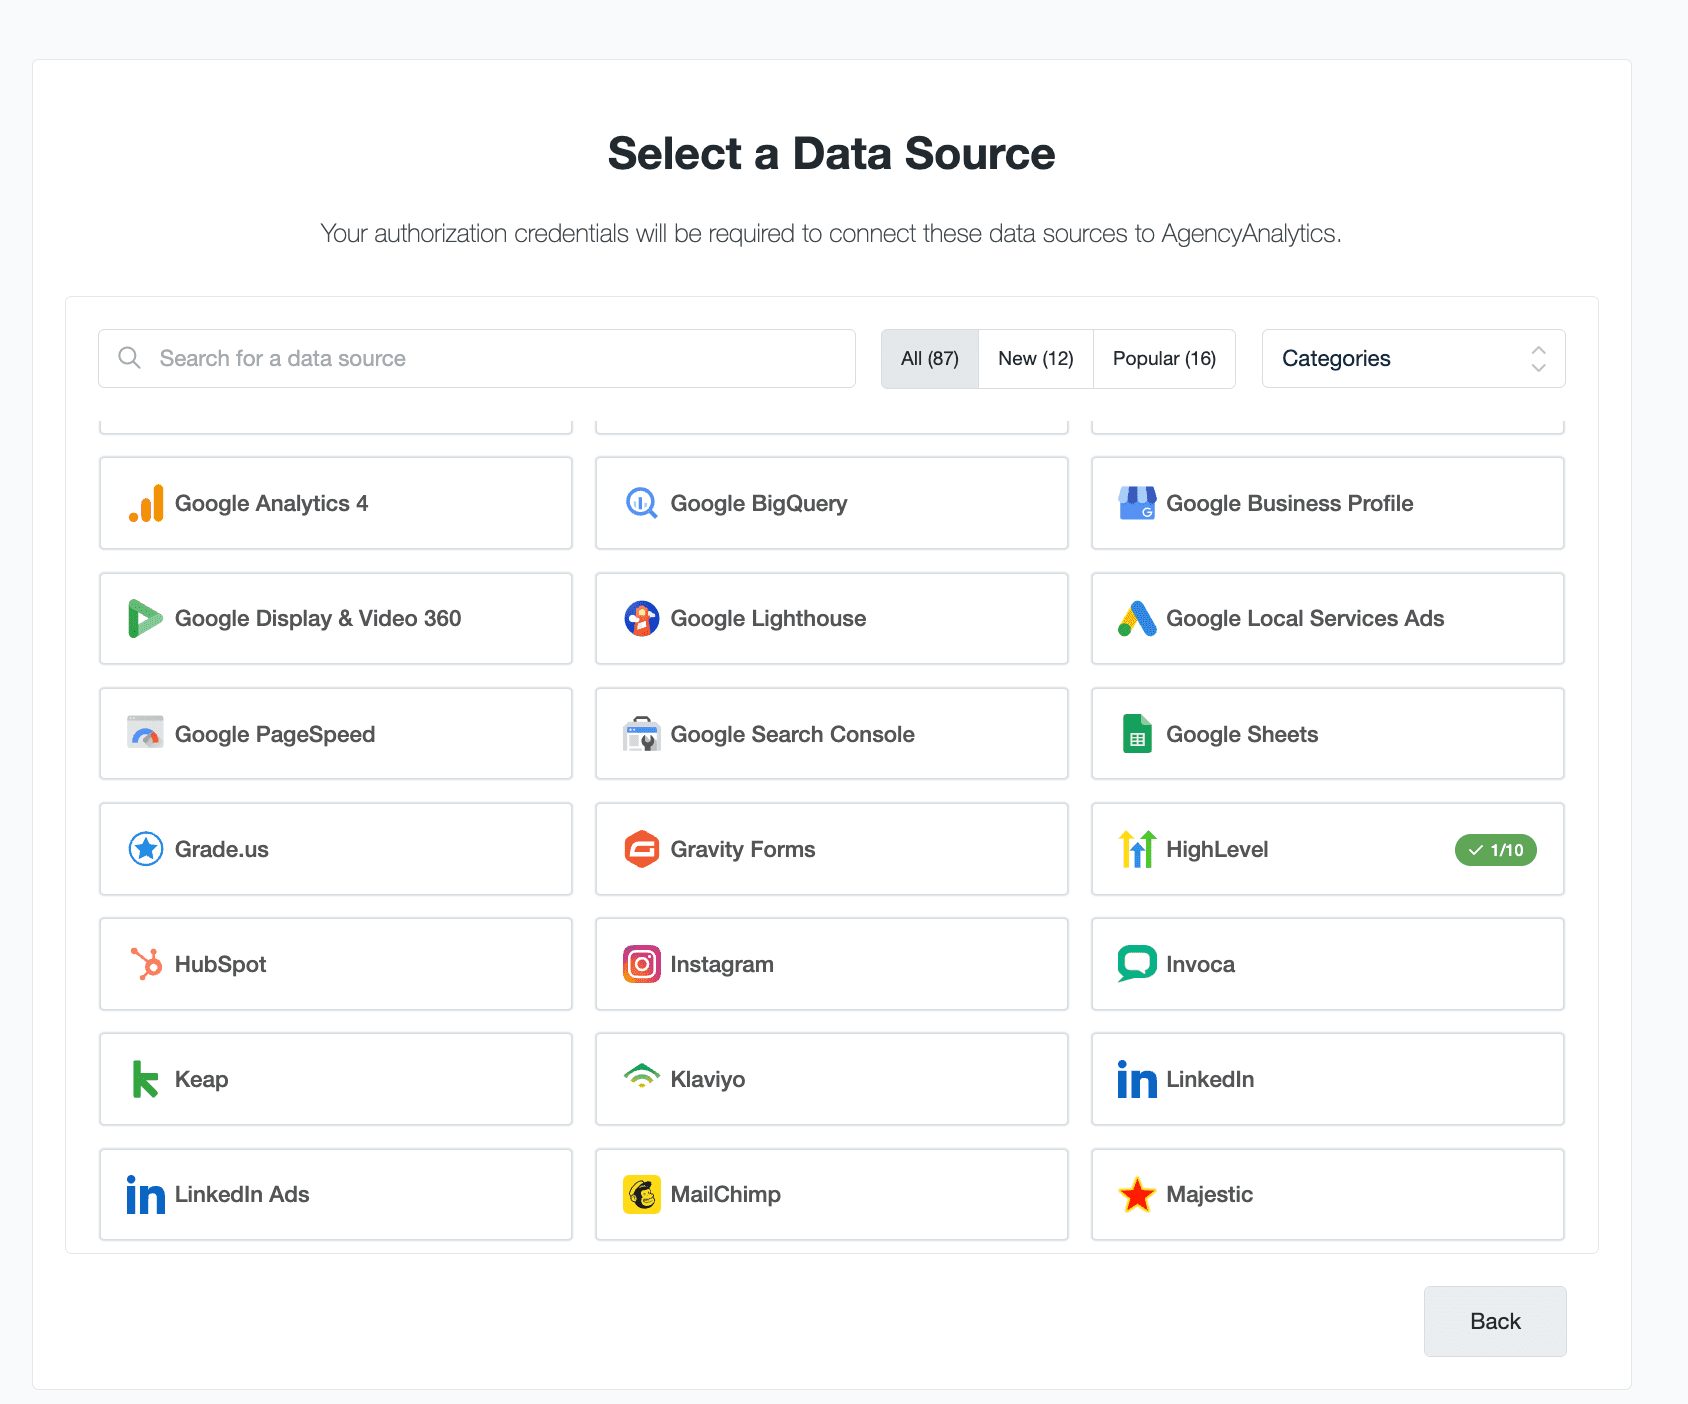
Select your client, then choose their integrations. You’ll find {{integration}}+ marketing platforms, including Google Analytics, Facebook, Mailchimp, Semrush, TikTok Ads, and more.
4. Use a Smart report or pre-built template
Once your data is connected, create a Smart Report or start with one of our pre-built templates to jump-start your KPI reporting. These options automatically pull in the right metrics and organize them into clean, client-ready layouts. Note that:
Smart Reports are best when you want the platform to identify actionable insights, highlight changes, and surface trends for you—ideal for fast, insight-driven reporting.
Pre-built templates are great when you already know which marketing KPIs you want to feature and need a structured, customizable layout.
Both options save time and ensure your KPIs are presented consistently across every client.
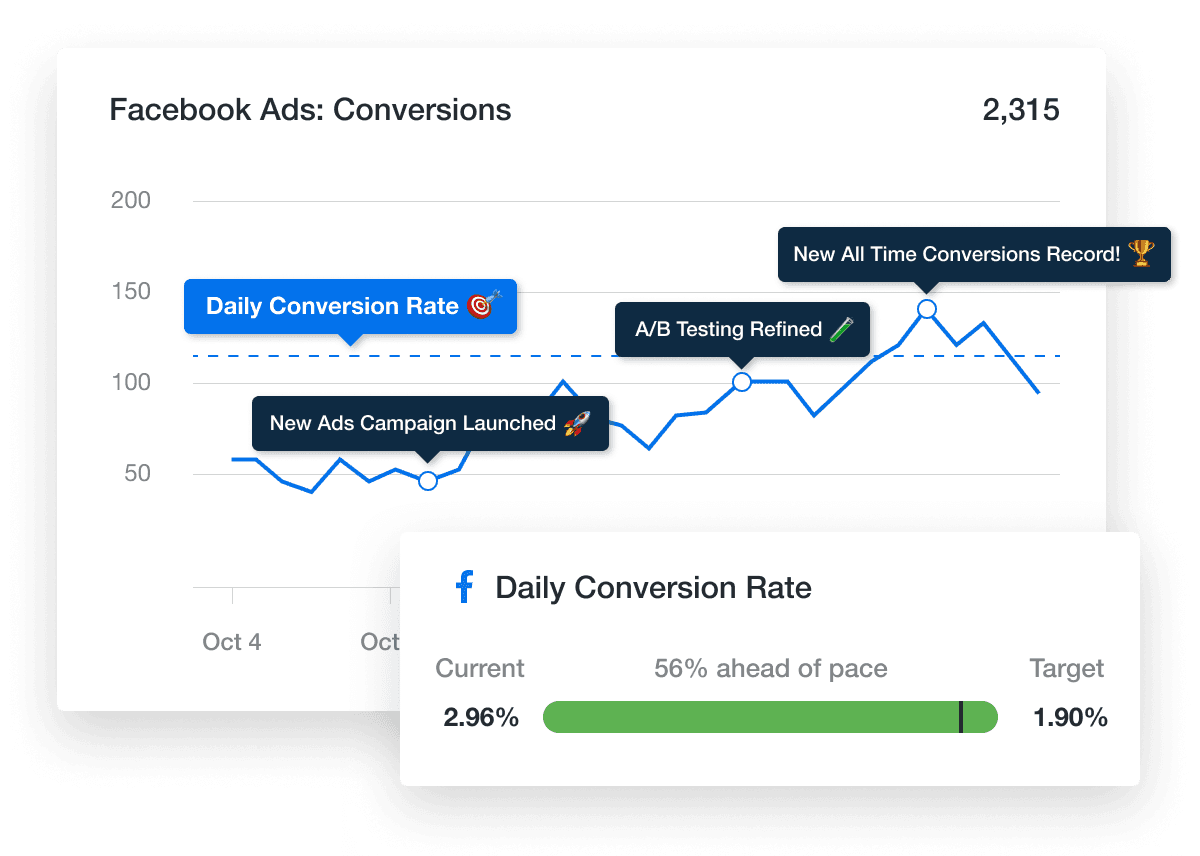
5. Customize and add annotations
Make the report feel tailored by focusing on the KPIs that matter most to the client. Add short annotations to call out any spikes, dips, or interesting trends in the data.
These quick notes help clients understand what caused the change and what you plan to do next, making the report easier to follow and more meaningful.
6. Schedule and send
Automate delivery so clients receive updates on their preferred reporting frequency (e.g., weekly or monthly). This maintains consistent communication and ensures that clients always have access to current performance data without having to follow-up each time.
The ability to schedule automated report delivery has been a game-changer for our agency. We can now set up recurring reports to be sent directly to clients on a regular basis, freeing up our team's time and ensuring clients stay informed consistently.
Jessica Crist, Production Manager, High Five Media
KPI reporting best practices & common mistakes
Clear, purposeful KPI selection is what turns a report into something clients actually use. Here are some common mistakes to avoid when choosing and reporting on KPIs.
1. Tracking outdated KPIs
KPIs shouldn’t stay the same forever. If you’re measuring the same business metrics month after month without revisiting them, you may be overlooking shifts in customer behavior, industry trends, or the client’s priorities.
Check in with clients regularly to confirm their KPIs are still relevant, attainable, and aligned with where the business is headed.
2. Choosing KPIs that are too simple
A KPI isn’t valuable just because it’s easy to track. Ensure each metric is directly tied to a strategic goal. For example, tracking “new customers per day” only makes sense if it connects to a broader objective, not just because it’s a readily available number.
In other words, strategic KPIs are those that truly reflect progress and help clients make data-driven decisions.
3. Using KPIs without context
Even accurate numbers could be misleading without proper interpretation. KPIs often influence each other, and external factors often impact results.
For instance, rising PPC competition may affect customer acquisition costs even if your targeting and creative are strong. When a trendline shifts, dig into the “why” and help clients understand whether the cause is internal, external, or a mix of both.
Streamline and automate your KPI reporting
Analyzing data takes effort–we get it. That said, building reports shouldn’t eat up your entire week. Instead of manually pulling numbers or stitching together screenshots, automate the entire process and free up hours of valuable time.
With AgencyAnalytics, your data updates automatically, reports stay consistent, and clients get clear insights without the back-and-forth. That means less time spent on reporting and more time spent on business strategy, execution, and delivering real results.
AgencyAnalytics is one of the most essential tools we use as an agency. Not only do we use it daily with our internal team to check specific KPIs we are tracking through various dashboards, but it has also saved us countless hours with our monthly reporting.


Make KPI reporting easier for you and more meaningful for your clients. Start simplifying your workflow and track the right key performance indicators with AgencyAnalytics–sign up for a free 14-day trial today!

Written by
Richelle Peace is a writer with a degree in Journalism who focuses on web content, blog posts, and social media. She enjoys learning about different topics and sharing that knowledge with others. When she isn’t writing, Richelle spends time teaching yoga, where she combines mindfulness, movement, and her passion for wellness.
Read more posts by Richelle PeaceSee how 7,000+ marketing agencies help clients win
Free 14-day trial. No credit card required.


