Customer Churn
Email Campaign Adjustments
Agencies refine email tactics when high churn indicates messaging issues.
Identifying Trouble Spots
Pinpoint areas where current customers disengage and highlight what needs adjustments.
Resource Allocation
Identify high churn segments to optimize resource allocation effectively.
Client Reports and ROI
Reduced churn in reports underscores increased lifetime value and ROI.
Why Customer Churn Is Important
Customer Churn is not just another number in a client’s marketing dashboard; it's a direct sign of how well their business is meeting customer needs. High churn rates often signal deeper issues. Whether it's gaps in existing customer service or less-than-great product quality, this metric offers an early warning, allowing businesses to course-correct before revenue takes a hit.
Not only is it more cost-effective to retain existing customers than to acquire new customers, but long-term customers often become brand advocates. In a saturated market, loyal customers are crucial. Keeping a close eye on Customer Churn helps maximize Customer Lifetime Value and overall profitability.
Stop Wasting Time on Manual Reports... Get Ecommerce Insights Faster With AgencyAnalytics
How Customer Churn Relates to Other KPIs
Customer Churn directly impacts metrics like Customer Lifetime Value (CLV) and Average Revenue Per User (ARPU). A high Customer Churn rate causes a sharp decrease in CLV, which is a vital metric for understanding long-term growth and profitability. Alternatively, an improvement in churn rates often results in a more favorable CLV, effectively increasing the worth of each customer to the business over time.
Metrics like Net Promoter Score (NPS) and Customer Satisfaction Score (CSAT) also offer insights into potential Customer Churn. A low NPS or CSAT typically forecasts an increase in churn, signaling that immediate action is needed to improve customer experience.
The Dynamics Between Customer Churn and Revenue Churn
Customer Churn and Revenue Churn are both important KPIs on their own with similarities, yet they serve different purposes.
Customer Churn: This metric reflects the percentage of lost customers without taking the Average Revenue Per User (ARPU) into consideration. It is pivotal for understanding customer retention at a granular level.
Revenue Churn: The revenue churn rate dives into the financial impact side of things. It measures revenue lost due to churned customers, which may not always align with the Customer Churn rate. For example, losing a few high-paying clients could result in a significant revenue churn, despite a low Customer Churn rate.
Both metrics are evaluated on a monthly churn rate or annual churn rate, providing flexibility in assessing short-term and long-term trends. The insights gained from these metrics guide strategies to win back lost customers or acquire new customers who contribute to a healthier revenue stream.

Churn Rate Variations Across Industries
Churn rate differ by industry, influenced by customer behavior and industry norms. In eCommerce, for instance, churn rates typically fluctuate between 20-24% due to factors like pricing competitiveness, product variety, and customer service quality. The travel industry experiences a different churn dynamic, often dictated by seasonal trends and customer loyalty programs. For subscription services, particularly SaaS products, monthly churn rates are typically much lower–in the 3% to 5% range–and are closely tied to user experience, product functionality, and ongoing customer support.

Churn’s Impact on Net Revenue Retention
Understanding churn rate in the context of net revenue retention offers a nuanced perspective on business health. While churn rate signifies customer loss, balancing it against growth through net revenue retention reveals the true impact on business growth.
Negative churn rate, or net negative churn, plays a crucial role here. This occurs when revenue increases from existing customers, through upsells or additional purchases, exceed the loss from churned customers.
This concept underscores the importance of focusing on existing customers, not just replacing those lost. It's a strategy that shifts the focus from mere customer count to the quality of engagement and revenue per customer.
The two items you need to focus on are understanding your target audience to better close on them, and building strong relationships with your current clients to reduce customer churn rate.
Calculating Customer Churn Rate
To calculate Customer Churn rate, divide the number of churned customers by total number of customers at the start of a period. Agencies typically calculate churn rate on a monthly basis, but calculating churn rate is typically adapted to different time frames depending on business needs.
Customer Churn Rate Formula Example
What Is a Good Customer Churn Rate?
A good average churn rate varies by industry, but for many subscription-based businesses, anything in the range of 3% to 5% is typically considered healthy. Low churn indicates that customer retention strategies are effective and that a business is likely to grow over time.
What Is a Bad Customer Churn Rate?
On the other hand, a churn rate above 10% should raise red flags for SaaS offerings but may not be a concern within the Travel industry until it exceeds 25%. Higher churn rates could indicate customer satisfaction concerns or product-market fit, demanding immediate attention to improve retention and prevent revenue loss.
How To Set Customer Churn Goals
To establish realistic churn rate benchmarks, a marketing agency should harness historical data as a guiding compass. This involves analyzing past churn patterns for their existing client and across similar clients or industries. By identifying common factors contributing to customer attrition, historical data aids in recognizing trends or anomalies in customer behavior.
If an agency is looking to dig deeper into Customer Churn, try segmenting Customer Churn by product lines, customer segments, or subscription types. By breaking down the overall churn rate, it's easier to identify which areas of the business are most vulnerable to customer loss. This allows for targeted action plans to improve performance in those specific segments.
Why Customer Churn Matters to Clients
For clients, Customer Churn is a reflection of brand reputation and product value. A high churn rate could indicate that customer needs are not being met, possibly triggering a chain reaction of negative reviews and dwindling referrals. This makes it a key metric for assessing not just immediate profit loss but also long-term brand equity.
Clients often leverage Customer Churn data to fine-tune their business strategy. If churn rates are high among a particular customer segment or during a specific season, it's a prompt to dig into root causes and make data-driven changes to product offerings, pricing models, or customer service protocols.

Why Customer Churn Matters to Agencies
From an agency standpoint, Customer Churn serves as a performance indicator for the effectiveness of marketing and strategies to retain customers. It provides quantifiable proof of what's working and what isn't, offering insights for strategic adjustments. Keeping churn low not only showcases the agency’s competence but also enhances campaign sustainability, as a stable customer base often results in more consistent revenue streams.
A decrease in Customer Churn could lead to increased client satisfaction and prolonged agency-client relationships. In a competitive market, an agency that demonstrates its ability to implement effective retention strategies to manage and reduce Customer Churn gives itself a huge selling point, potentially attracting more business and elevating its name in the game.

Automatically Pull Data From {{integration-count}}+ Marketing Platforms To Create Client Reports in Minutes.
Best Practices When Analyzing and Reporting Customer Churn
It's not just about knowing how many customers are leaving; it's about understanding why. Properly analyzed Customer Churn data helps allocate resources better, target the right audience, and shape campaigns that resonate.
Evaluate Churn Over Specific Time Frames
Break down Customer Churn over different periods: monthly, quarterly, and yearly. This reveals if a particular strategy is making people stick around or head for the hills.
Examine Churn Across Various Channels
Compare the percentage of Customer Churn across different platforms. Is the email list losing subscribers at a higher rate than social media followers? This approach helps pinpoint weak links in the marketing chain.
Track Churn Among Different Campaigns
Each marketing campaign performs differently, and it's crucial to identify which ones are negatively affecting customer retention. Measure Customer Churn by campaign to find out where to double down and where to pull back.
Analyze Churn Trends and Anomalies
Spotting a sudden spike in Customer Churn? Or maybe there’s a slow, creeping increase? Identifying these trends and anomalies informs decisions before a small issue turns into a larger problem.
Consider Churn Within the Metric Ecosystem
Monitor Customer Churn next to other metrics like Customer Lifetime Value or Customer Acquisition Cost. This offers a more comprehensive view of business health.
Align Churn Metrics With Client Objectives
To make Customer Churn truly useful, link it to client goals such as increased retention or reduced customer acquisition costs. This turns a number into a strategic tool.
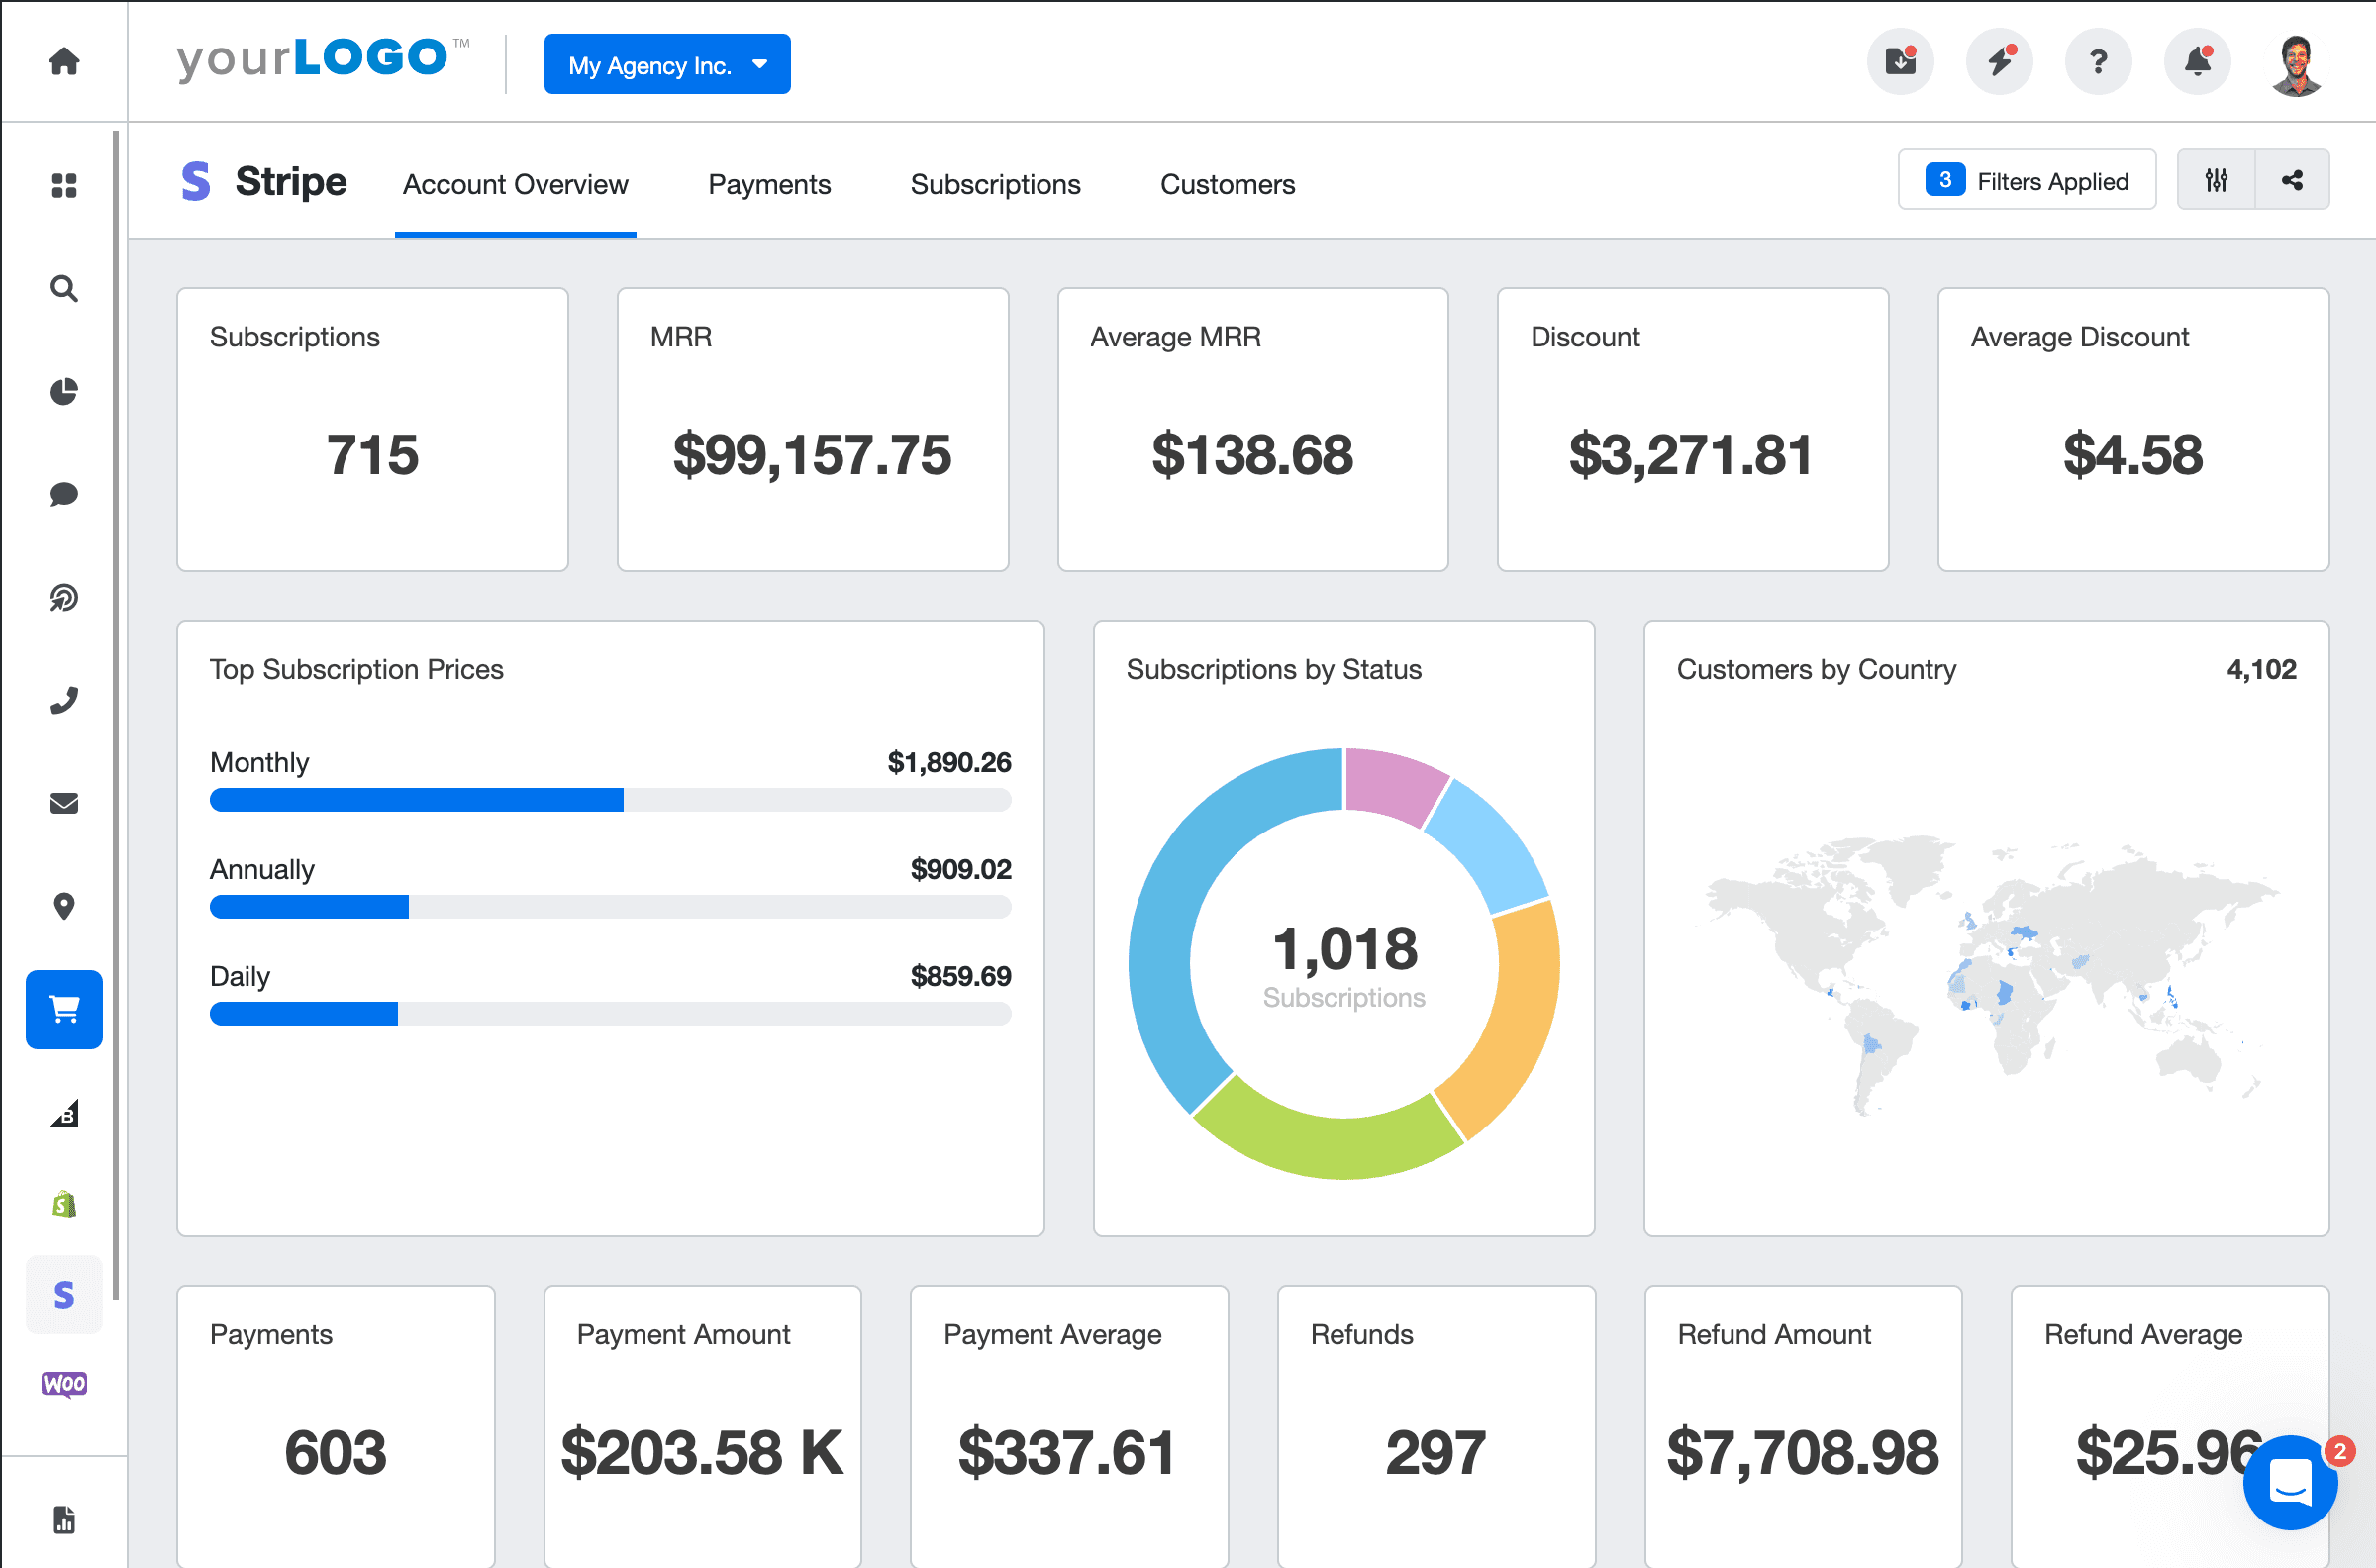
Stripe Dashboard Example
Related Integrations
How To Improve Customer Churn
Reducing Customer Churn is a priority for all businesses. The good news is that even small changes make a big difference. Below are three actionable tips for improving this essential metric.
Monitor Feedback
Use feedback surveys, direct interviews, reviews, phone calls, or social media comments to track customer feedback and pinpoint areas for improvement.
Offer Incentives
Suggest a client roll out a customer loyalty program or limited-time promotion to give existing customers a reason to stay while potentially boosting total revenue.
Analyze Exit Data
Gather data when customers leave to identify common threads and adapt retention strategies accordingly.
Related Blog Posts
See how 7,000+ marketing agencies help clients win
Free 14-day trial. No credit card required.


