Table of Contents
Table of Contents
- What Are Social Media KPIs?
- The Role of a Social Media Manager in KPI Tracking
- How to Choose the Right Social Media KPIs for Your Strategy
- 15 Social Media KPIs to Track
- Classifying the Top Social Media KPIs by Type
- Tools to Track Social Media KPIs
- Easily Track Social Media KPIs With AgencyAnalytics
- Summary and Key Takeaways
7,000+ agencies have ditched manual reports. You can too.
Free 14-Day TrialQUICK SUMMARY:
Social media KPIs provide essential insights for measuring and optimizing the effectiveness of marketing strategies. They highlight areas of success and improvement, guiding agencies in enhancing client outcomes. This guide offers a concise overview of tracking and leveraging these metrics for greater client success and serves as a key resource for refining social media marketing efforts.
Imagine being a master chef in the digital marketing kitchen, skillfully blending various ingredients to create an impressive feast for your clients. Those ingredients? They're a business's social media strategy and your agency's social media campaigns. The feast? It's client success.
Just like a chef relies on kitchen thermometers, timers, and taste tests to ensure the perfect dish, a social media manager relies on specific measurements to track their client's success. Key Performance Indicators (KPIs) are the bread and butter of any successful campaign.
In social media management, KPIs are not just metrics. They are valuable insights that a social media marketer uses to drive the social media strategy and inform decision-making.
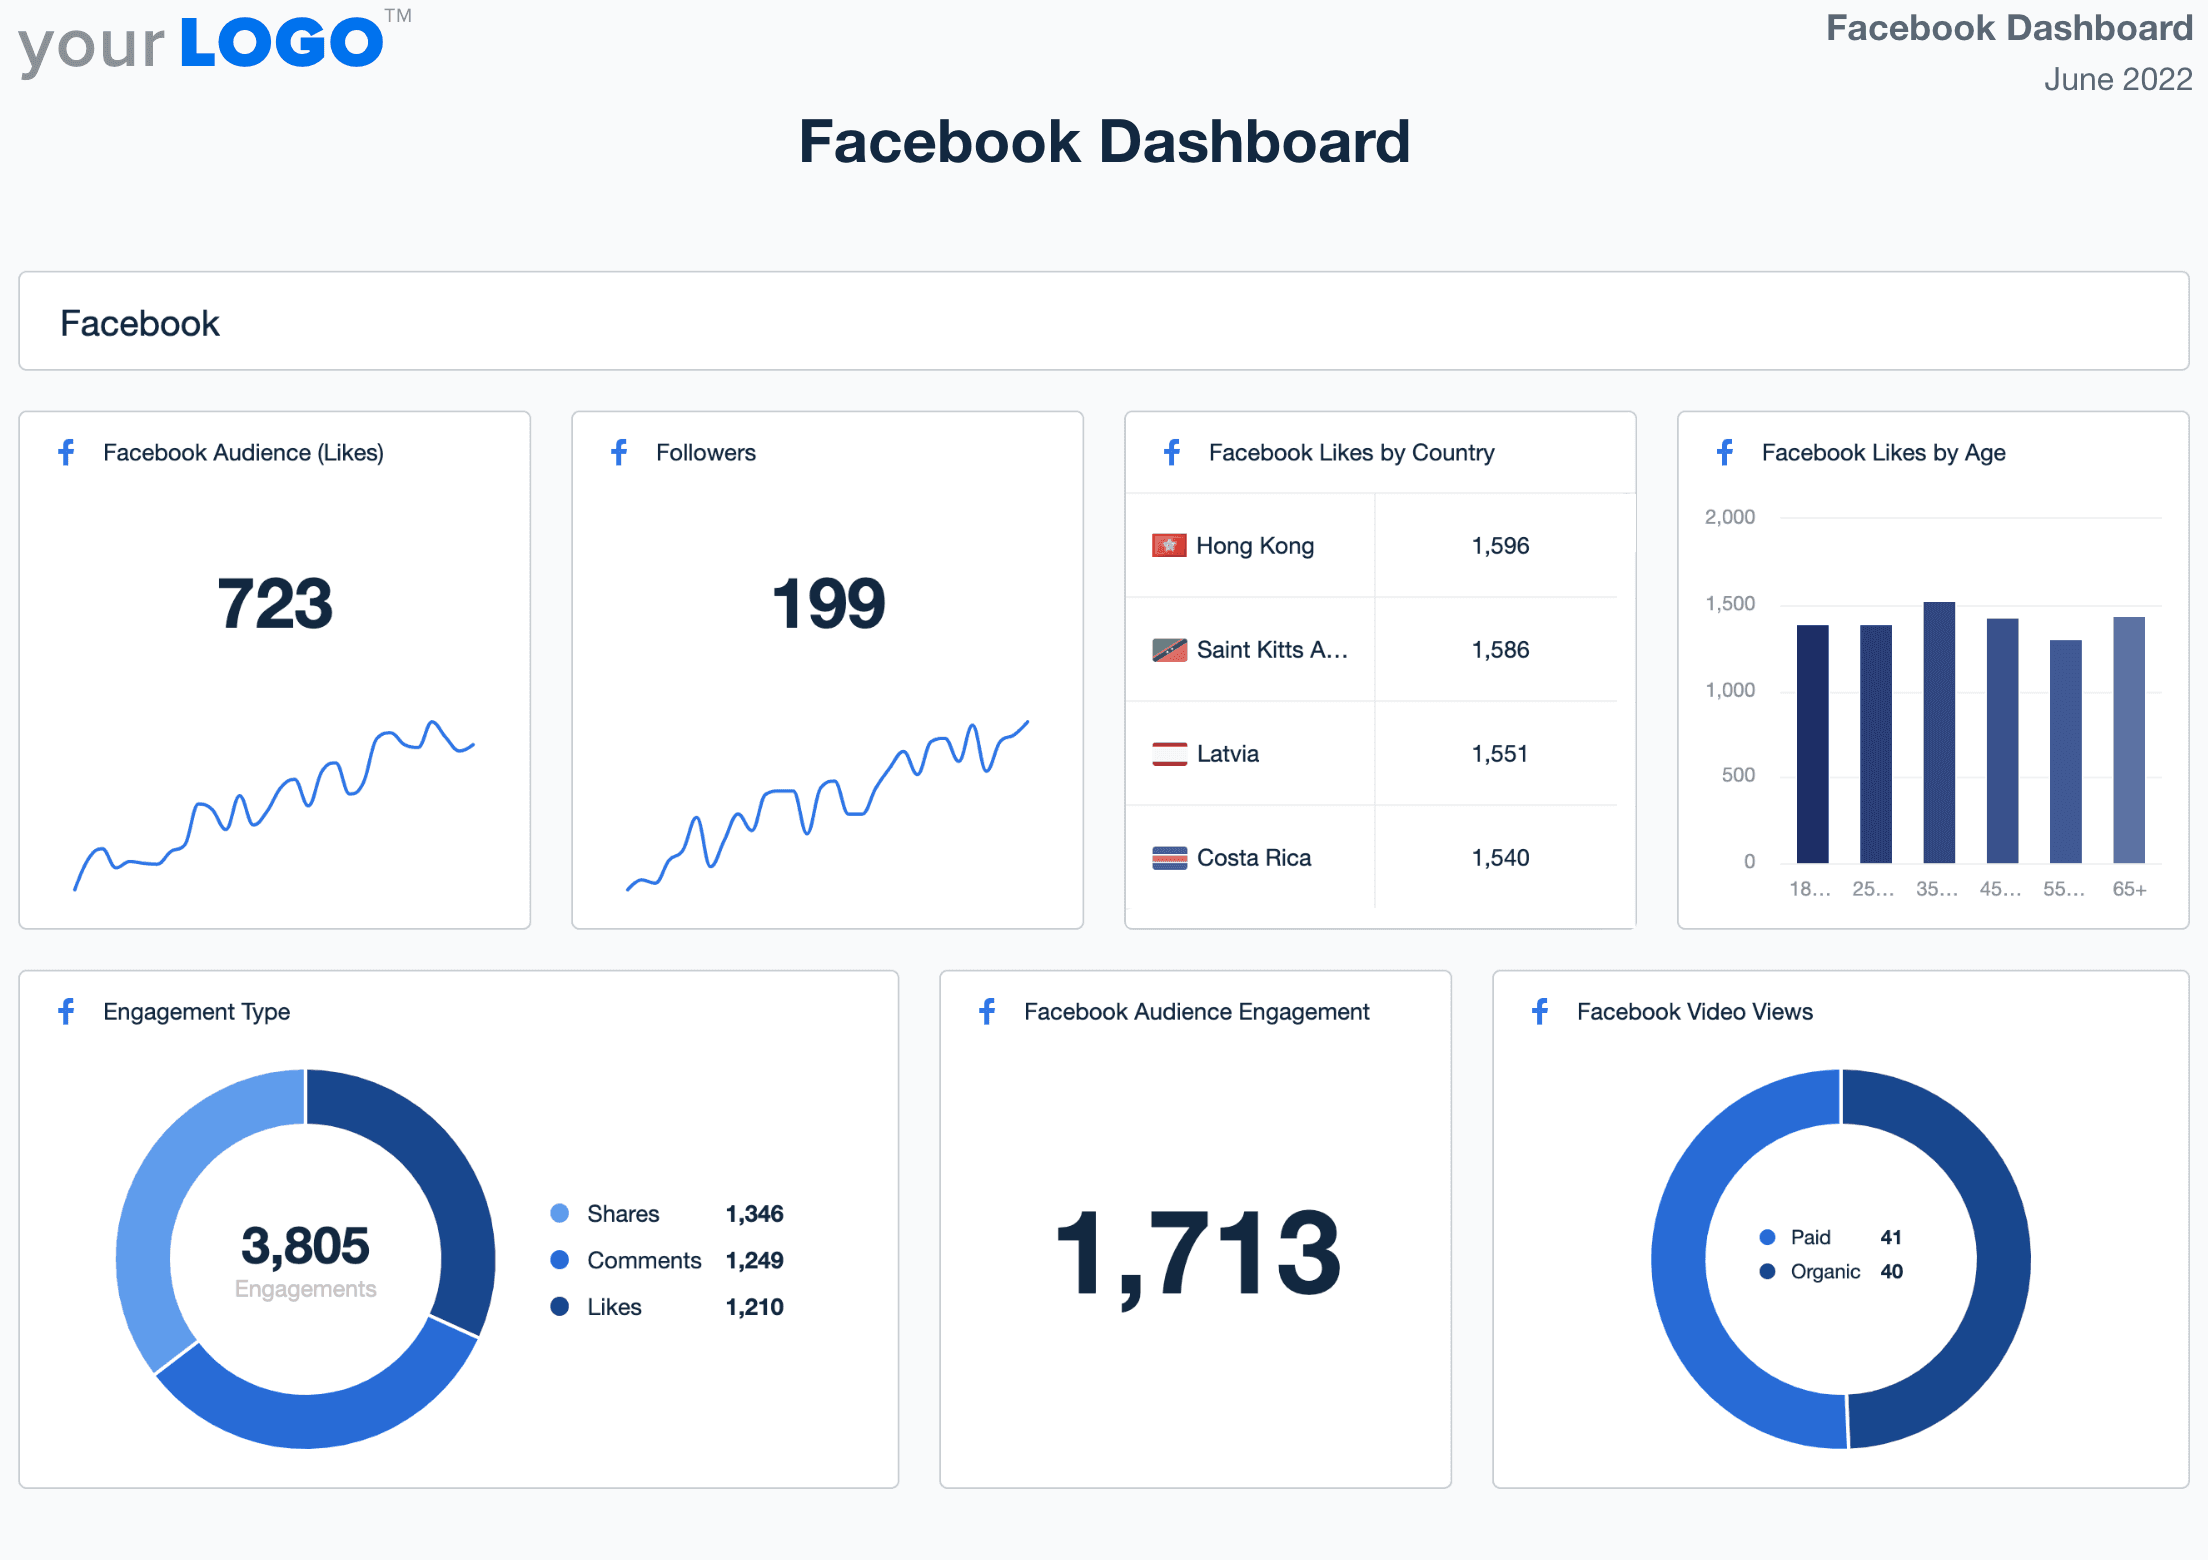
Throughout this guide, we'll unpack various key performance indicators, helping you make sense of these critical measurements for each social media account.
We’ll also provide some examples of social media KPIs, examining how to set social media KPIs while understanding how each contributes to the bigger picture of your client's social media marketing and digital marketing success.
By mastering these important social media KPIs, you'll elevate your role from social media manager to strategist and trusted partner in your client's success. You will clearly understand what's working and what isn't, as well as how to optimize social media channels for better results.
What Are Social Media KPIs?
Social media KPIs are the numbers that show what’s moving the needle. They connect the content your agency creates, promotes, and manages to the real results your clients are after, whether that’s more qualified leads, increased reach, or a better return on ad spend (ROAS).
They make progress easy to track and even easier to explain. Instead of just reporting activity, you’re showing impact. You’re not saying, “We posted five times last week.” You’re saying, “Our engagement rate improved by 12% and generated 30 new leads.”
That shift matters. KPIs are how you turn reporting into a conversation about results. They give your team a consistent way to measure performance, set smarter goals, and back up your strategy with data your clients trust.
Looking at social media KPIs through the lens of actionability gives them a whole new meaning. When tracking social media KPIs like post engagement rate, you might notice that social media posts with specific image sizes consistently perform better. Having that insight right at your fingertips then allows your team to optimize your social media image sizes for better engagement.
The Role of a Social Media Manager in KPI Tracking
Social media managers act as the custodians of these metrics. Their role is to identify, track, and analyze KPIs. But it's more than just number crunching. They decode complex data, translating it into actionable insights that shape campaign strategy. The ability to read these digital signposts effectively transforms managers from campaign overseers into strategic consultants.
For our clients, the KPIs are pretty simple: It's leads, revenue generated, and Cost Per Acquisition. Our clients are typically local, service-based businesses and thus don't care too much about brand awareness or percentages. The marketing dollars need to translate to top-line revenue, and so it's our job to help our clients connect the dots to that in our reporting.
Lane Rizzardini, Co-Owner, Marion Relationship Marketing
By combining all these insights and more, you perform a complete social media audit. This comprehensive evaluation of your client’s social media strategy based on actual data allows you to tweak, optimize, and pivot for increased success. So, social media KPIs aren't just numbers–they're the breadcrumbs leading you to a treasure trove of actionable insights!
Vanity Metrics vs. Actionable KPIs
Not all metrics are created equal, so there’s a (sometimes) clear distinction between vanity metrics and actionable social media KPIs.
Vanity metrics—like the raw number of followers or social media post impressions—might inflate the ego, but that’s about it. A million social media followers do look mighty impressive when taken in isolation, but they don't necessarily contribute to your client's bottom line. The value of that 1 million follower count is negligible if they're not engaging with your client’s content or contributing to conversions.
On the other hand, actionable KPIs—like engagement rate, click-through rate, or conversion rate—provide valuable insights into how audiences interact with a brand. They help agencies discern whether campaigns reach the right people, resonate with audiences, and compel users to take desired actions.
And follower count doesn't always have to be a vanity metric, if you look at the growth rate and not the pure numbers. If a client's follower count is growing at a reasonable rate, that is a valuable social media KPI to measure.
It's like the difference between a beautifully decorated birthday cake that tastes bland and a less ornate cake with an irresistible flavor. Which would you choose? In social media marketing, the substance—not just the style—truly matters. Or better yet, a beautifully decorated cake that tastes amazing. That should always be the goal!
How to Choose the Right Social Media KPIs for Your Strategy
Picking the right KPIs for social media reporting is like choosing the right tool for a job. You wouldn't use a wrench to hammer in a nail, right? I mean, you might—in a pinch—but you really shouldn’t.
Similarly, the right KPIs depend on the task at hand. Let's examine how agencies should choose the right social media KPIs for their clients.
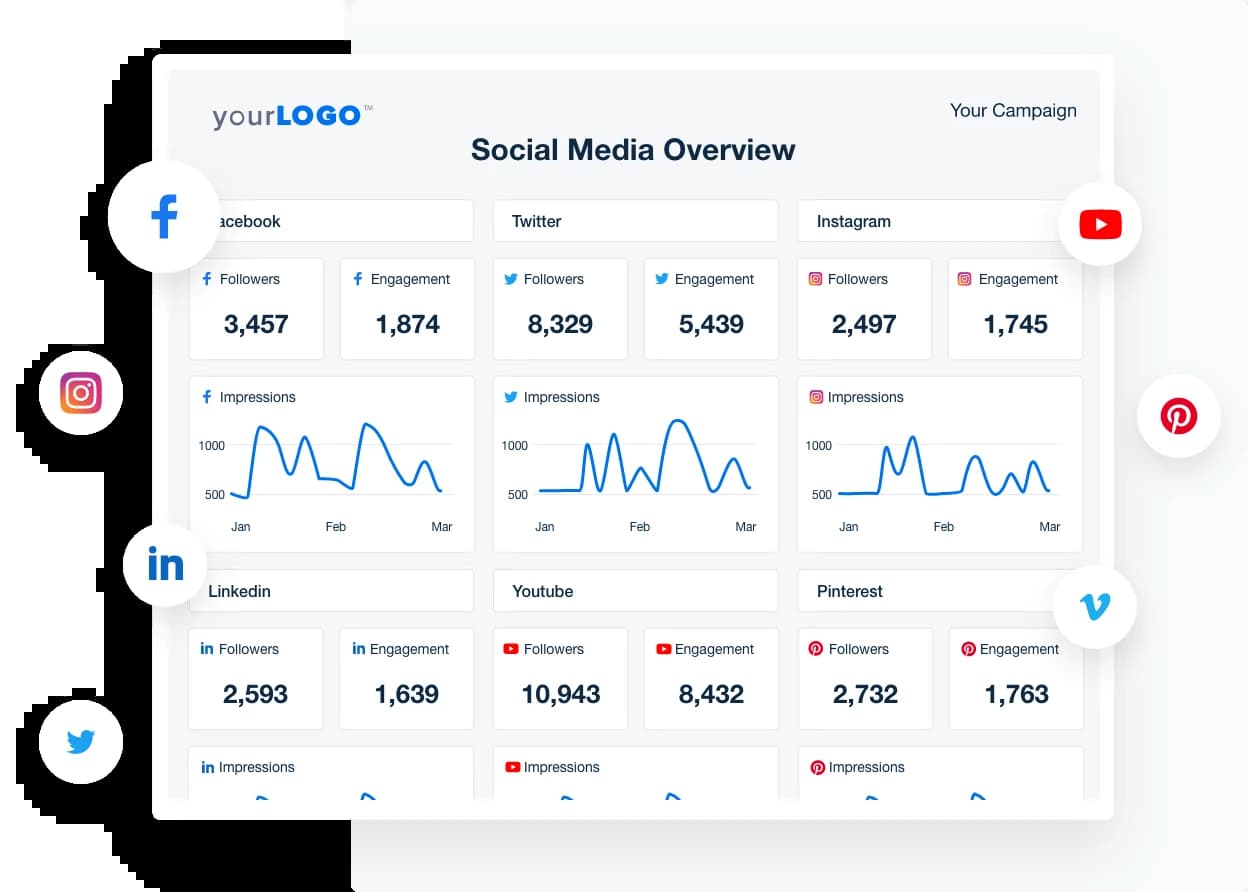
KPIs Based on Campaign Objectives
The first step is understanding what your client hopes to achieve. Are they seeking to increase brand awareness? If so, social reach KPIs like Reach and Post Impressions are your new best friends.
To build an engaged community, focus on social engagement KPIs such as Post Likes, Comments, and Shares. Every campaign objective has a set of related KPIs. Aligning social media KPIs with campaign objectives is like having a GPS for your strategy—it gives you direction.
KPIs Based on Client Reporting Needs
While every campaign needs to have its goals, let's not forget who's steering the ship: the client. Understand what success looks like to them and what KPI reporting needs they have.
Our clients care about their budget and how many phone call leads they can get from it. All other metrics are tossed aside.
Rebecca Pena, Marketing Director, Investigator Marketing
If your client is all about that bottom line, prioritize ROI-focused KPIs. Follower growth KPIs might be more relevant if a start-up seeks to expand its audience. In other words, align your KPIs with your client's vision of success.
KPIs Based on Current Performance
Sometimes, your client’s past performance can illuminate your path. Look at the existing data to understand what's working and what isn't, and set the KPIs based on beating those current state metrics.
For example, if a client's social media engagement is already stellar, focusing on amplifying reach might be the next logical step. On the flip side, if a client's reach is impressive, but their engagement is low, it's time to change the tune and prioritize engagement KPIs.
KPIs Based on Industry Benchmarks
Last but not least, don't ignore what your competition is doing. Industry benchmarks and social media listening tools give you an idea of what's achievable and can include reach, engagement, share of voice, or conversion metrics, as well as which platforms they are targeting to drive customer acquisition.
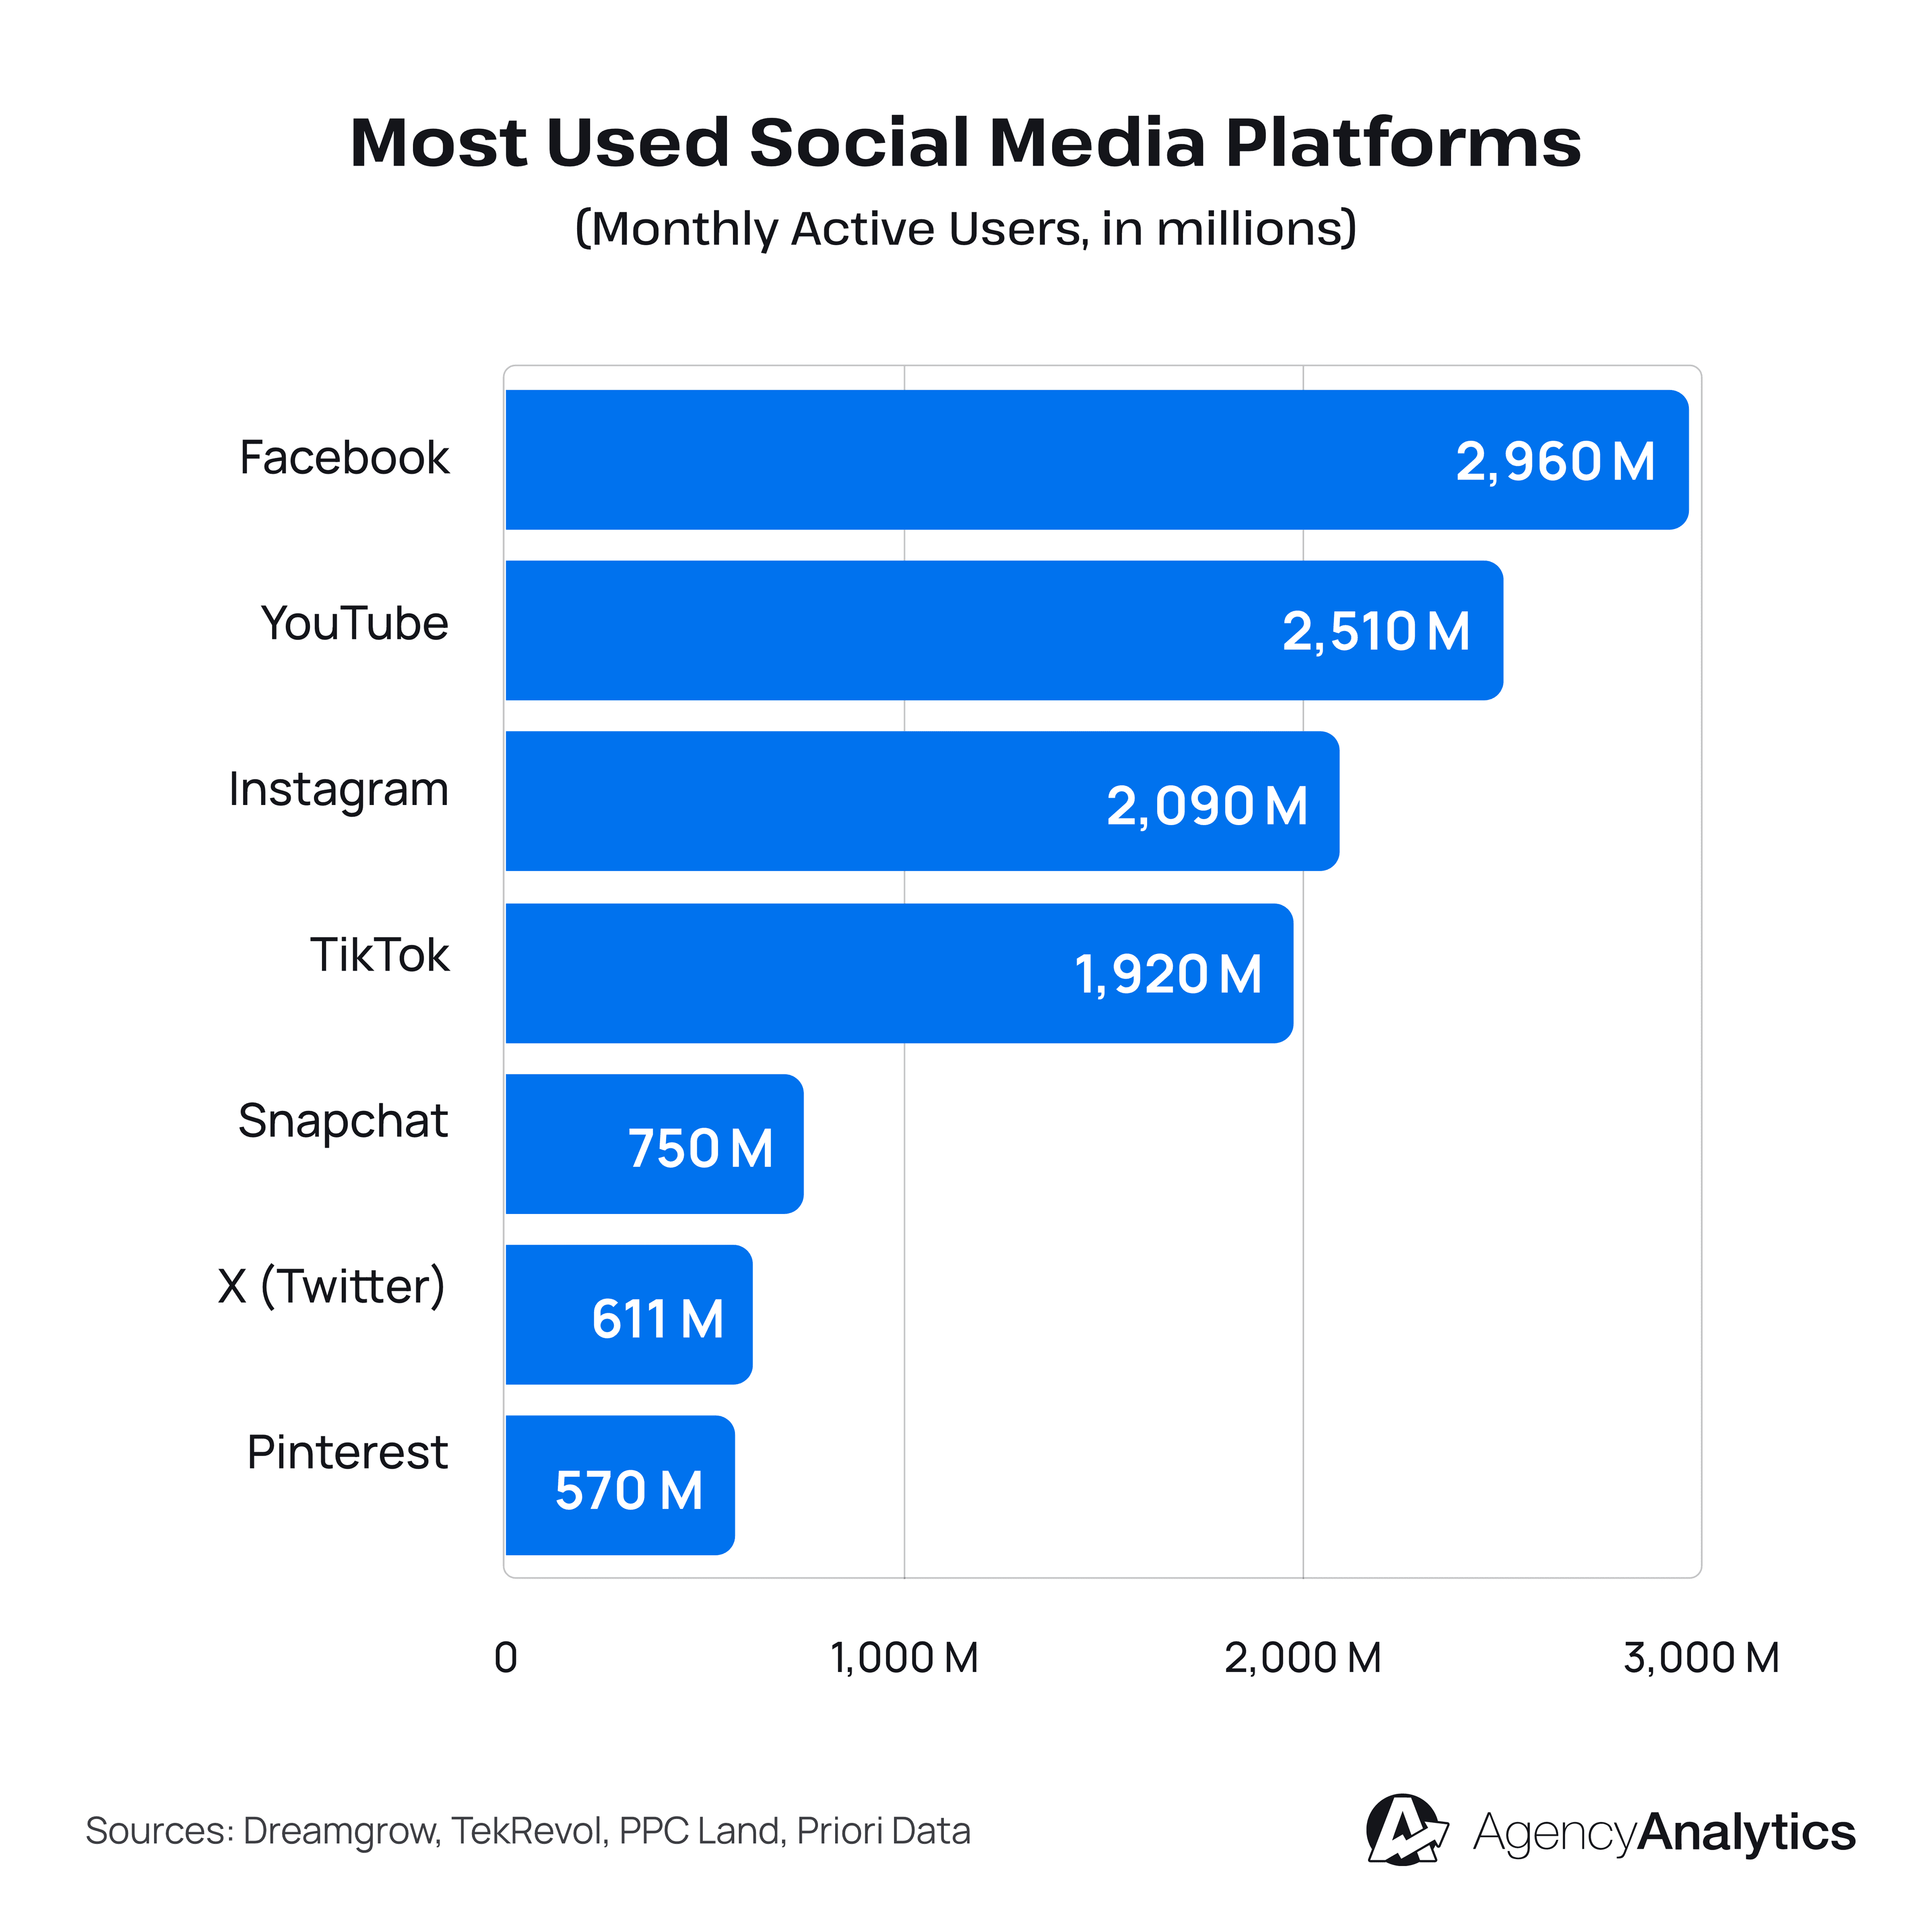
Industry benchmarks and your agency's findings using social listening tools help guide the selection of social media KPIs and help set realistic expectations. After all, it's good to shoot for the stars, but let's not forget to keep one foot on the ground.
KPIs Based on Resource Availability
An additional consideration when selecting KPIs is the campaign's resources. Some metrics, like social media ROI, require advanced tracking setups and significant data analysis capabilities.
Understand the available resources—both human and technological—to ensure that selected social media KPIs can be tracked and analyzed efficiently and effectively.
Remember, selecting the right KPIs is a strategic choice that can make or break a campaign's success. It's like choosing the right spices for a dish—you need to consider the main ingredient (the campaign objective), the taste preferences (client reporting needs), what you've cooked successfully before (current performance), what the other chefs are doing (industry benchmarks), and of course, what spices you have in your kitchen (resource availability).
15 Social Media KPIs to Track
In social media, data is abundant. In fact, the lack of data is rarely a problem, but identifying and narrowing down to the critical social media marketing metrics and KPIs that matter can be. With this deep dive into the essential social media KPIs that marketing agencies need to monitor, you’re better equipped to optimize campaigns and showcase success to clients.
The following are the top 15 social media KPIs that matter the most.
1. Follower Growth Rate
Follower Growth Rate measures how many users have been gained over a specific time frame. As mentioned earlier, the growth in follower count is a direct reflection of the effectiveness of the content and reach. Tracking this metric helps agencies spot trends and understand what kind of content drives follower growth.

For example, if a particular influencer marketing campaign leads to a significant spike in new followers, replicate elements from it in future initiatives.
2. Engagement Rate
Engagement Rate shows the level of interaction (likes, shares, comments) specific pieces of content receive. It measures how well the target audience connects with published content. High engagement rates suggest that the content strategy is well-aligned with audience preferences.
This KPI gives context to the follower count, showing how many people are seeing your client’s posts and interacting with them. It’s especially useful for comparing performance across accounts with different audience sizes.
3. Reach
Reach measures the number of unique users who saw your client’s social media content. It also shows how far it spreads beyond current followers.
Reach is a fundamental metric when it comes to measuring social media KPIs as it directly ties into business goals such as enhancing brand visibility. For example, high reach indicates broad exposure, which helps build brand awareness. While reach varies across different social media platforms, it remains one of the key performance indicators for gauging the potential size of an audience and the extent of your client's online visibility.
4. Impressions
Impressions represent the total number of times a post is displayed, whether clicked or not. It's a measure of potential visibility and offers insights into the content's visibility potential.
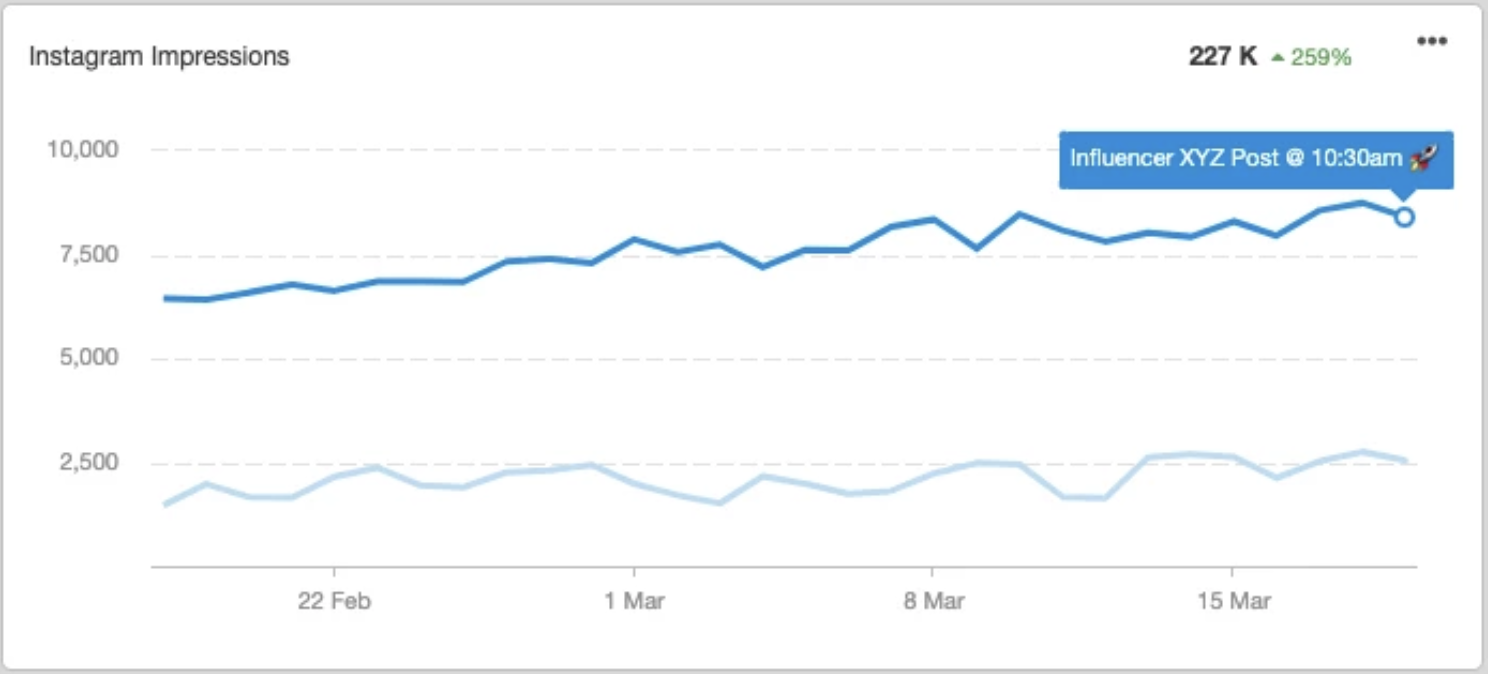
For instance, social media posts with higher impressions could be repurposed for high-performing channels to maximize visibility.
5. Click-Through Rate (CTR)
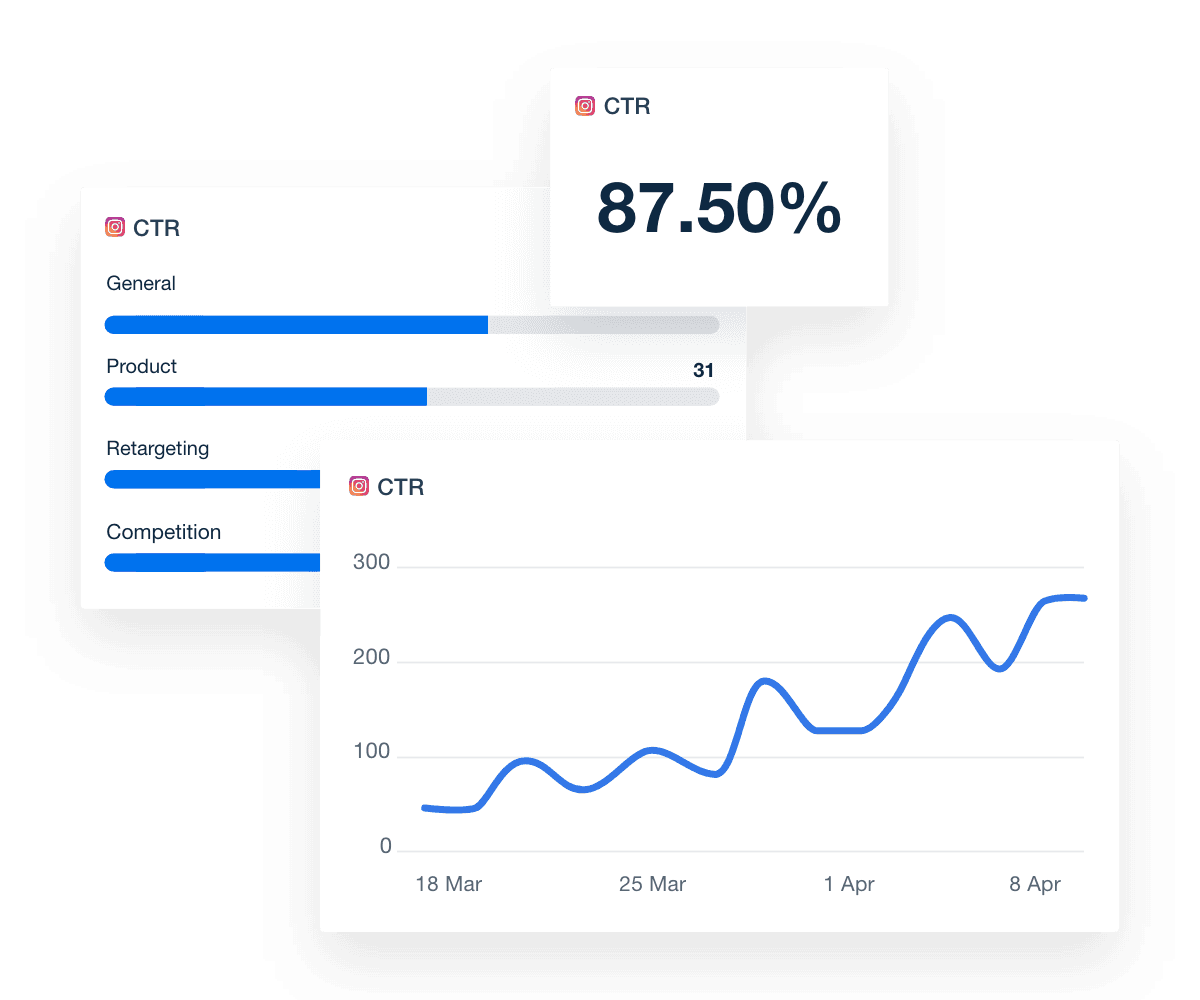
Click-through rate (CTR) measures how often people click on a link in a post after seeing it. It’s a strong indicator of how compelling the content or call to action is.
A high CTR means your message is connecting—it’s prompting people to take the next step. Whether it's a blog post, product page, or sign-up form, CTR helps you understand what drives action and where you might need to tweak headlines, visuals, or offers to boost performance.
6. Conversion Rate
Conversion Rate tracks how many users complete a desired action after clicking from a social media post. This could be anything from signing up for a newsletter to making a purchase.
It’s one of the clearest ways to connect social media efforts to real business outcomes. A strong conversion rate means your content isn't just catching attention—it’s inspiring action. Use this KPI to pinpoint what’s driving results and where you can refine your targeting or messaging to boost performance even more.
7. Social Share of Voice (SSoV)
Social Share of Voice (SSoV) measures how much your client's brand is being mentioned across social platforms compared to competitors. It captures the size of your client’s share in the broader industry conversation.
This KPI is especially valuable for brand awareness campaigns. It helps identify where your client is gaining traction, what topics resonate, and how your visibility compares against others in the space. Tracking SSoV over time gives you a clear sense of growth in market presence and brand influence.
8. Cost-Per-Click (CPC)
Cost-Per-Click (CPC) tells you how much you pay for each click on a paid social ad. It’s a key metric for understanding the efficiency of your client’s paid campaigns.
Lower CPC typically means that social media ads are well-targeted and relevant to the audience. Use this KPI to compare campaign performance across platforms, refine ad creative, and adjust audience targeting to get the most from the budget.
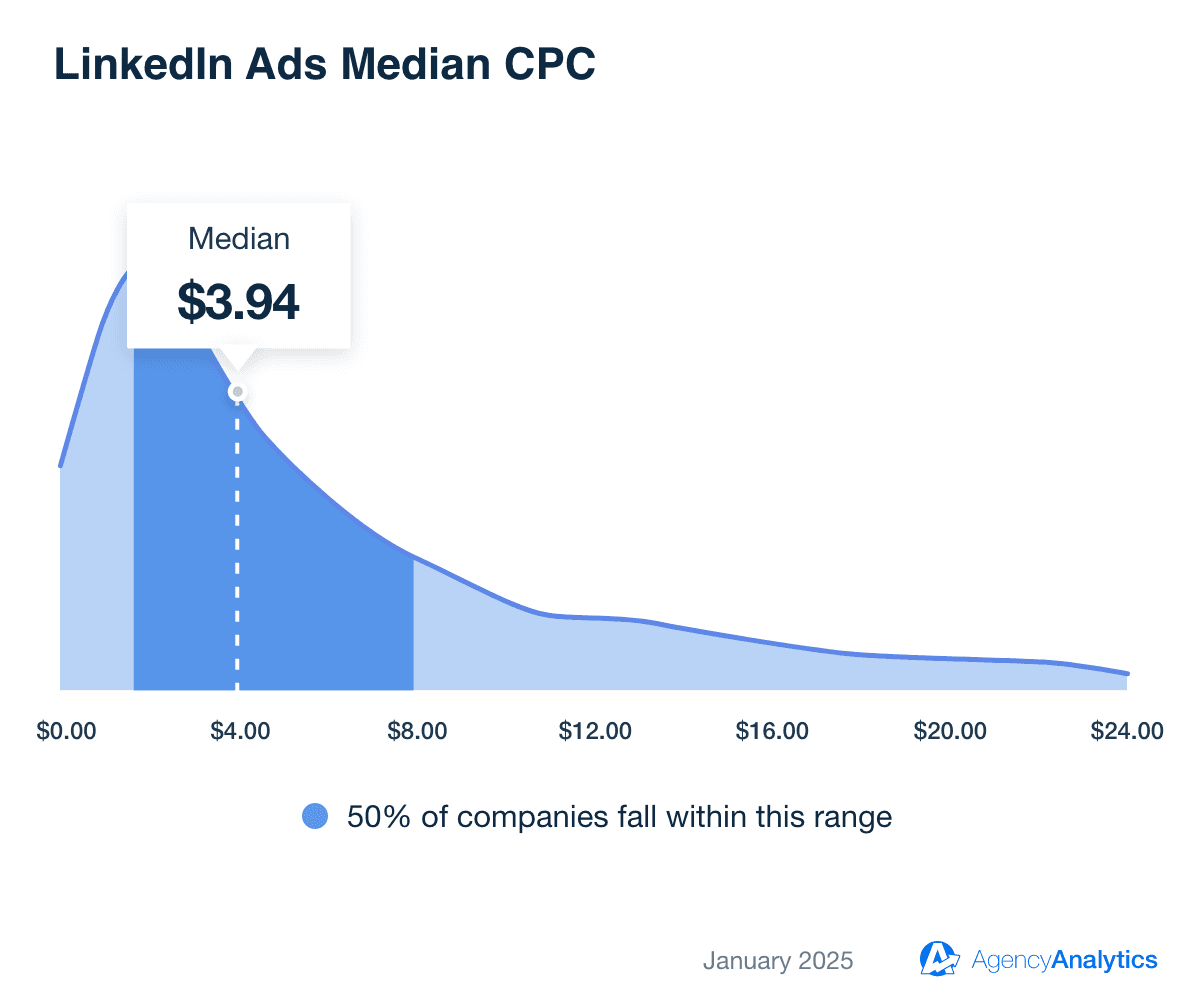
AgencyAnalytics' Benchmarks feature makes it easy to see how your clients perform against industry averages, such as the median CPC for LinkedIn Ads.
9. Cost-Per-Thousand Impressions (CPM)
Cost-Per-Thousand Impressions (CPM) measures how much you're spending to reach 1,000 people with a paid social ad. It’s one of the most useful metrics for budgeting and scaling brand awareness campaigns.
A competitive CPM means you're getting broad visibility without overspending. It also helps compare the cost-efficiency of different platforms and audiences. When paired with metrics like engagement and conversion rate, CPM gives a clearer picture of total campaign value.
10. Bounce Rate from Social Media Campaigns
Bounce Rate measures the percentage of users who click through from a social media post and leave the landing page without taking any further action. It’s a valuable KPI for understanding how well the post-click experience matches user expectations.
A high bounce rate might suggest a disconnect between the content and landing page, while a lower rate means visitors are sticking around and engaging. Use this insight to refine landing page content, improve page load speed, or align messaging more closely with your social posts.
11. Leads Generated from Social Media
Leads generated from social media show how well your content is guiding potential customers into the funnel. Whether it’s a form fill, a download, or a sign-up, this KPI connects social activity directly to business opportunity.
It’s one of the clearest ways to show clients how social media contributes to growth. Tracking lead volume and quality helps refine targeting, sharpen creativity, and highlight the channels that bring in the best prospects.
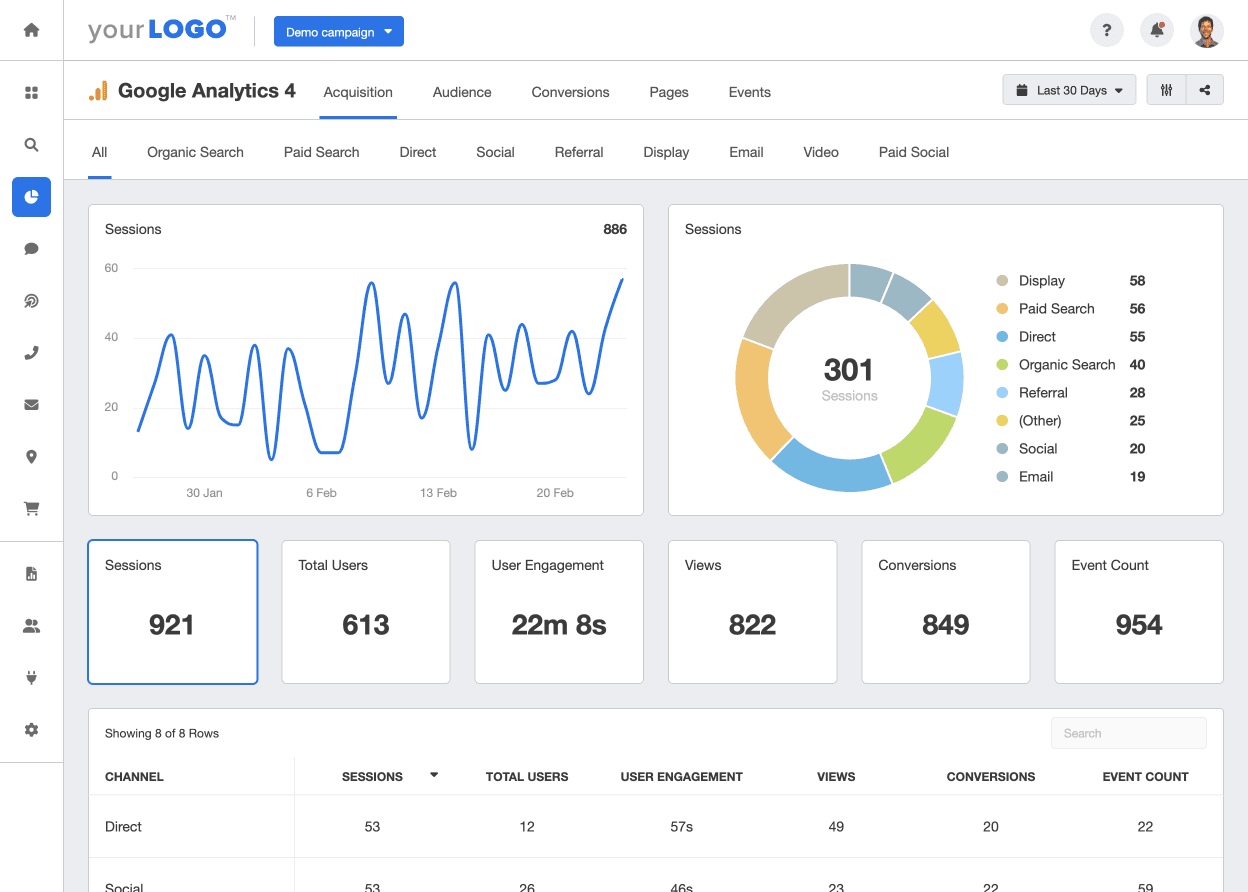
Want to see exactly how social traffic turns into leads? Easily incorporate Google Analytics 4 reporting into your agency’s processes with just a few clicks. Start your AgencyAnalytics 14-day free trial today.
12. Customer Satisfaction (CSAT) Score
Customer Satisfaction Scores (CSAT) measure how happy your client’s customers are, typically through simple post-interaction surveys. When used alongside social support efforts, they give valuable insight into how well your team is managing customer relationships on platforms like Facebook or Twitter.
Tracking CSAT over time helps agencies identify patterns in customer sentiment, improve response quality, and refine messaging tone. It's a KPI that ties social media directly to client experience and brand reputation.
13. Response Rate and Time
SResponse Rate and Time measure how quickly and consistently your agency or client responds to messages, comments, or mentions on social media. These KPIs reflect the quality of your customer service and can significantly impact brand perception.
Fast, consistent replies show clients you’re present, attentive, and ready to help—whether answering a question, solving a problem, or simply acknowledging feedback. Improving this metric builds trust and strengthens client relationships over time.
14. Influencer Performance Metrics
When running influencer campaigns, tracking performance metrics is essential to measure ROI. These may include engagement rate, reach, conversions, and follower growth tied directly to influencer content.
This KPI set helps agencies understand which influencers are truly making a difference for their clients. It also informs future partnerships by identifying who drives the most impact and which types of content resonate best with the audience.
15. ROI from Paid Social Campaigns
ROI is the return on investment for your agency’s social media efforts. It's calculated by dividing the revenue generated from social media by the total cost of social media marketing activities, including paid ads and social media management fees.
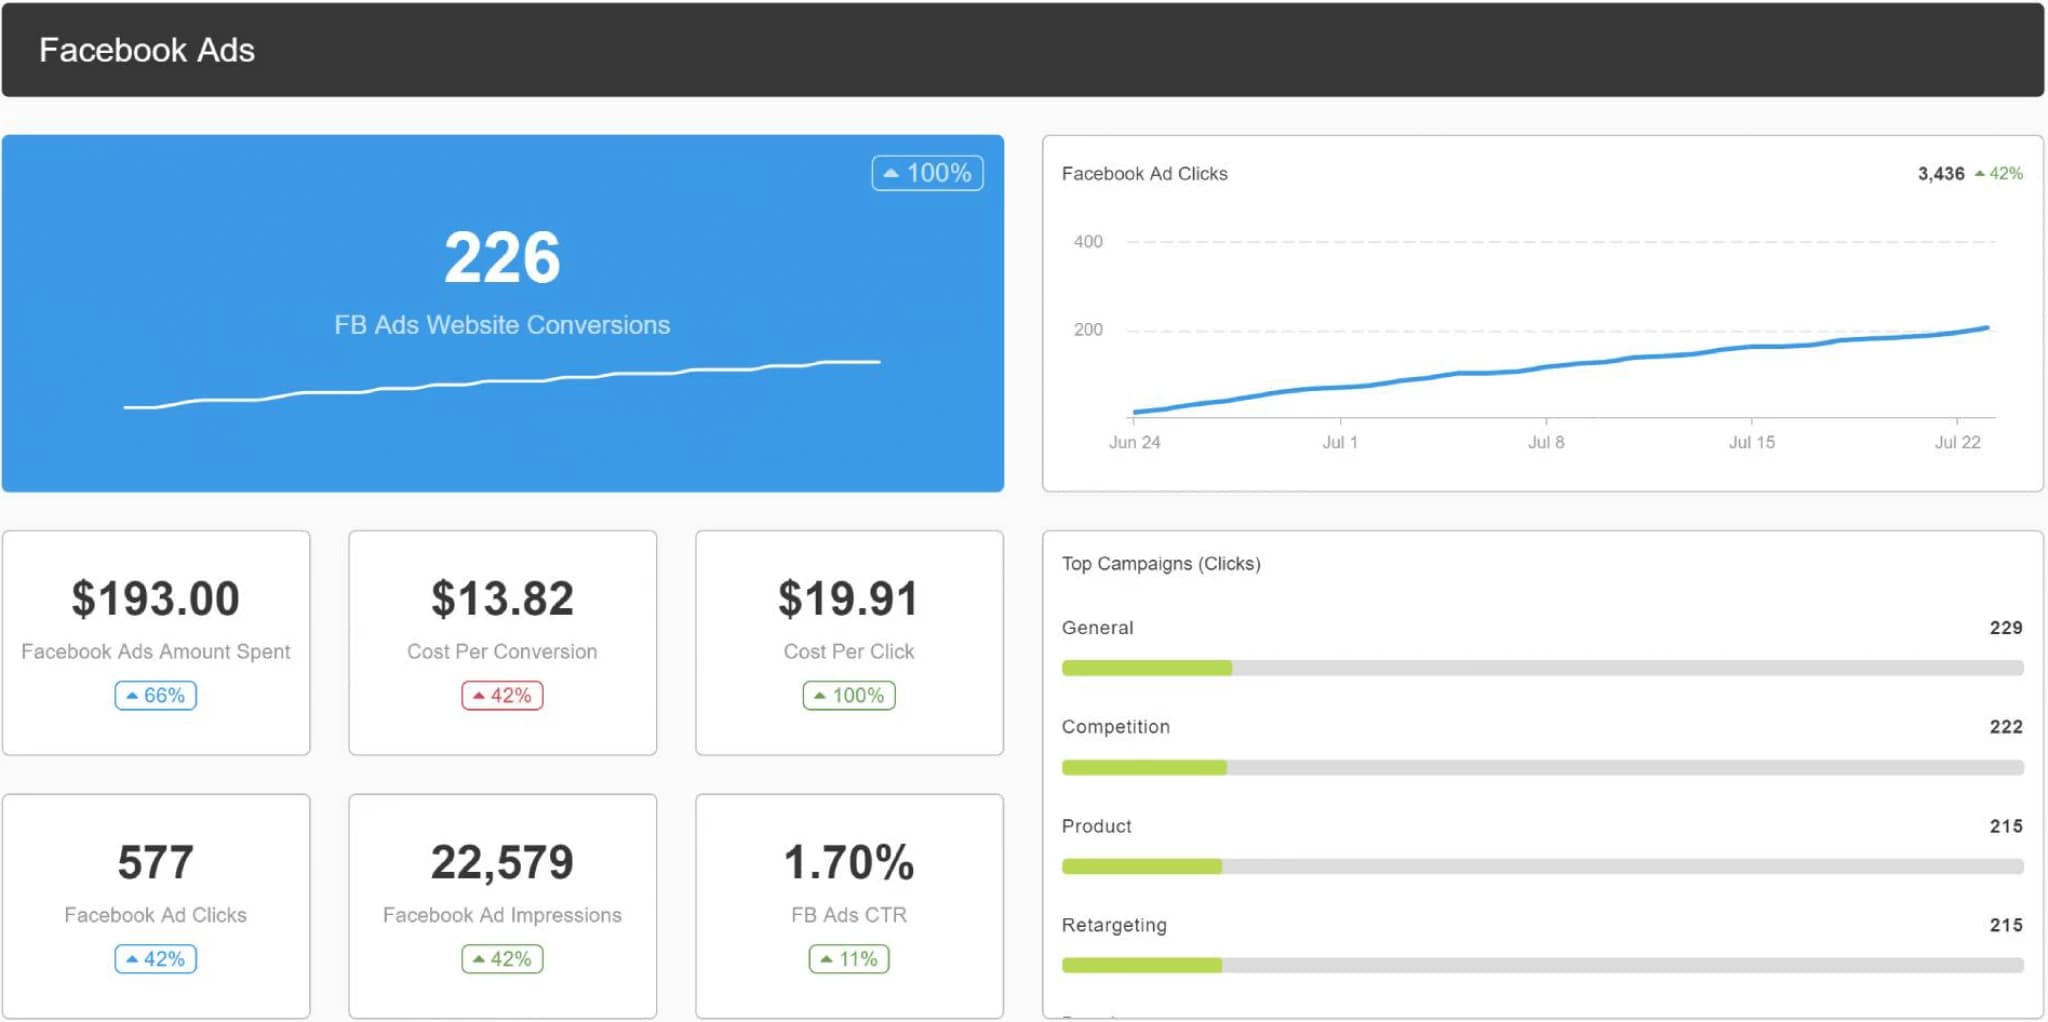
This critical metric underlines your social media strategy's financial viability and success.
Remember, these metrics don't exist in isolation but interact in a dynamic ecosystem. The power lies in understanding their interplay and using that knowledge to create, tweak, and optimize campaigns for client success.
KPI | Pros | Cons |
|---|---|---|
Follower Growth Rate | Indicates brand awareness and potential reach. | Doesn't reflect engagement or conversion. |
Engagement Rate | Reflects content resonance and audience interaction. | Can be skewed by viral content or anomalies. |
Reach | Shows potential visibility of content. | Doesn't guarantee actual content views or engagement. |
Impressions | Gives an idea of how many times content was displayed. | Doesn't provide insight into interactions or content engagement. |
Click-Through Rate (CTR) | Measures interest and effectiveness of calls to action. | Clicks don't always result in conversions. |
Conversion Rate | Directly links content to desired actions taken. | Requires accurate tracking setup. |
Social Share of Voice (SSoV) | Shows brand visibility relative to competitors. | Difficult to measure accurately without third-party tools. |
Cost-Per-Click (CPC) | Helps evaluate ad efficiency and audience targeting. | Low CPC doesn’t always lead to high-quality leads. |
Cost-Per-Thousand Impressions (CPM) | Useful for assessing brand awareness campaign costs. | Doesn’t measure engagement or conversion. |
Bounce Rate from Social Media Campaigns | Shows landing page and content relevance. | High bounce rates can be caused by non-campaign-related factors. |
Leads Generated from Social Media | Links social activity directly to lead generation. | Lead quality can vary significantly. |
Customer Satisfaction (CSAT) Score | Directly reflects customer happiness and support quality. | Subjective and influenced by user sentiment. |
Response Rate and Time | Highlights responsiveness and service quality on social. | Time zone differences and resource limits may skew results. |
Influencer Performance Metrics | Identifies high-impact influencer partnerships. | Results depend heavily on the influencer’s credibility and fit. |
ROI from Paid Social Campaigns | Shows the financial return of paid social efforts. | Can be difficult to attribute all revenue accurately. |
Classifying the Top Social Media KPIs by Type
Understanding how to track social media KPIs is half the battle; the other half is knowing how they interconnect and influence each other. Let's delve into the different categories of key performance indicators and see how they correspond to the various stages of a social media user's journey.
Social Reach KPIs
Social reach KPIs gauge how far your content extends beyond your immediate followers. It's like having a microphone in a crowded room: How many people can hear your voice over the noise?
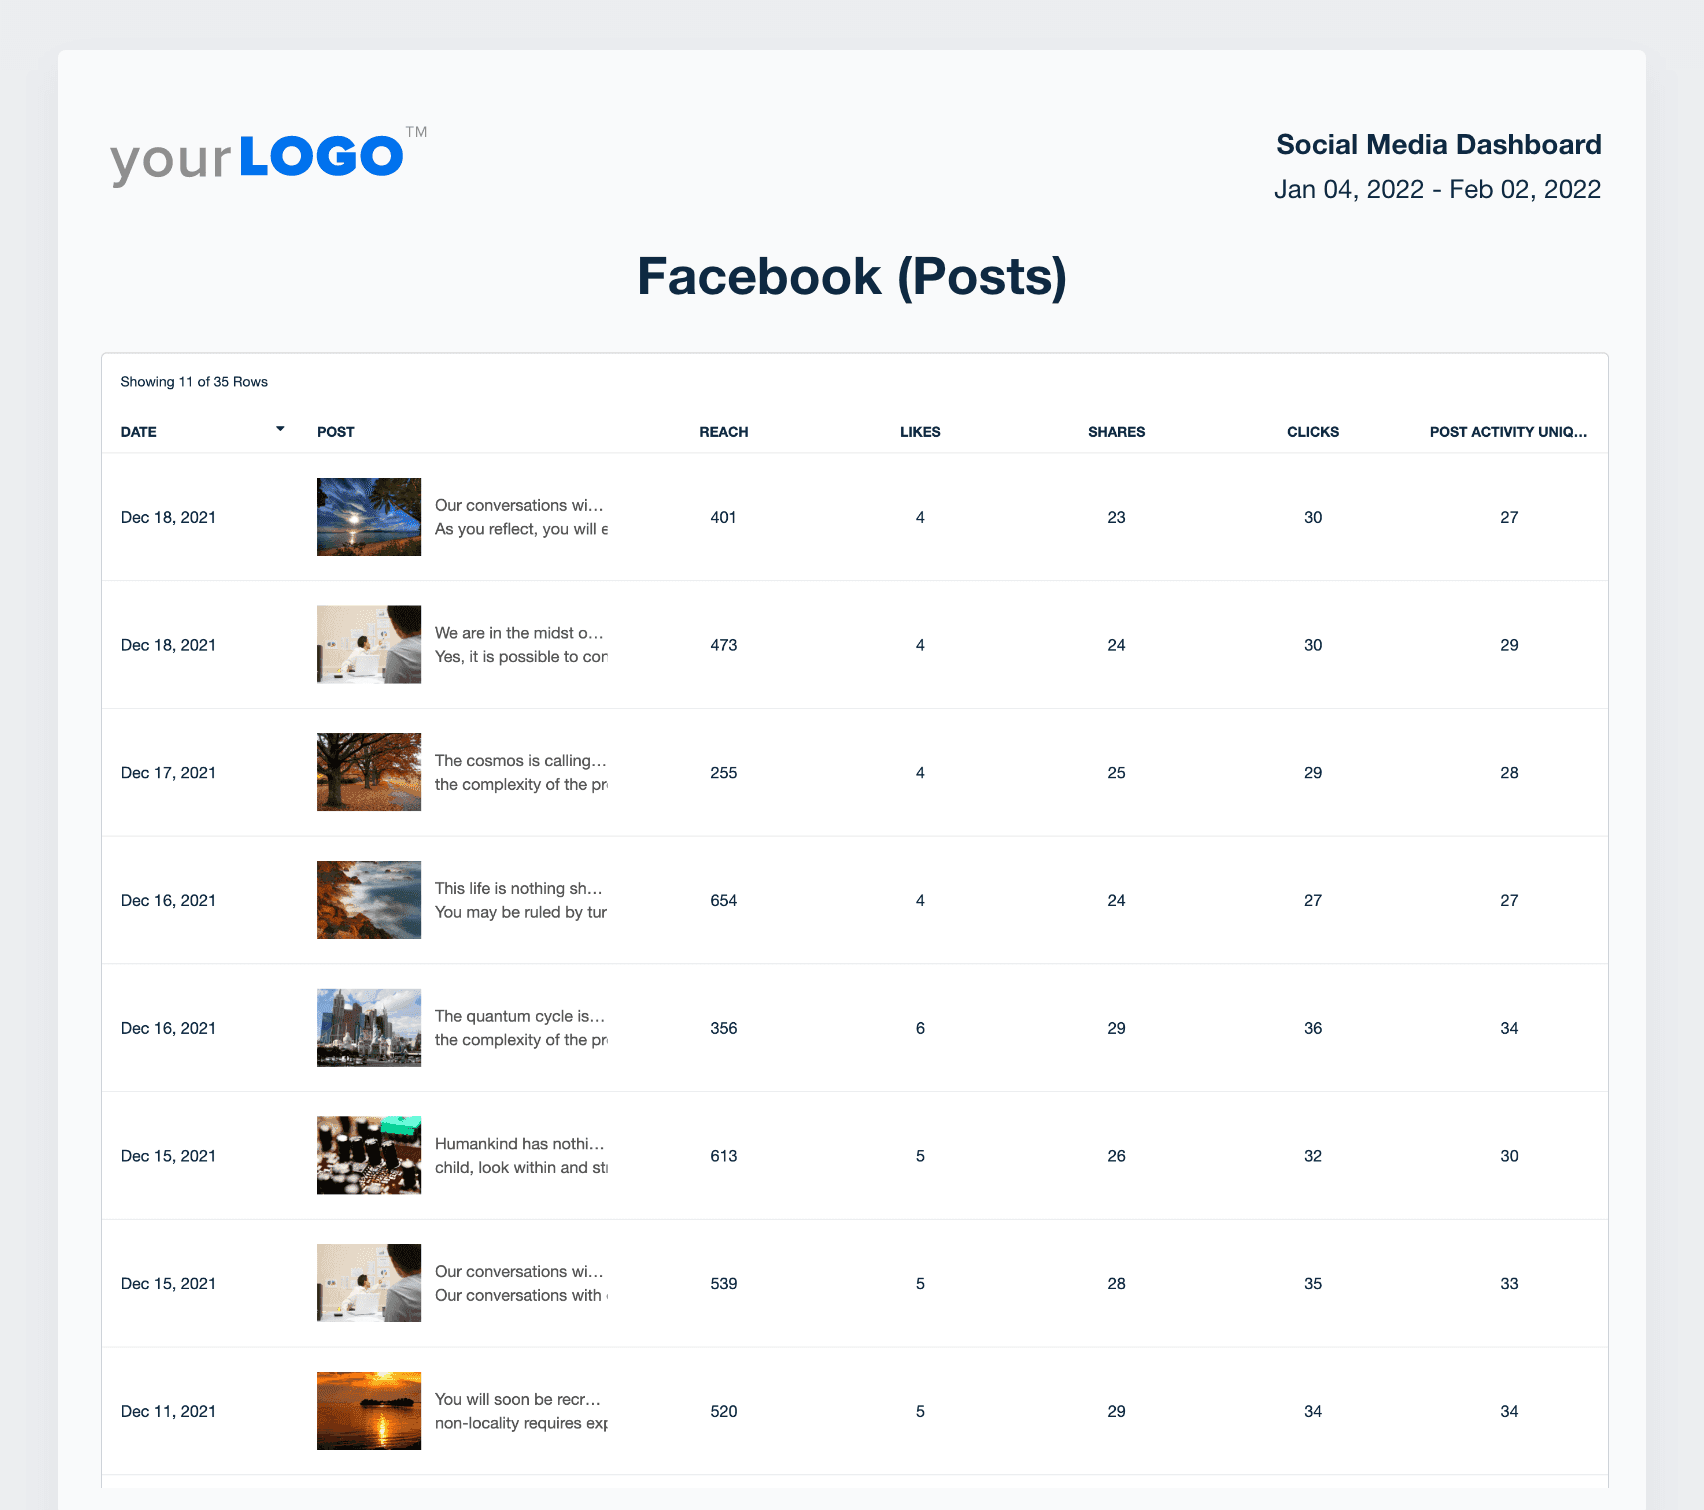
This category includes the Reach and Social Media Post Impressions metrics. Together, these KPIs help paint a picture of the potential visibility and the breadth of your content's impact.
Social Engagement KPIs
Imagine hosting a party. You've got the attendees (reach), but are they dancing, chatting, and enjoying the party (engaging), or are they standing in a corner, checking their phones? Social Engagement KPIs help answer the burning questions about user engagement.
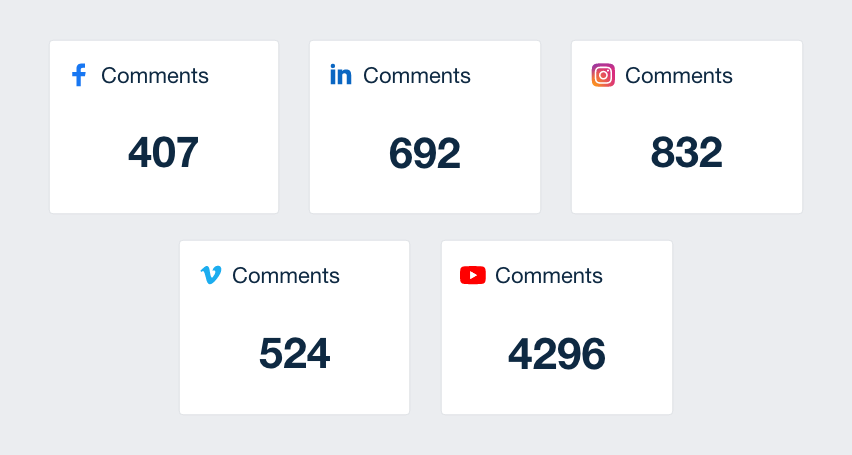
These social media KPIs measure how actively users interact with the posted content. This category houses metrics like Post Likes, Post Shares, Post Comments, Click-Through Rate, and Post Engagement Rate. High engagement means the audience actively participates in the conversation, not just standing around sipping their drinks.
Follower Growth KPIs
Here's where we look at your client’s fan club and follower count. Follower Growth KPIs track the rate at which your client’s audience grows on various social channels. Social Media analytics such as Audience Growth and the division between Organic and Paid Followers fall into this category.
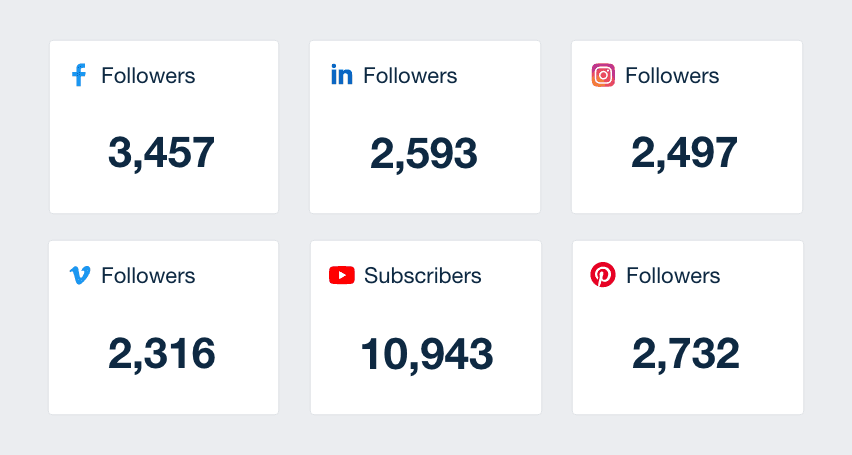
Growth is always good, but organic growth on social channels means you've got charm and charisma, not just a reasonable advertising budget.
Social Traffic KPIs
It's lovely to have a crowd at your party (reach), enjoying themselves (engagement), and even becoming regular attendees (followers). But the real win is when they leave the party to visit your coffee shop (website) for a late-night bite on the way home.
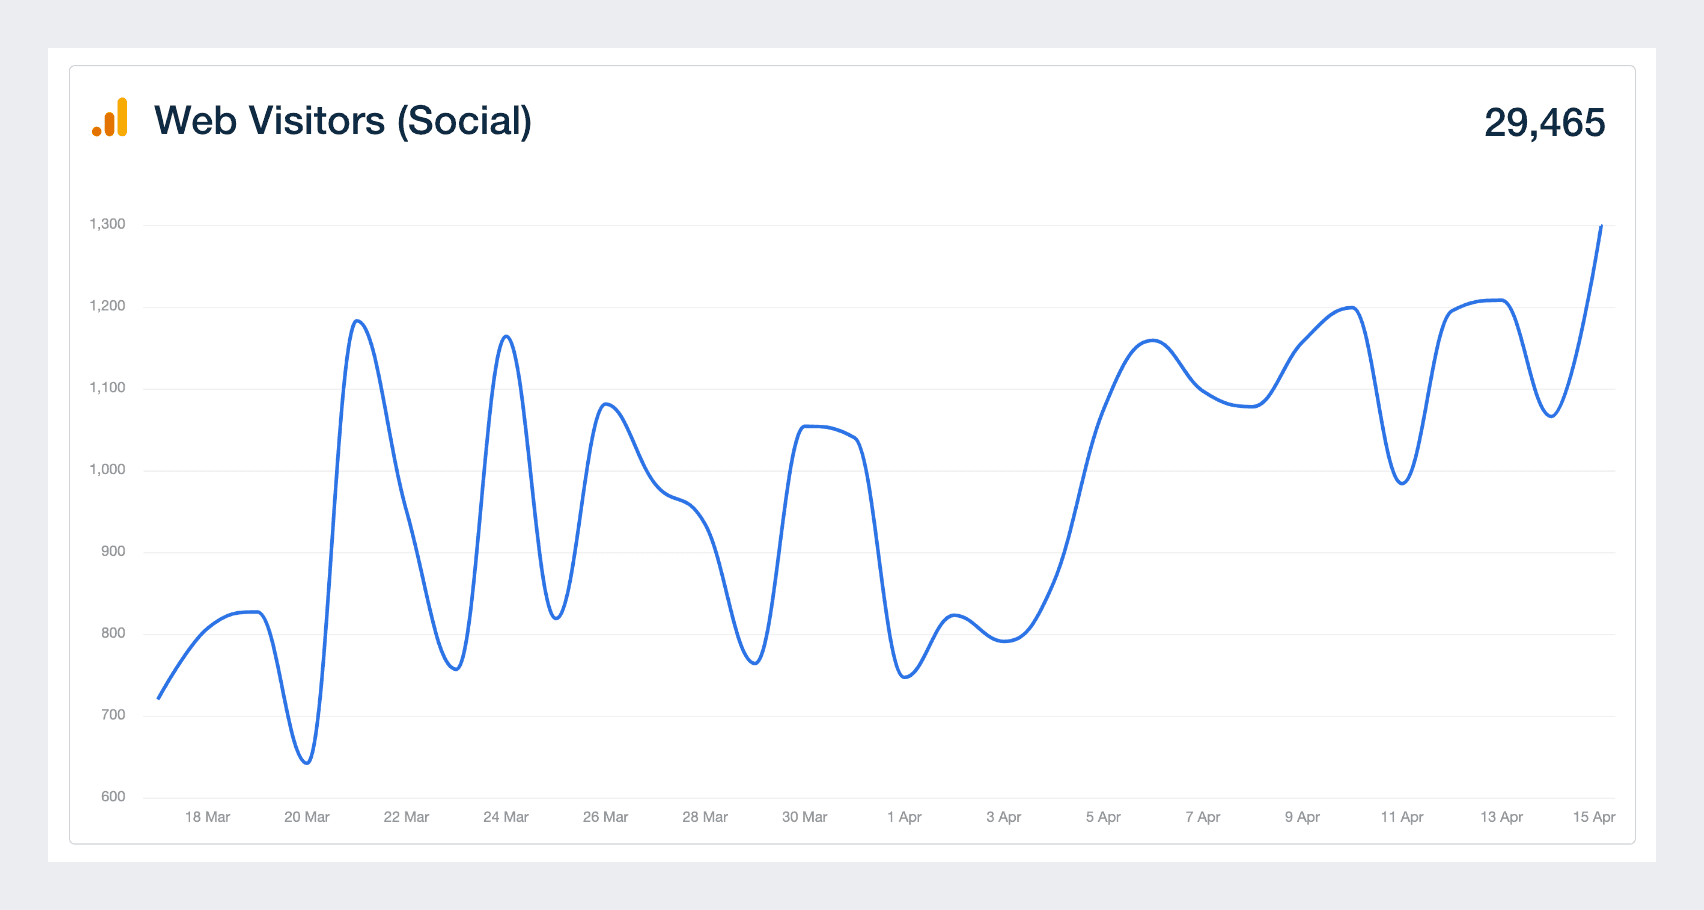
That's what Social Traffic KPIs monitor: the amount of website traffic you drive from your agency's social media strategy. This category includes the Social Web Traffic metric, usually reported through Google Analytics, which shows how many partygoers are interested enough to leave the shindig and check out your client’s place of business.
Social Conversion KPIs
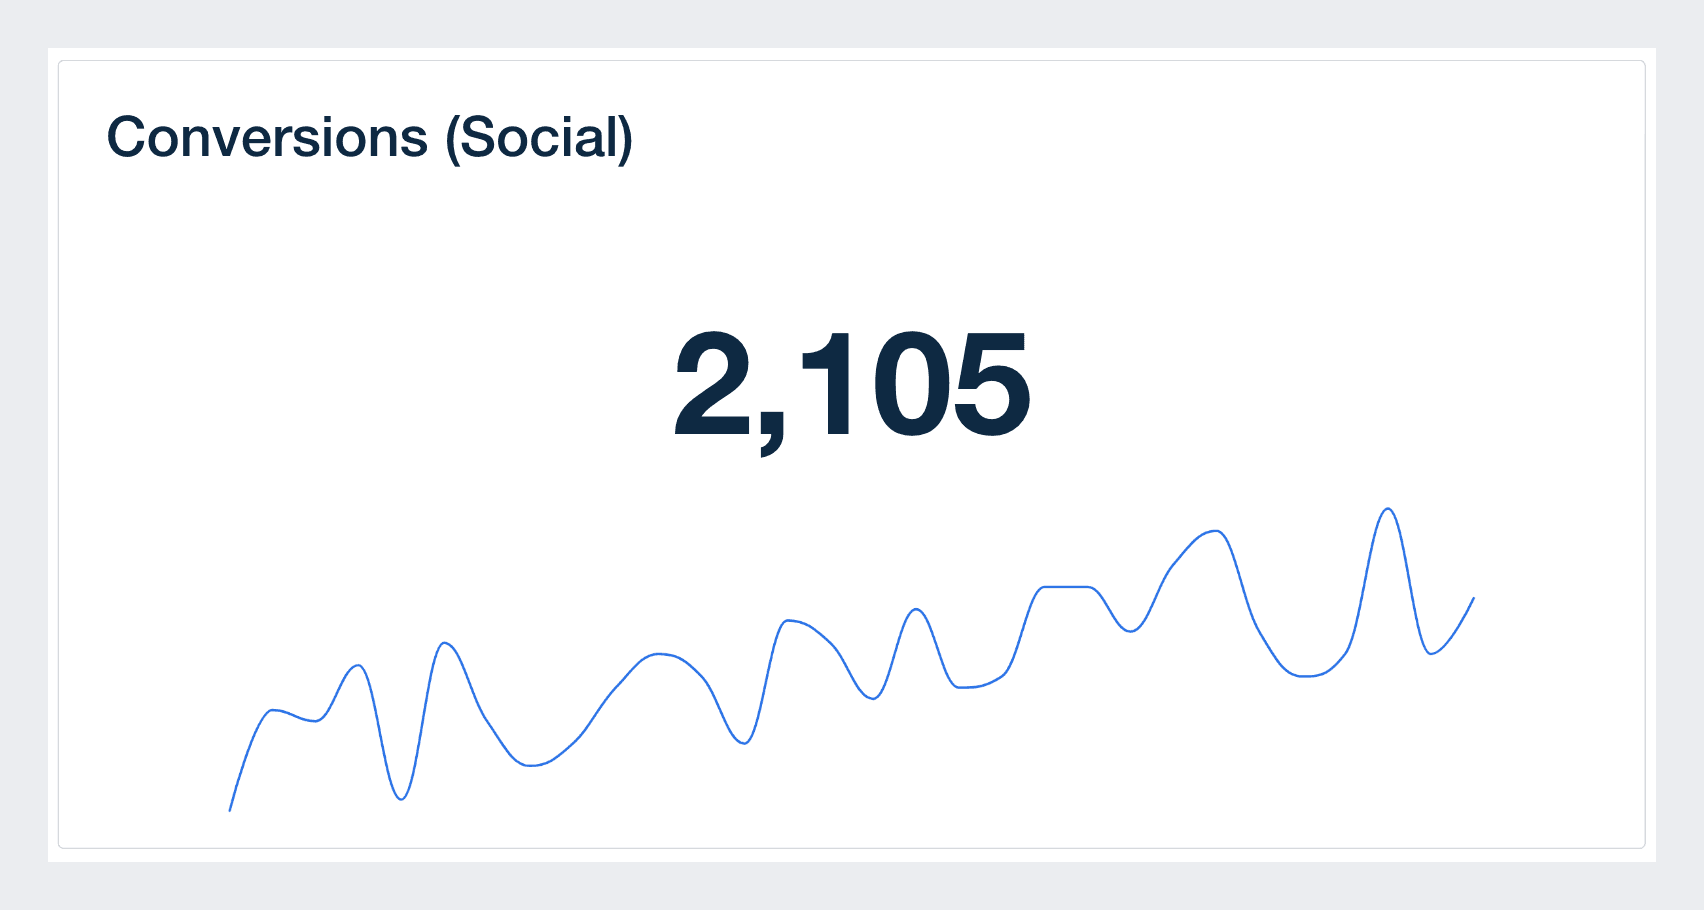
Next, we've got the ultimate in social media success: conversions. After all, what's the point of throwing a party if no one's buying what your client is selling? Social Conversion KPIs, including Social Conversions, Lead Generation, and Social Revenue, measure the tangible actions users take: making a purchase, filling out a form, or signing up for a newsletter.
Social ROI KPIs
Let's not forget the Social ROI KPIs, the heroes that bring balance to the universe. Imagine you're the host of our metaphorical party again. You've poured time, energy, and money into planning. But did you get a return on your investment? Were your guests impressed? Did you achieve the client's business goals?
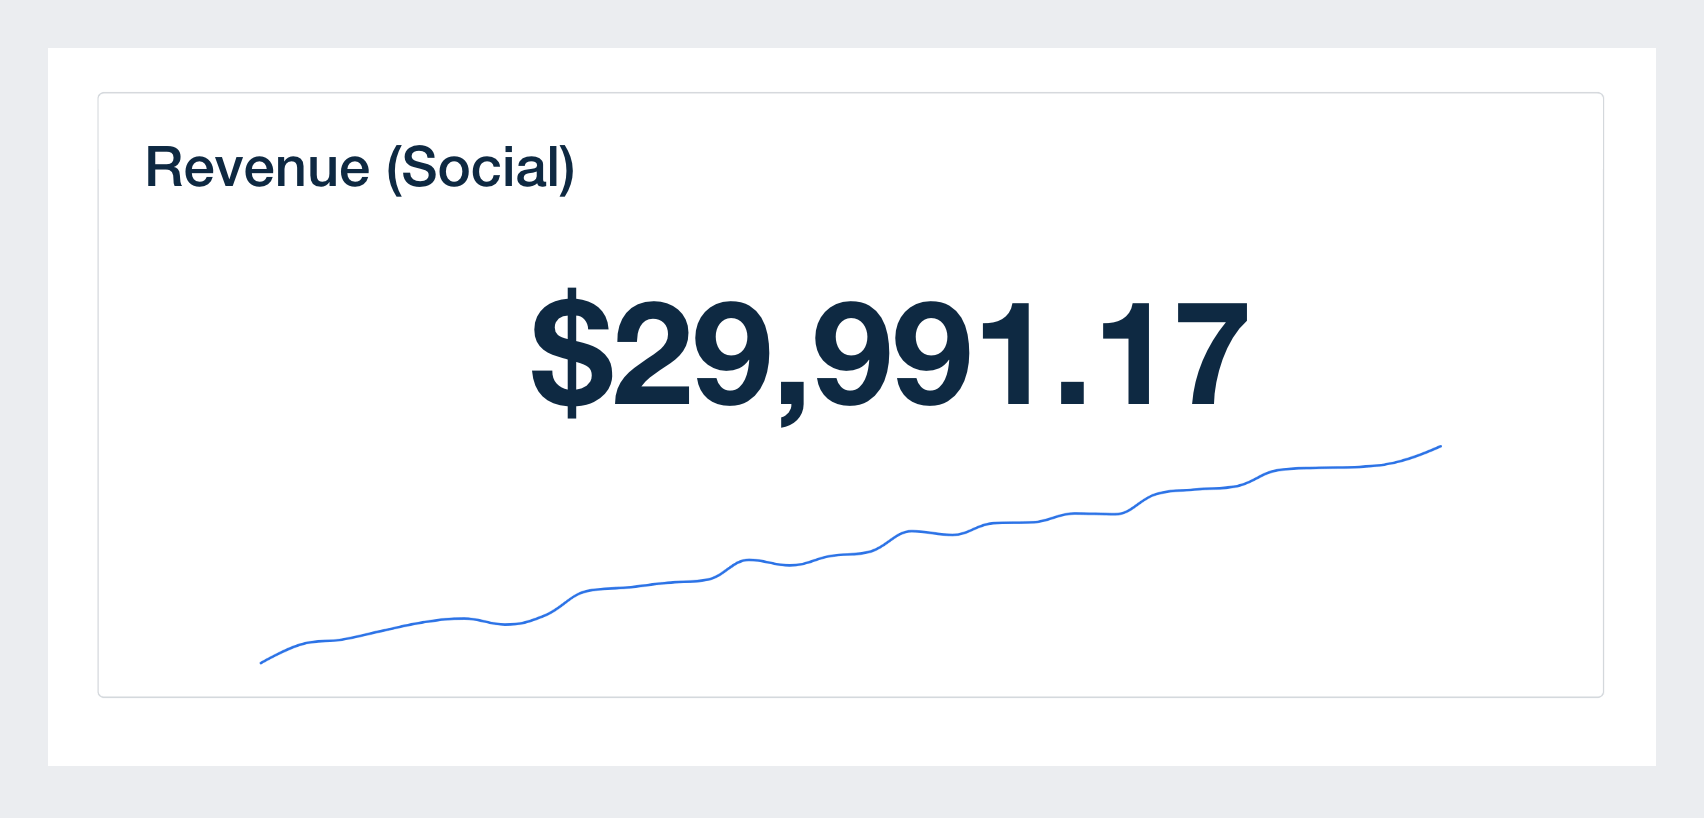
These social media metrics are the measuring tape of effectiveness, showcasing the value gained from the resources invested in social media. So, remember to keep an eye on your Social ROI KPIs. They’ll show whether all your planning paid off, proving that your social media strategy delivered exactly what your client expected.
By understanding how these KPI categories function and intersect, agencies can comprehensively understand their client's social media performance. And remember, it's not just about the numbers but what those numbers represent in the larger social media narrative. Keep that story in mind as you analyze and strategize, and the rest is a piece of cake—or in our party metaphor, the perfect cocktail.
Tools to Track Social Media KPIs
Tracking KPIs becomes much easier with the right tools. Instead of jumping between native dashboards, agency-focused platforms bring everything together, so your team stays focused and your clients stay informed.
Each platform offers something unique. When combined, they give you a complete view of how social campaigns are performing and where to optimize next.
Here are a few tools agencies rely on to stay on top of their social KPIs:
AgencyAnalytics: Built specifically for agencies, AgencyAnalytics connects with over 80 marketing tools and brings all your data into one customizable dashboard. It automates reporting, keeps everything client-ready, and lets you focus on the results.
Google Analytics 4 (GA4): Tracks what happens after someone clicks through from social. It’s ideal for understanding user behavior, conversion paths, and traffic value.
Meta Business Suite: Covers both Facebook and Instagram with a single dashboard. You’ll see performance across posts, ads, and audience insights.
LinkedIn Campaign Manager: Tailored for B2B performance tracking. It helps you measure reach, engagement, and lead generation from sponsored content.
Sprout Social/Hootsuite: Combines publishing, engagement, and reporting into one interface, supporting multiple platforms with clear visual metrics.
Each tool plays a role. Together, they give your agency everything it needs to track, report, and improve social performance with confidence.
Easily Track Social Media KPIs With AgencyAnalytics
A live social media dashboard is like a digital command center where all your clients' social media account data is dynamically displayed in real time, available 24/7, and constantly updated.
Dashboards are great because they allow the entire team to see the KPIs and data they need daily to make good decisions.
Brian Ferritto, Partner, 42connect
No need for clients to wait for the next report to land in their inbox, they can see the action in real-time, every social media platform, every post, every like, every link click.
With a live social media reporting dashboard, your clients see the performance of their social media campaign as it happens, from reach and engagement to follower growth, across all of their social media platforms. It's all there, unfolding in real-time.
Why 24/7 Access Matters
What good is a 24-hour diner if it's only open from 9 to 5? Not much, right? The same principle applies to your client's data.
Having 24/7 access to the live dashboard gives your clients the freedom to check their social media performance whenever they want, even in the wee hours of the night when insomnia strikes and counting sheep doesn't help.
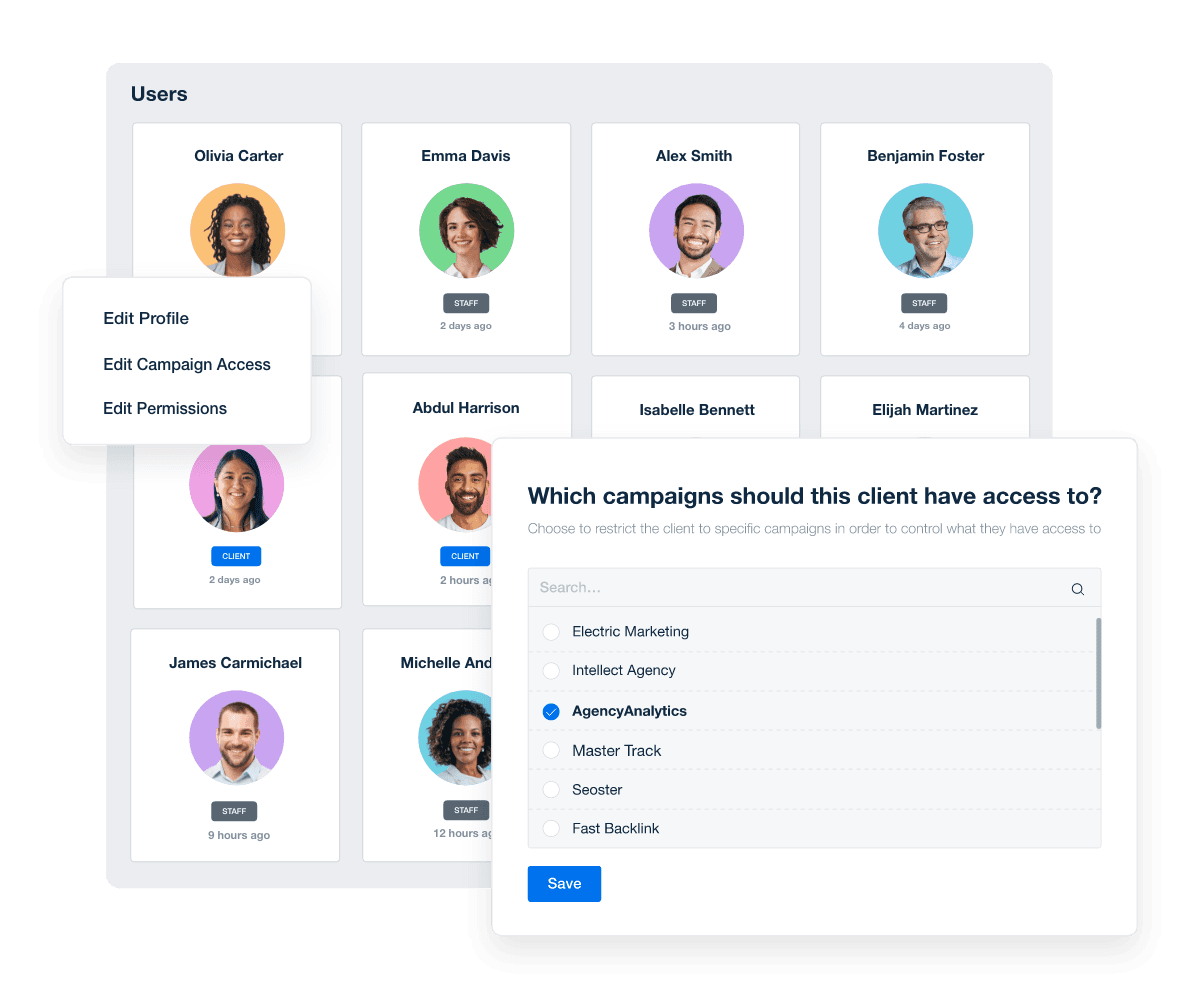
Plus, with custom user permissions, you control exactly what your client has access to, so they don’t end up sifting through the entire pantry when they only need the key ingredients.
Enter the AgencyAnalytics Social Media Dashboard
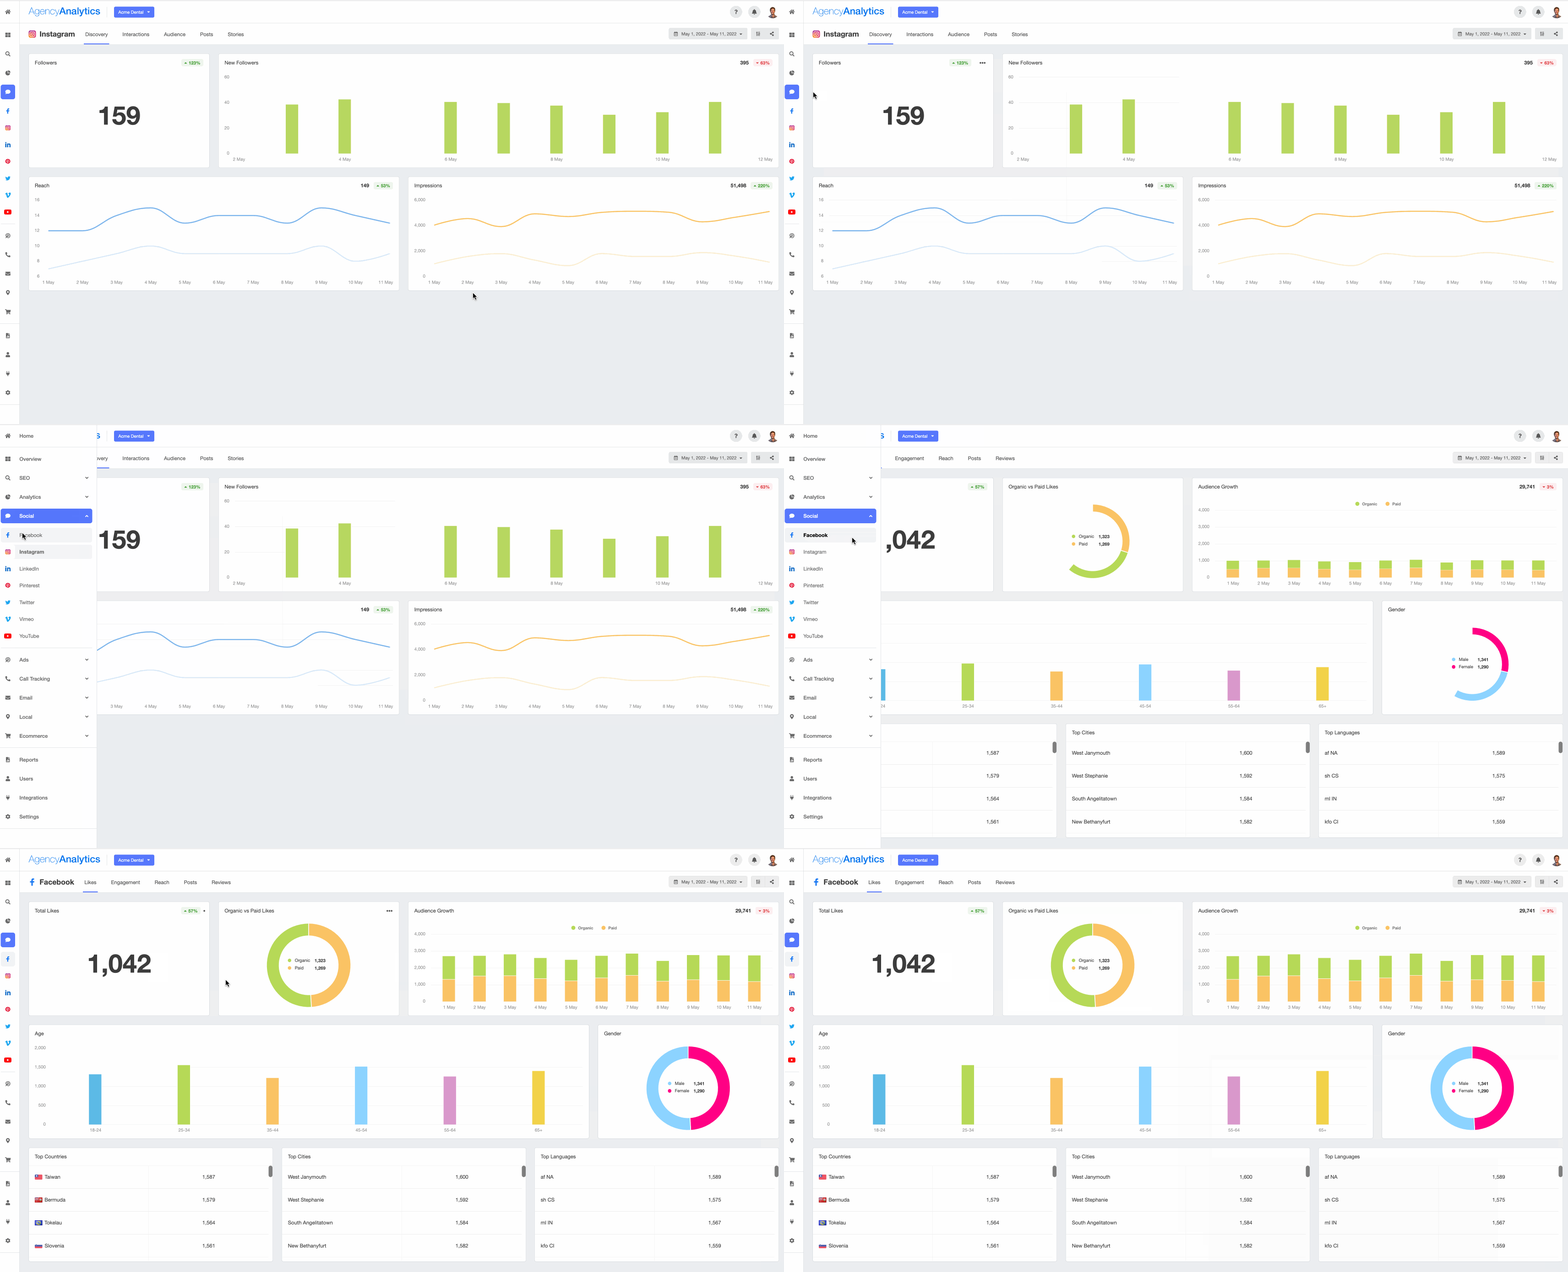
Now, let's talk about AgencyAnalytics. Its social media dashboard is like a buffet, offering all-you-can-eat data in one place. But instead of burgers and fries, you have reach, impressions, engagement, and so on—all served up in real time.
Our clients get the benefit of looking at their analytics whenever they wish, having a dashboard set up by a professional who understands the KPIs so they're not overloaded with data causing their own analysis paralysis, and giving them peace of mind to trust us as marketing experts within the industry.
Lisa Cutter, President, Vertical Insight Marketing
AgencyAnalytics is one of the most essential tools we use as an agency. Not only do we use it daily with our internal team to check specific KPIs we are tracking through various dashboards, but it has also saved us countless hours with our monthly reporting. The reports we output, and email to our clients have the data clearly visualized and look professional, giving our clients a report they can finally understand!
Brian Ferritto, Partner, 42connect
With AgencyAnalytics' dashboard, your clients get a live, continuously updated view of their social media KPIs. It's customizable to match each client's preferences and simple to use—no need for a degree in data science to understand the numbers.
To top it off, AgencyAnalytics' dashboard pulls data from multiple sources. Whether your client is on Facebook, Instagram, YouTube, or LinkedIn, all their social media performance data is available at their fingertips.
Summary and Key Takeaways
We've taken a deep dive into social media KPIs, peering into the depths of data that can be gathered and utilized to provide stunning insights and opportunities for campaign optimization. We've shared how agencies can strategically pick the right social media analytics to track based on campaign objectives, client reporting needs, current performance, and industry benchmarks.
We've discussed the importance of avoiding reports filled with vanity metrics and focusing on actionable KPIs. We've also discussed the advantages of employing AgencyAnalytics' social media report template and live dashboard.
And finally, we didn't forget about the digital marketing trinity of SEO, PPC, and social media. We acknowledged their intersection and the strategic leverage that understanding this relationship can offer.
Key Takeaways
Social media KPIs are critical tools for tracking, understanding, and improving your client's campaign success. Picking the right ones matters.
Don't let vanity metrics lead you astray. Focus on KPIs that deliver actionable insights for decision-making.
Catering to your client's specific needs and tailoring the KPIs to their objectives is essential. It's not a one-size-fits-all scenario.
Don't underestimate the power of a well-crafted social media report and a live dashboard. They can keep your clients informed and impressed.
SEO, PPC, and social media are not isolated islands. They are part of a larger digital marketing ecosystem, and their interplay can offer added advantages.
Finally, remember to keep learning and adapting. The digital landscape is ever-evolving. To stay ahead, ensure your KPI strategy is fluid and responsive.
Ready to make your social media reporting as smooth as silk? The AgencyAnalytics client reporting platform is like having a personal assistant that never sleeps, gathering the heavy lifting of data and presenting it in an easy-to-digest, visually pleasing format.
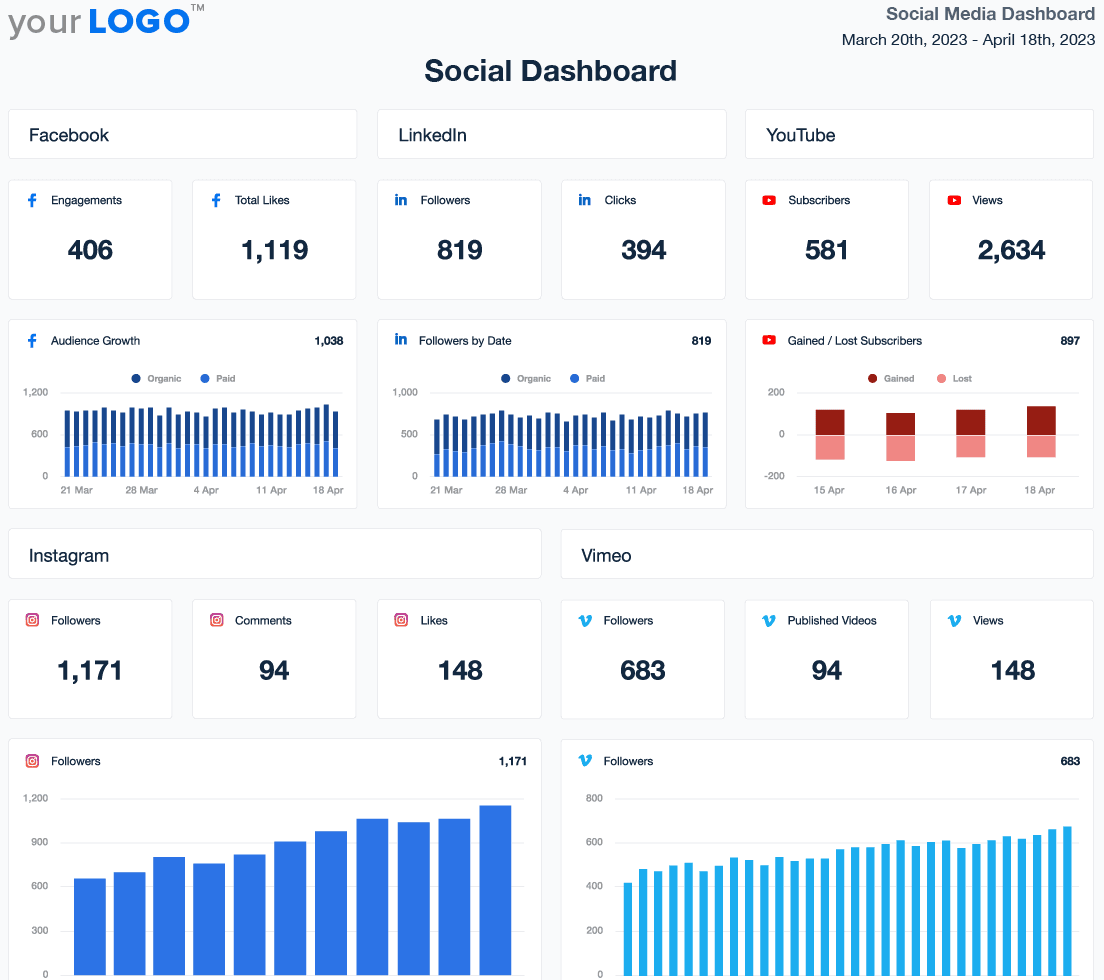
From automated reporting to a live dashboard, it's got you covered, taking the dread out of data. No more sleepless nights over spreadsheets or wrestling with raw data. With AgencyAnalytics, you’ll spend more time strategizing and less time struggling. Start your 14-day free trial and discover the benefits for yourself!
Client Reporting Made Easy with Customizable Report Templates
Multi-Channel Report Templates | Platform-Specific Report Templates |
|---|---|

Written by
Paul Stainton is a digital marketing leader with extensive experience creating brand value through digital transformation, eCommerce strategies, brand strategy, and go-to-market execution.
Read more posts by Paul StaintonSee how 7,000+ marketing agencies help clients win
Free 14-day trial. No credit card required.


