Product Qualified Lead (PQL)
Campaign Optimization
Fine-tune campaigns with PQL data for laser-focused targeting.
Resource Allocation
Allocate marketing budgets where it counts, using insights from PQL data.
Customer Segmentation
Classify PQLs to create more personalized marketing strategies.
Client Reporting
Include lead metrics in client reports to show product engagement.
Importance of Product Qualified Leads
PQLs help pinpoint the users most likely to convert, saving both time and resources. Unlike traditional leads, these users have interacted with the product and offer higher conversion potential. Tracking PQLs enables efficient focus on a smaller but higher-quality lead pool.
Tracking PQLs enables marketing and sales teams to allocate resources more effectively, as these leads typically convert at a higher rate.
By focusing on PQLs, businesses also streamline their sales cycle. These leads are usually better educated about the product's value proposition, which translates into fewer touchpoints needed for conversion. The result is a more efficient customer acquisition process.

Stop Wasting Time on Manual Reports... Get Insights Faster With AgencyAnalytics
How Product Qualified Lead Intersects With Other KPIs
Product Qualified Leads (PQLs) are critical players in an intricate network of performance indicators. When PQLs convert to paying customers, it drives recurring revenue, which helps inform strategies to target a lower Customer Acquisition Cost (CAC) and a potentially higher Lifetime Value (LTV)–like music to a marketer's ears.
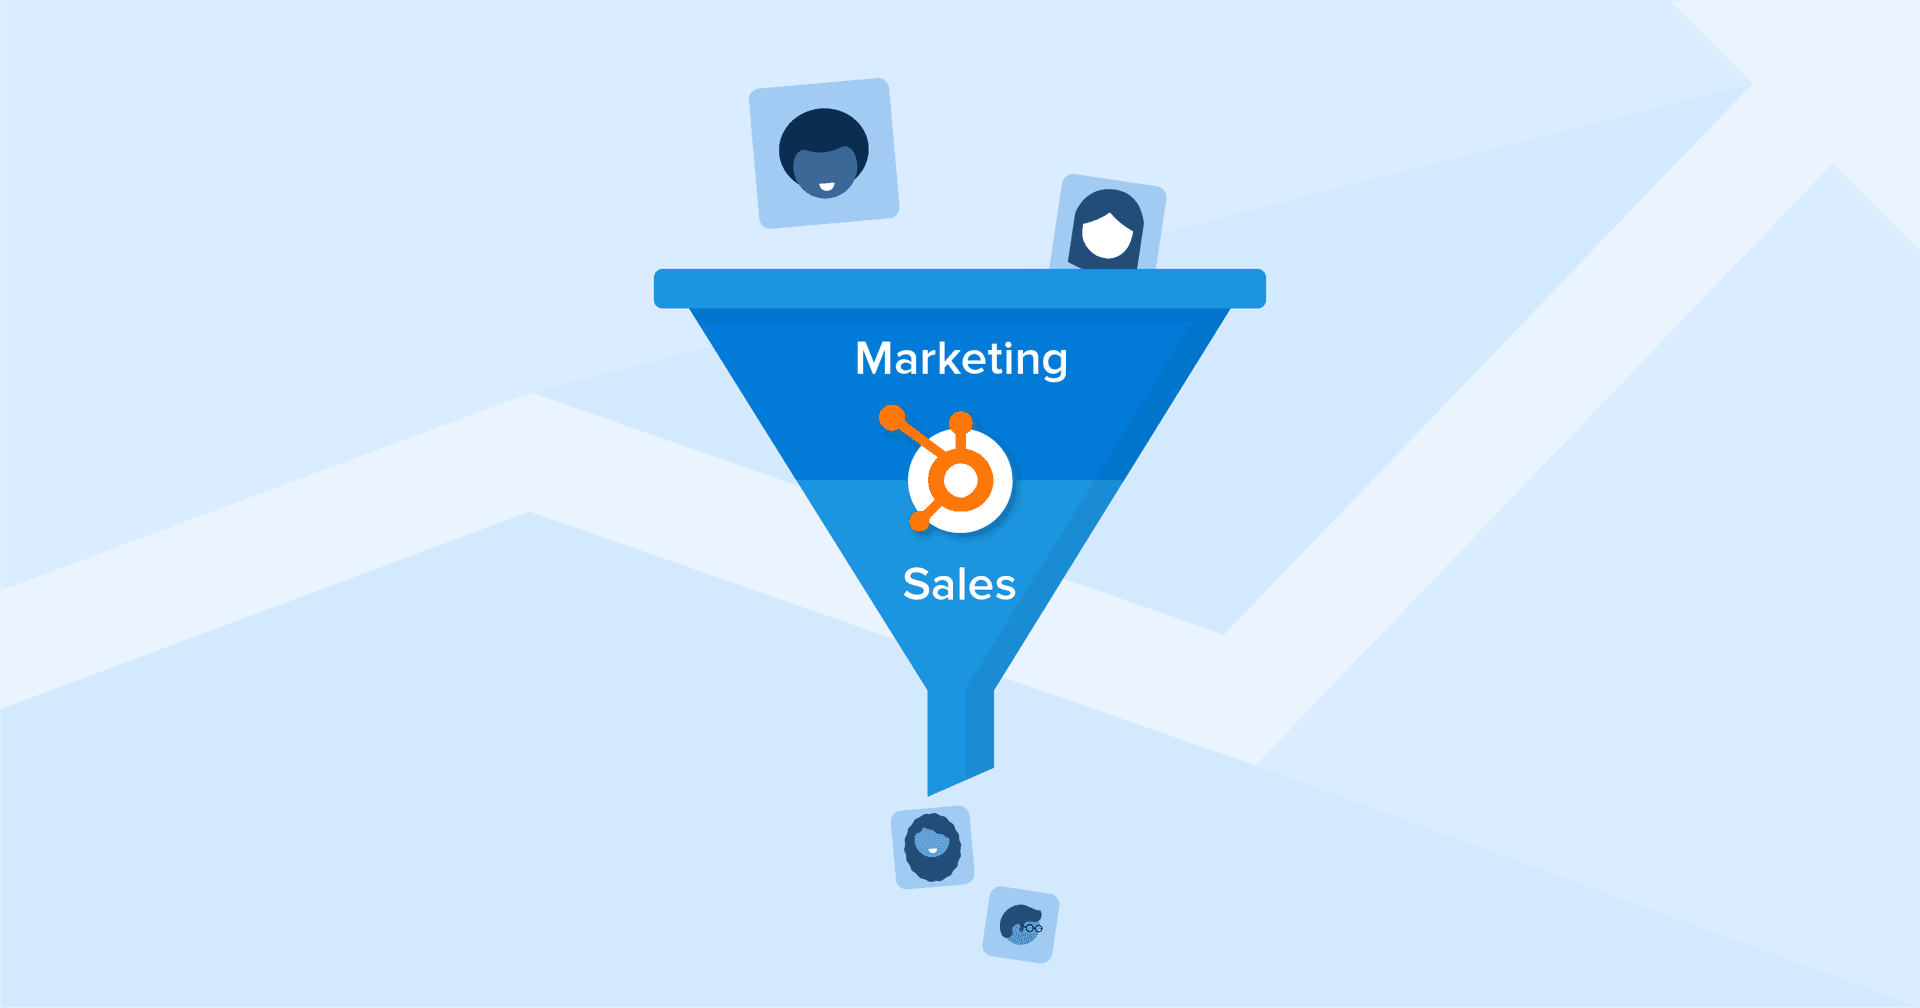
Think of PQL as the bridge between lead generation and customer conversion. The connective tissue links early-stage metrics like click-through and engagement levels to bottom-of-the-funnel metrics like conversion rates and revenue. When PQLs are strong, the whole chain is strong.
Stages of Lead Qualification
Sales and marketing teams classify leads to streamline the conversion process. For example, a Marketing Qualified Lead (MQL) is identified by the marketing team based on engagement metrics, while a Sales Qualified Lead (SQL) is marked by sales reps as ready for direct engagement, typically based on behavioral data.
For SaaS companies, Product Qualified Leads emerge when product usage data indicates a high likelihood of free users completing a purchase. This structured lead qualification process allows for efficient prioritization and targeted efforts by the marketing and sales team, enhancing the path from initial interest to closed deals.

KPIs allow us, as the agency, to demonstrate our value to the client. There are basic KPIs such as spend, clicks, impressions, ranking, etc., but the real KPIs every client wants to know are leads and/or sales. We like to include both in our monthly reports. Ultimately, what is their ROI from our efforts? When you can clearly demonstrate this month over month, it increases your retention rate and keeps clients paying you month after month.
How To Measure PQL Quantity and Quality
PQLs are users who've engaged with the product through a Free Trial or Freemium offer. To further classify PQLs, identify user actions that demonstrate a higher intent to buy—such as using a specific feature multiple times. Then, track these actions using analytics tools.
When it comes to measuring Product Qualified Leads, both quality and quantity matter. A high number of PQLs might give the illusion of success, but the true test lies in the conversion rate to actual customers. If the leads signing up for free trials are just tire-kickers who never convert, those PQLs hold little weight.
PQL Qualification Rate Formula Example
Determining a Good PQL Close Rate
A good PQL close rate is one that outperforms historical data or industry averages, thereby showing a positive trend in conversions over time. It should align well with business goals and objectives, providing a sustainable pipeline of paying customers without putting excessive strain on resources.
Recognizing a Bad PQL Close Rate
A bad PQL close rate is essentially the opposite: underperforming when compared to past metrics or industry benchmarks. It signals inefficiencies in either the marketing or sales process and necessitates immediate action to identify and fix the underlying issues.
Setting PQL Benchmarks and Goals
For agencies, leveraging past performance data is critical to set realistic benchmarks. Assessing conversion rates of similar campaigns or comparable periods offers insights into what's achievable. If an agency's historical data lacks PQL metrics, closely related KPIs serve as a substitute to ballpark expected close rates.
When there's a revenue target and a budget in place, it's possible to work backward to determine the required PQL close rate. First, calculate the total revenue target and break that down into the number of sales needed. Then, divide that by the current average transaction value. This yields the number of PQLs needed to hit the revenue target within the set budget. By knowing the number of PQLs required, it becomes clear what the PQL close rate should be for a campaign to be considered successful.
Why Product Qualified Leads Matter to Clients
Product Qualified Leads serve as a reliable metric for both product visibility and market engagement. A high count of PQLs indicates that a product isn't just attracting attention but is also compelling users to interact with it. This makes PQLs an invaluable tool for clients to allocate marketing budgets more effectively, concentrating funds on leads that are closer to converting.
Additionally, the notably higher conversion rates of PQLs compared to Marketing Qualified Leads make them a superior forecasting tool for upcoming revenue, thereby aiding in more precise financial planning and decision-making.

Why Product Qualified Leads Matter to Agencies
For agencies, Product Qualified Leads are a performance indicator that goes beyond mere lead generation. PQLs offer a transparent measure of marketing strategy effectiveness, serving as a near-immediate reflection of whether the campaign is resonating with its target audience.
PQLs also offer a more efficient way to manage budgets. High PQL rates and better PQL analytics provide data-driven insights that power smarter budget allocation and better results. Agencies shift the conversation from justifying costs to advising on scaling strategies, making PQLs a cornerstone metric in client-agency relationships.

Converting Product Qualified Leads to Sales Qualified Leads
Transforming Product Qualified Leads into Sales Qualified Leads is a strategic process that involves careful analysis and targeted actions. The first step is using lead qualification software or app analytics to assess the PQLs based on their interactions, such as app usage and engagement levels. This software aids in identifying those with the highest revenue potential, ensuring the sales team focuses on the most promising leads.
The next phase involves the sales team initiating a sales conversation. Tailored communication based on the specific needs and interests of potential customers can significantly boost conversion rates. It's about shifting the dialogue from general product information to how the product can specifically address their unique challenges or goals.
For software companies, understanding how potential customers are using the product is crucial. Tracking usage patterns helps determine if the product aligns well with their needs, indicating a strong product-market fit and a higher likelihood of conversion to SQLs. This approach not only streamlines the sales process but also ensures that the sales team is engaging with the most valuable customers.

Save Time and Money by Automating Your Client Reporting
How To Analyze and Optimize Using PQLs
Detailed analysis of PQLs helps seasoned marketers run smarter campaigns. This involves tracking trends, evaluating channels, and keeping an eye out for anomalies that could either spell trouble or present an opportunity. But crafting a PQL report isn't just about numbers. The real magic lies in the narrative those numbers tell. Here are a few ways to make your PQL reports digestible and actionable for clients.
Analyze PQLs Over Time
Watching PQLs over time helps to identify pattern shifts. Was there a spike after a holiday sale or a dip when a campaign ended? These details tell agencies where to invest more time and resources.
Compare PQLs Across Channels
Different channels—think email, social media, or SEO—yield varying PQL results. Knowing which channels are most effective for quality PQL generation informs where the marketing budget is best allocated.
Measure PQLs Across Campaigns
Comparing PQL data from different campaigns provides insights into what messaging or strategies work better. Is Campaign A outperforming Campaign B? It's time to rethink elements that lag.
Put PQLs in Context
PQLs don't exist in a vacuum. Pair them with KPIs like customer acquisition cost or lifetime value to give a fuller picture. This context helps clients understand the efficiency and quality of lead generation.
Visualize PQL Performance
Charts, graphs, and dashboards are your friends. A well-placed visual instantly clarifies what pages of text or numbers can't. They allow quick comparison and ease of understanding, saving your client precious time.
Create Goal-Oriented Reports
Don't just hand over data; show its relevance. Link PQL metrics directly to client objectives, whether that's expanding into a new market or increasing annual revenue. This turns data into a roadmap for future strategy.
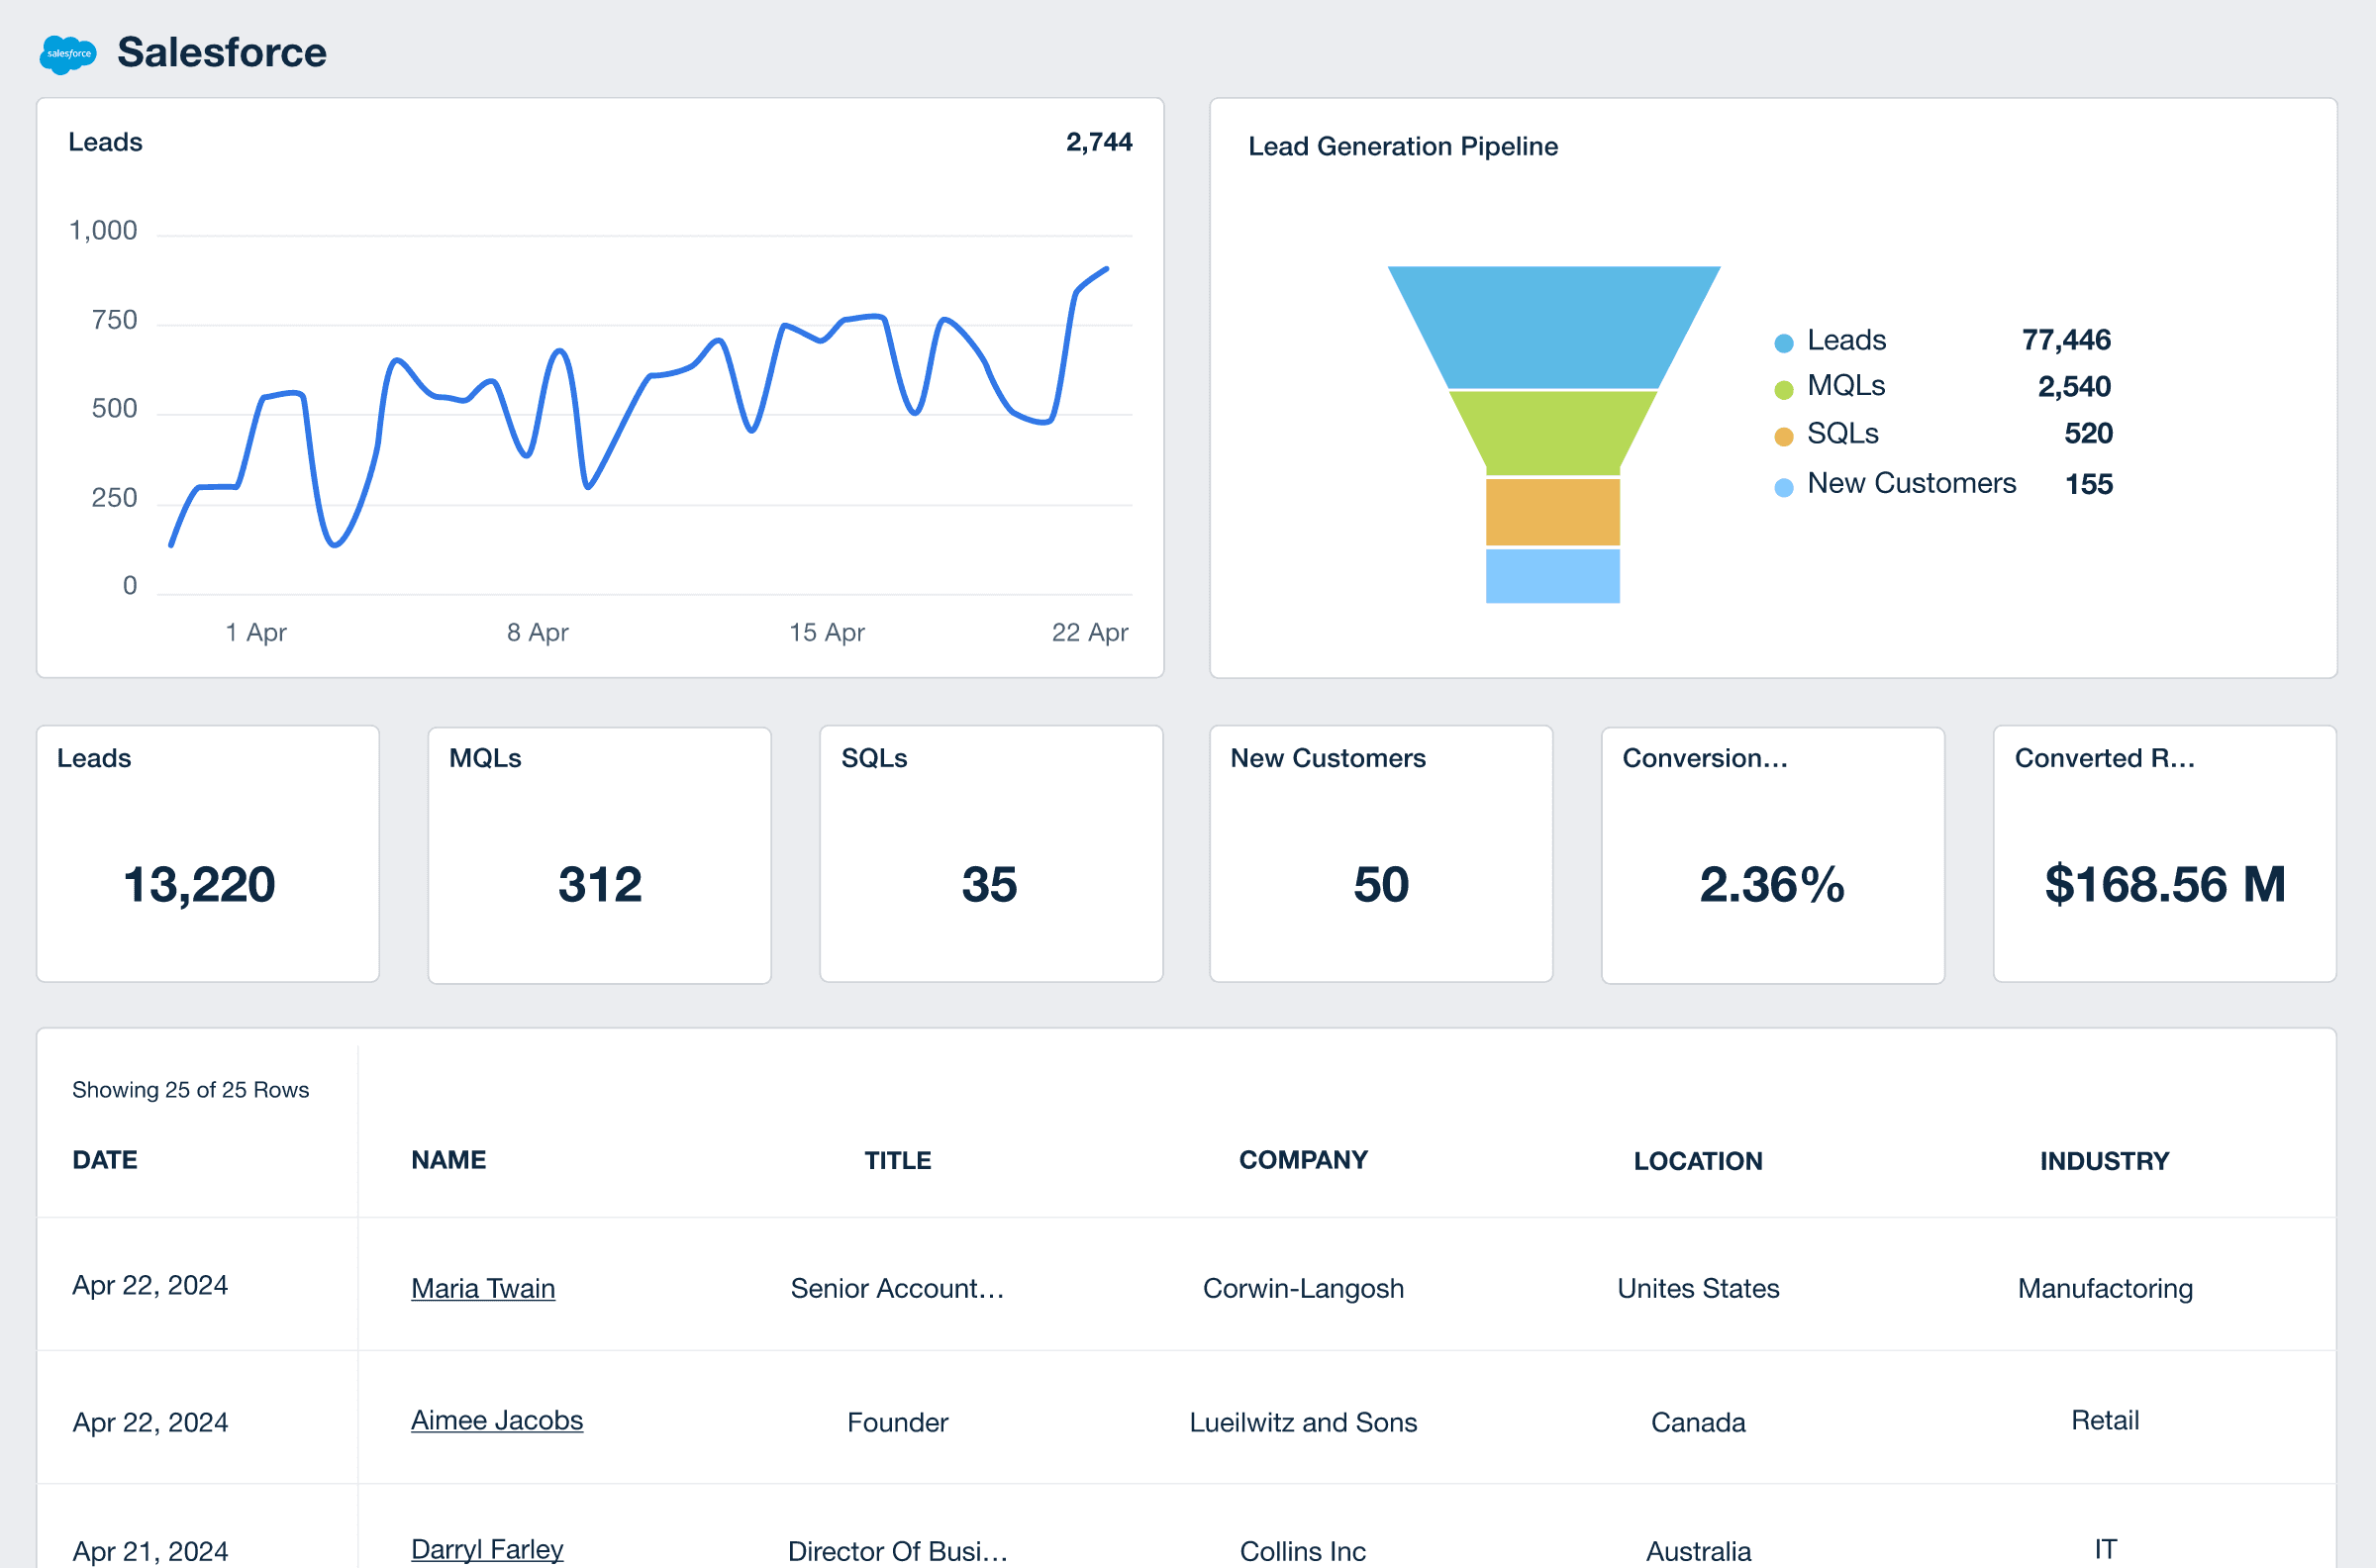
Salesforce Dashboard Example
Tips for Elevating PQL Metrics
Getting more Product Qualified Leads is nice; making sure they contribute to revenue is even better. Here are some simple but impactful ways to up your PQL game while boosting that bottom line.
Optimize Free Trials
A free trial should never be a free ride. Use the trial period to engage and educate the user, making conversion to a paid customer more likely.
Segmented Nurturing
Different leads need different nurturing. Segment them based on behavior and roll out targeted engagement plans to boost PQL conversion rates.
Make Data-Driven Decisions
Look to the numbers. Continuously measure the revenue each PQL brings in and adjust strategies to favor the most profitable behaviors.
Related Blog Posts
See how 7,000+ marketing agencies help clients win
Free 14-day trial. No credit card required.


