Table of Contents
Table of Contents
- What is a KPI dashboard?
- Types of KPI dashboards used by marketing agencies
- Benefits of KPI dashboards
- Impact of KPI dashboards on decision-making processes
- How to create a KPI dashboard for efficient automation
- What to look for when choosing KPI dashboard software
- Why should you automate your KPI reports?
7,000+ agencies have ditched manual reports. You can too.
Free 14-Day TrialQUICK SUMMARY:
A KPI dashboard is an essential tool for presenting key performance indicators through interactive charts, tables, and graphs, enabling efficient, visual data analysis of business data. Different from periodic reports, KPI dashboards offer real-time data, optimizing resource use in data monitoring. This article provides insights into creating automated KPI dashboards quickly, simplifying KPI tracking and granting clients easy access to their most significant performance metrics.
Assuming that more data is automatically better is a disservice to clients, even if they asked for all their metrics. After all, you don’t want them drowning in a sea of data without a life jacket.
Focusing on the key performance indicators (KPIs) is how your agency demonstrates its value to clients–and tracks their goal progression. And an automated KPI dashboard streamlines your client reporting, keeping everyone informed with just the right amount of information.
This guide shows your agency how to create automated KPI dashboards in minutes, making it easy for clients to access the key performance indicators that matter most to them.
What is a KPI dashboard?
A key performance indicator provides essential marketing operational insights by displaying KPIs (hence the acronym) in interactive charts, tables, and graphs, allowing for quick, organized review and analysis.
A KPI dashboard helps track these key metrics related to various business operations such as ad spend, traffic, revenue, customer satisfaction, sales, marketing, and operations. Think VISUAL data for your clients.
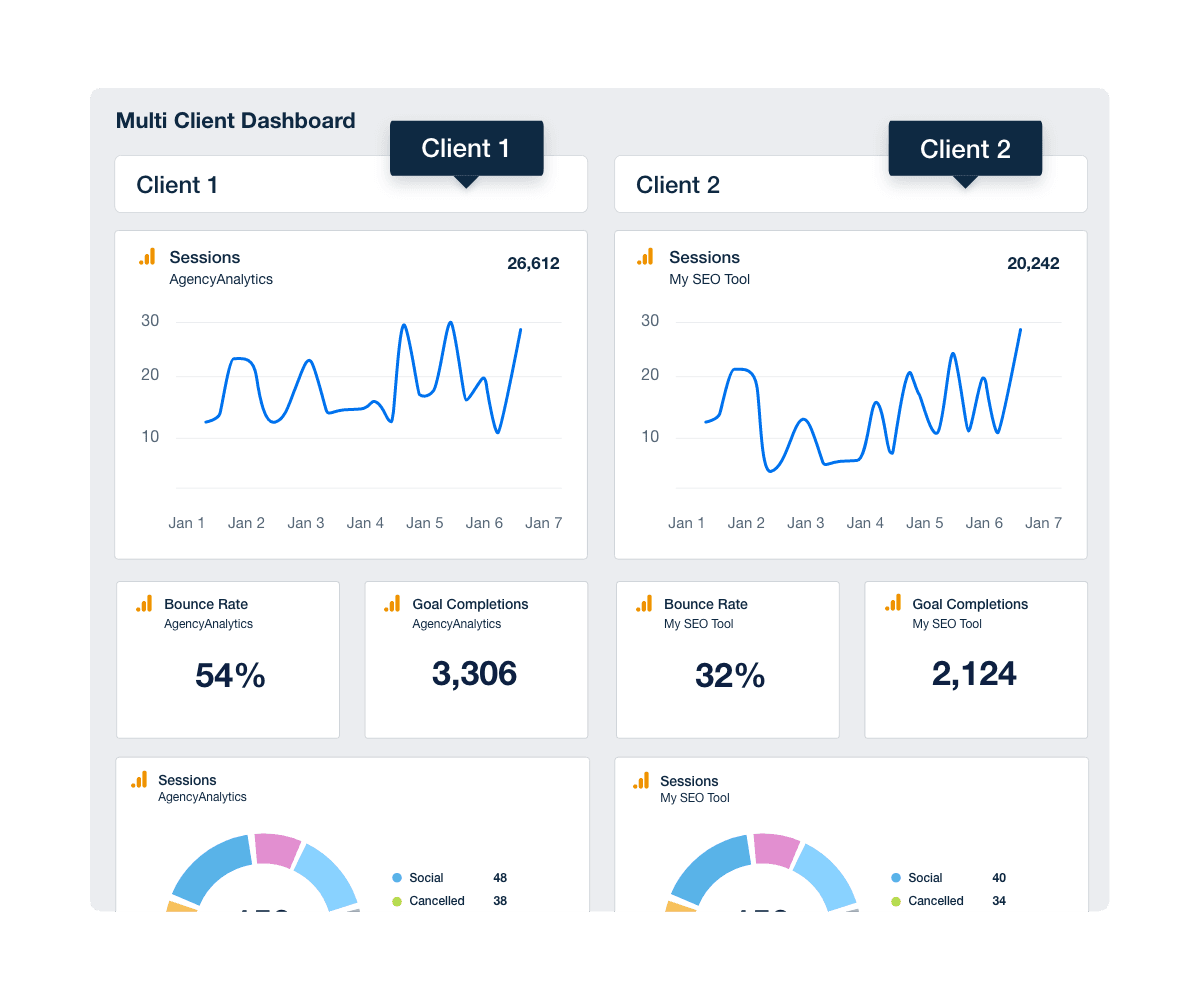
Key performance indicators are quantifiable performance measures over time for specific objectives, depending on your clients’ goals. KPI reporting dashboards enable any user to easily explore the data behind the KPIs and uncover actionable insights–right this second. They transform massive data sets from across your client’s organization into data-driven decisions that improve their businesses. No two clients are the same, so dashboards should always be tailored based on unique goals and objectives.
KPIs allow us as the agency, to demonstrate our value to the client. There are basic KPIs such as spend, clicks, impressions, ranking, etc., but the real KPIs every client wants to know are leads and/or sales. When you can clearly demonstrate this, it increases your retention rate and keeps clients paying you month after month.
Jacob Hicks, Owner, Magnyfi
Also, modern KPI dashboards differ from client marketing reports. Remember that:
A KPI dashboard includes real-time data.
A report is a snapshot of that data for a given period.
Agencies that distinguish between the two and use them appropriately take full advantage of the benefits of data monitoring without wasting resources.
Types of KPI dashboards used by marketing agencies
KPI dashboards vary in type and complexity, catering to different aspects of digital marketing and client needs, and are often broken down by department, target recipient, or channel.
7 popular departmental and channel-specific KPI dashboards
Here, we explore seven popular types of KPI dashboards commonly used by marketing agencies, delving into their functionalities and the specific aspects they cover.
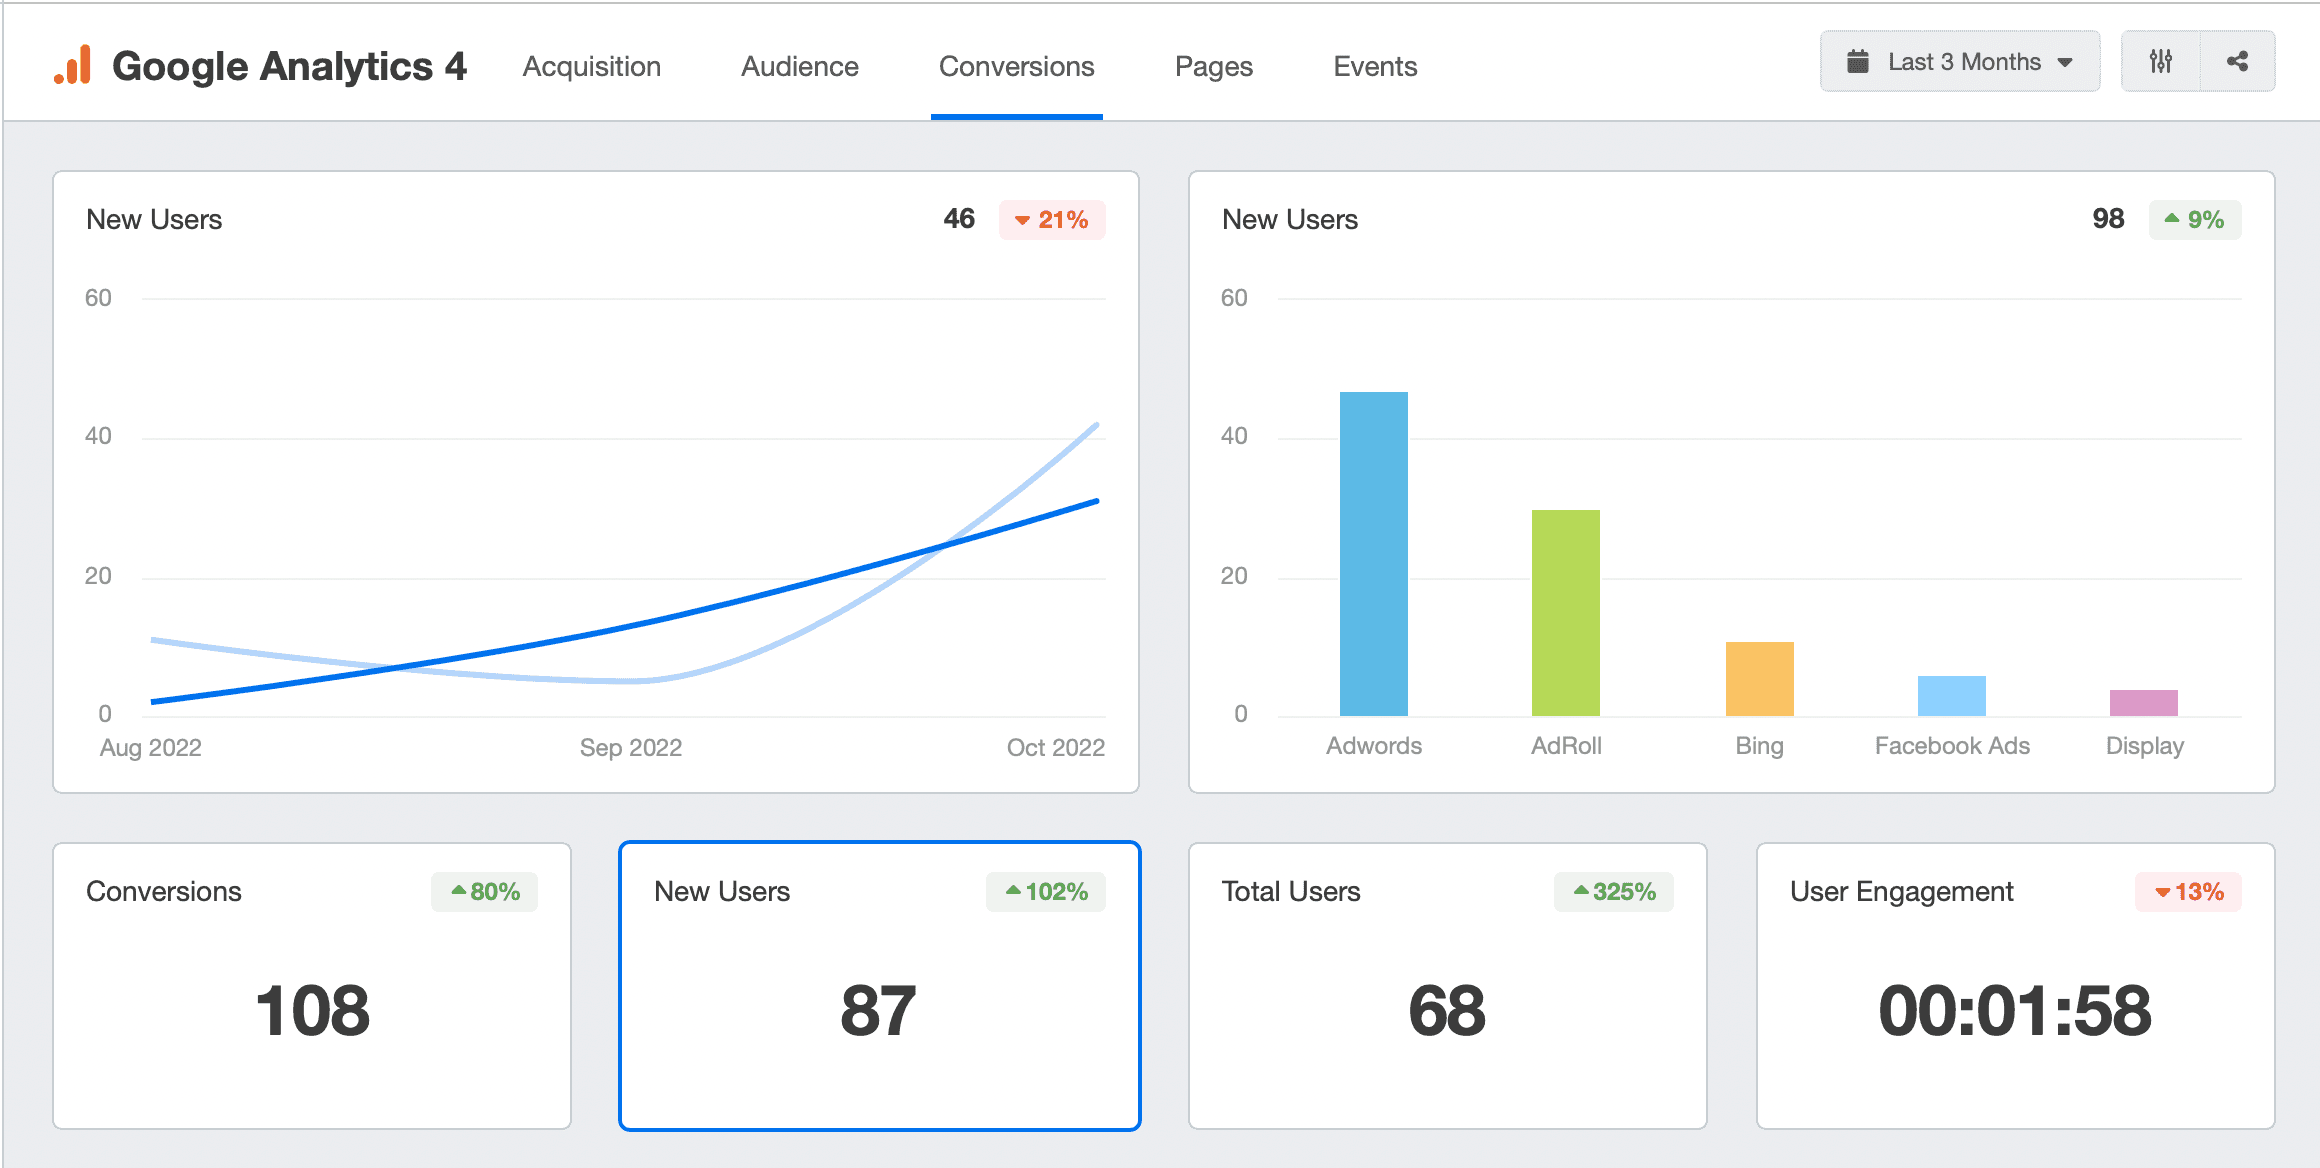
1. Web analytics dashboards
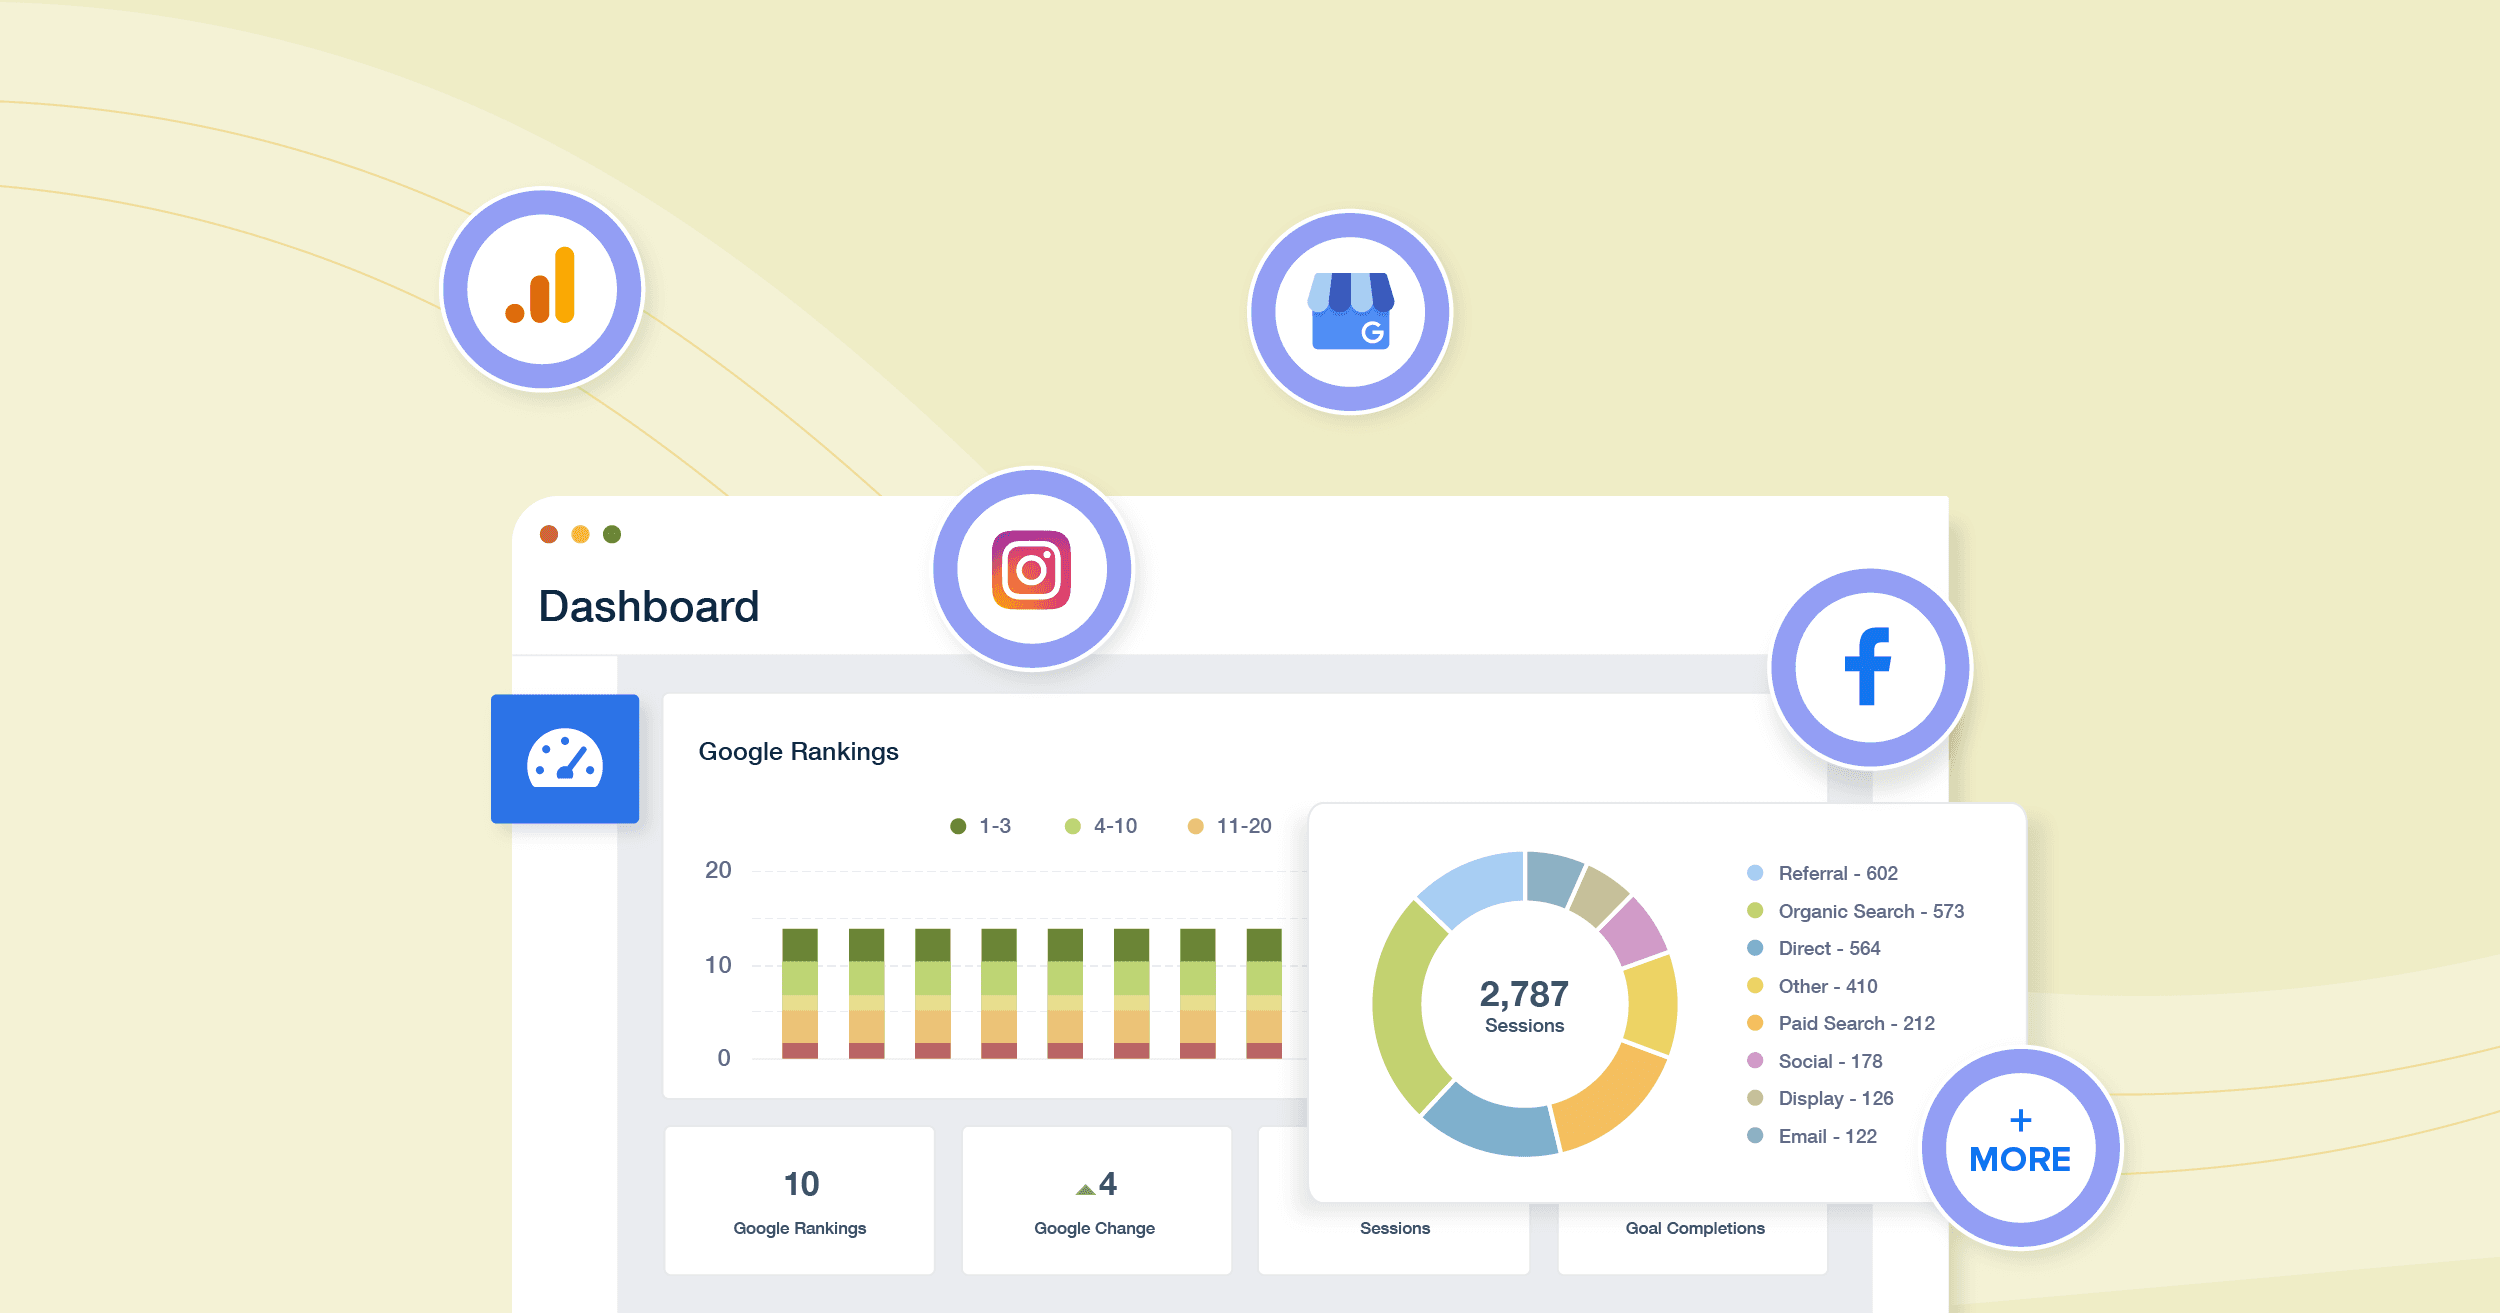
Web analytics dashboards focus on aggregating data from various sources to provide insights into website traffic, user behavior, conversion rates, and more. These dashboards typically draw from tools like Google Analytics, offering a detailed view of how users interact with a client's digital properties.
2. Operational dashboards
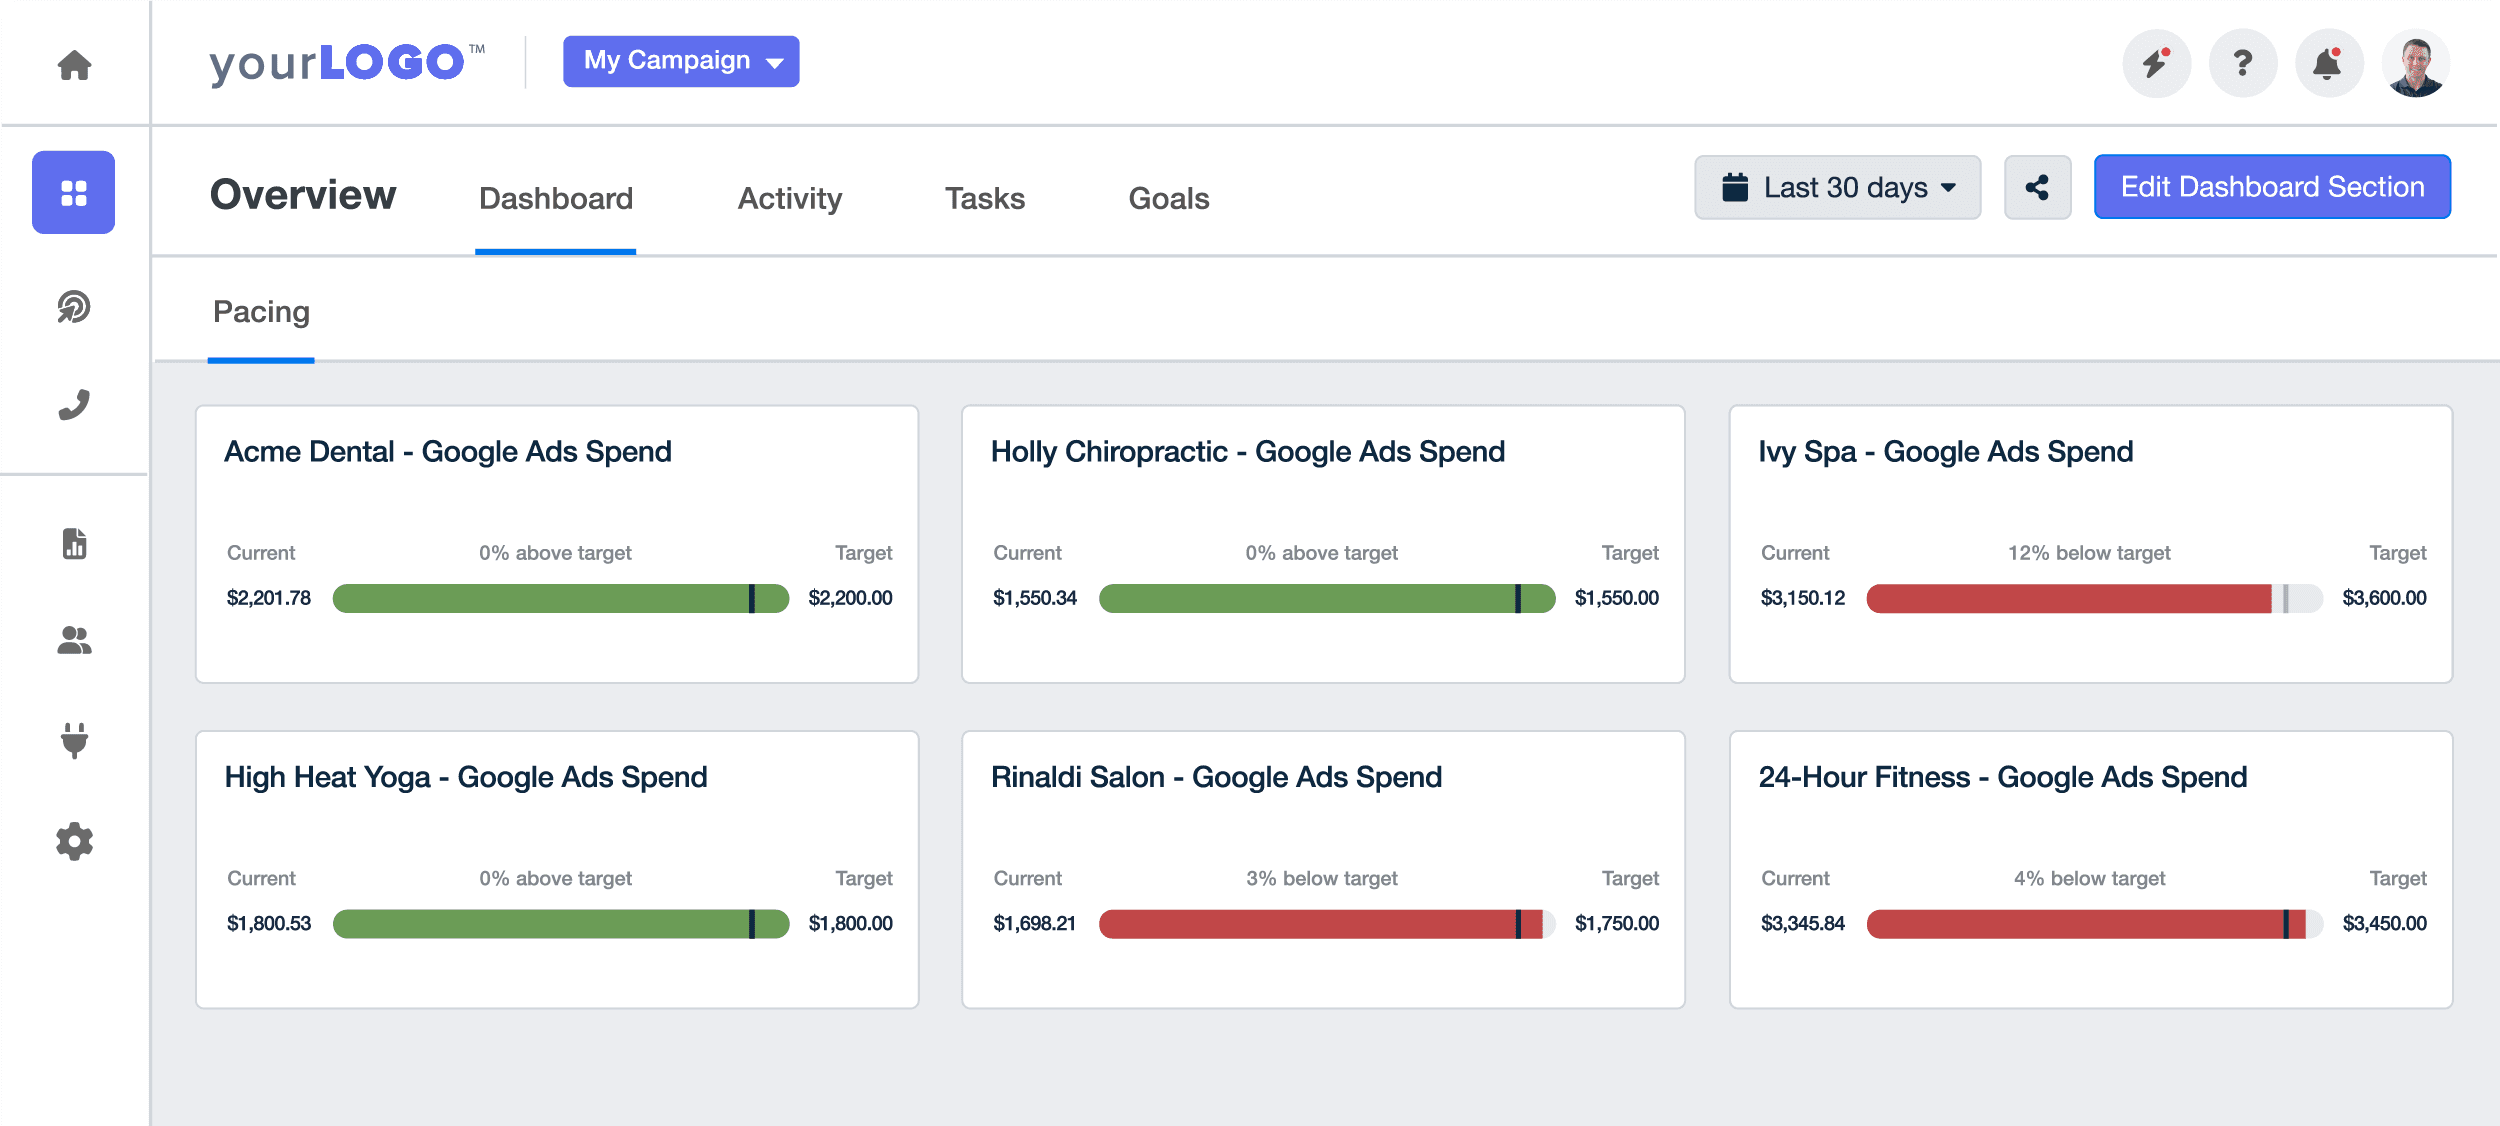
Operational dashboards display real-time data that helps inform the effectiveness of daily operations. They track ongoing campaigns, website performance, and immediate metrics, enabling quick responses to any emerging issues or opportunities.
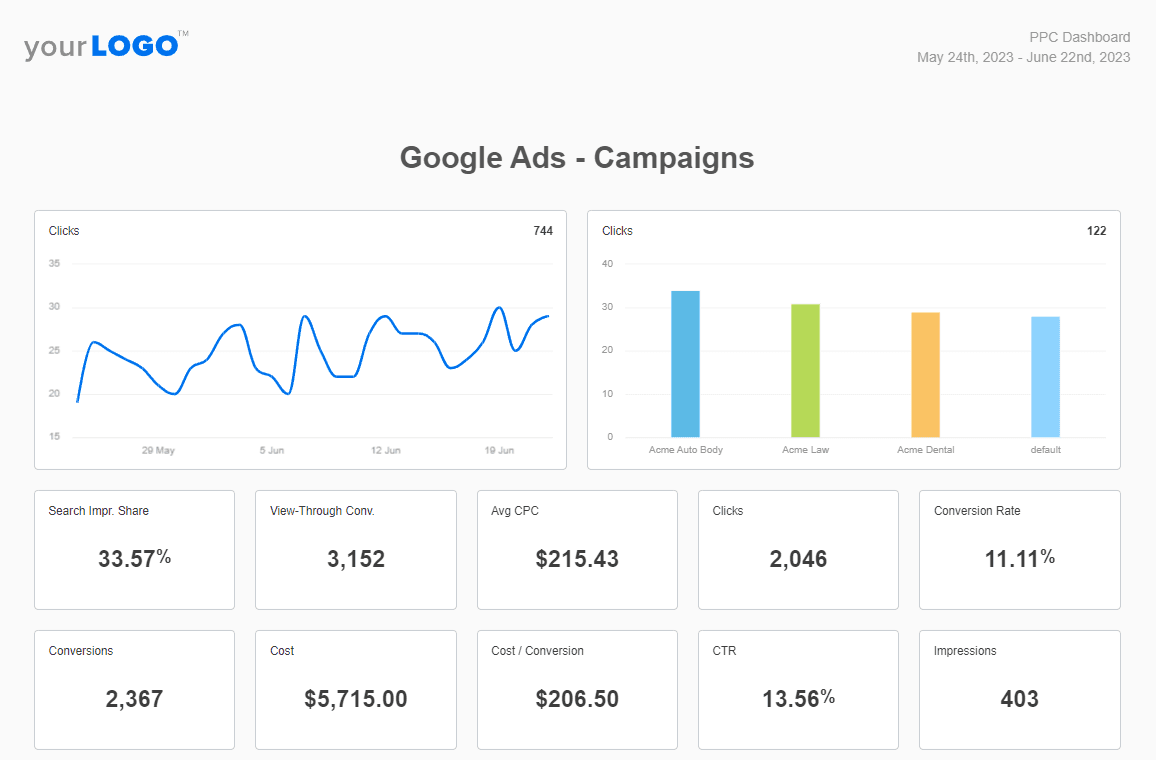
3. PPC dashboards
PPC (Pay-Per-Click) dashboards are designed to monitor the performance of paid advertising campaigns. They measure progress in terms of click-through rates, cost-per-click, conversion rates, and ROI, offering insights into the effectiveness of ad spend.
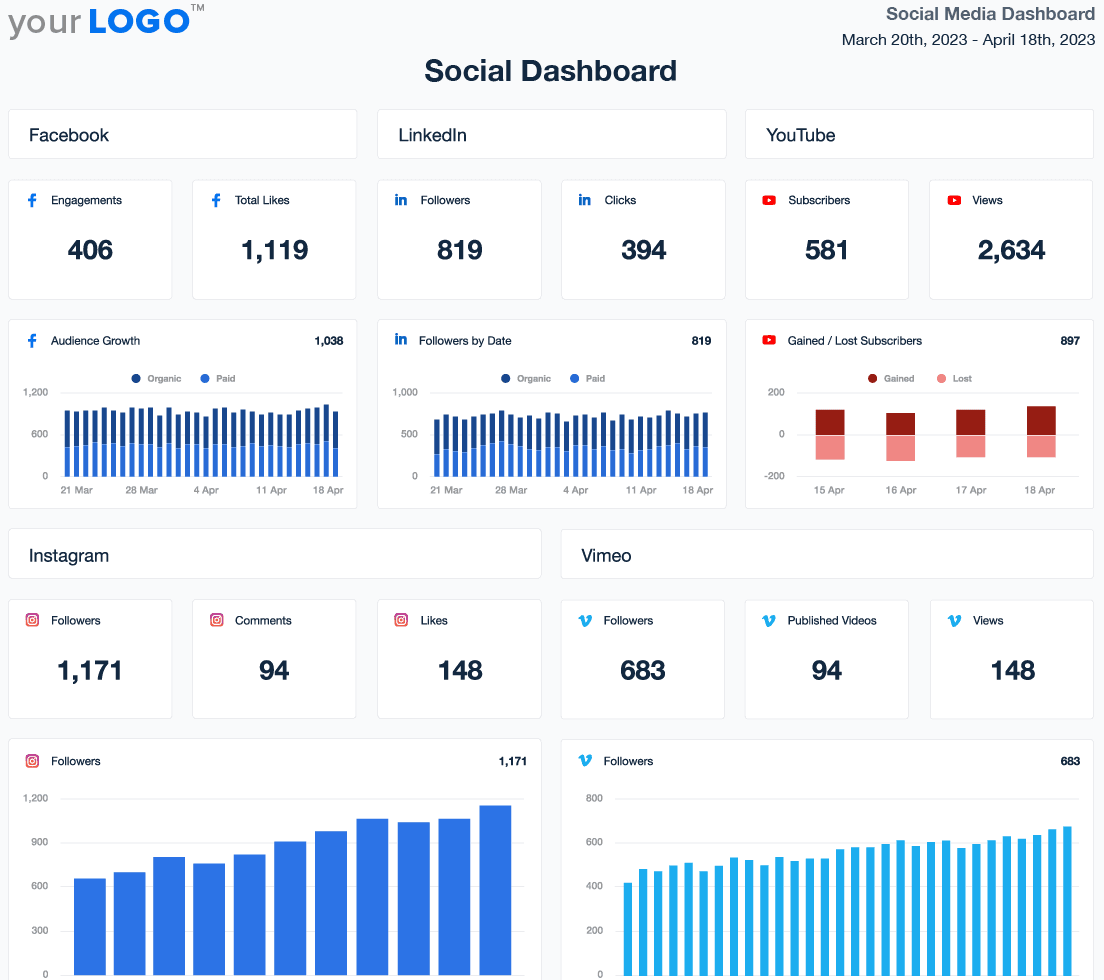
4. Social media dashboards
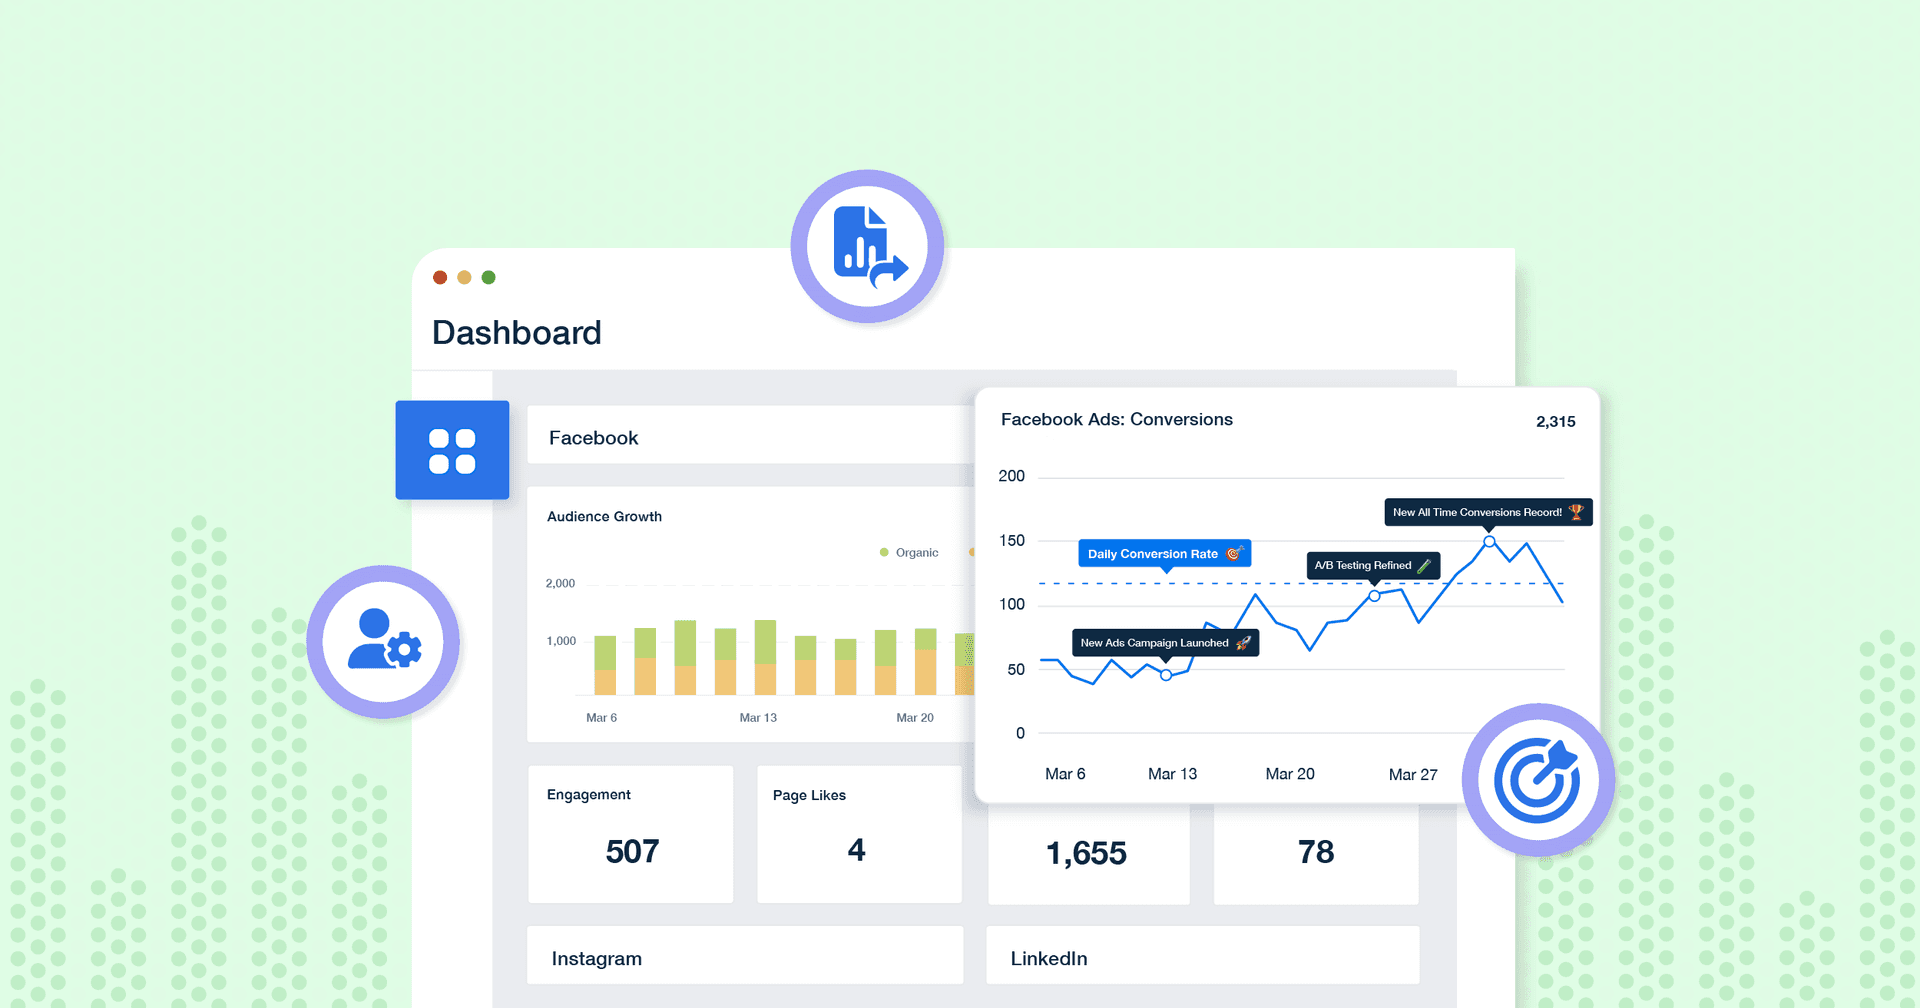
These dashboards are tailored to track social performance indicators across social media platforms. They consolidate metrics like engagement rates, follower growth, and content performance, helping in crafting and adjusting social media strategies.
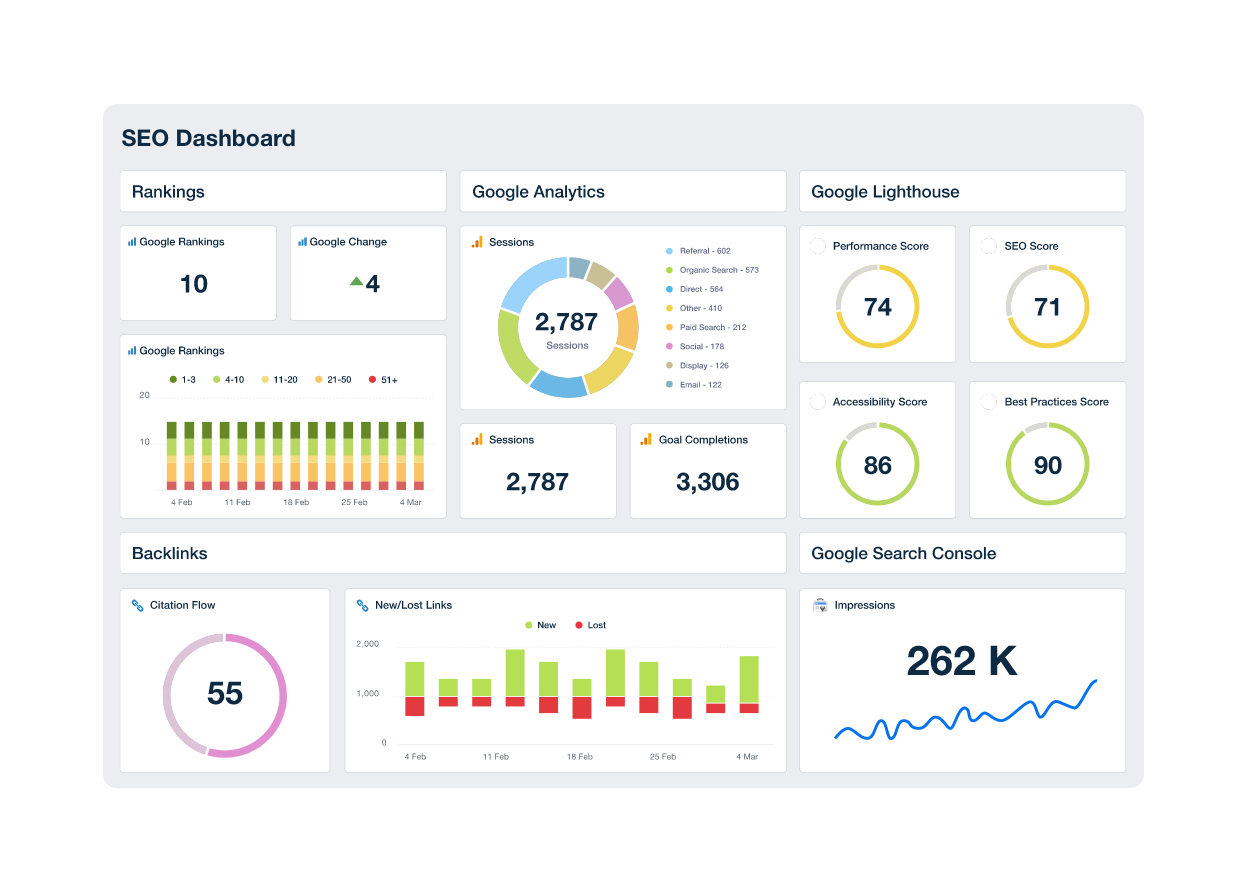
5. SEO dashboards
SEO reporting dashboards focus on SEO KPIs and organic search performance. They track keyword rankings, backlink profiles, organic traffic, and other SEO-related metrics, providing insights into the effectiveness of SEO strategies.
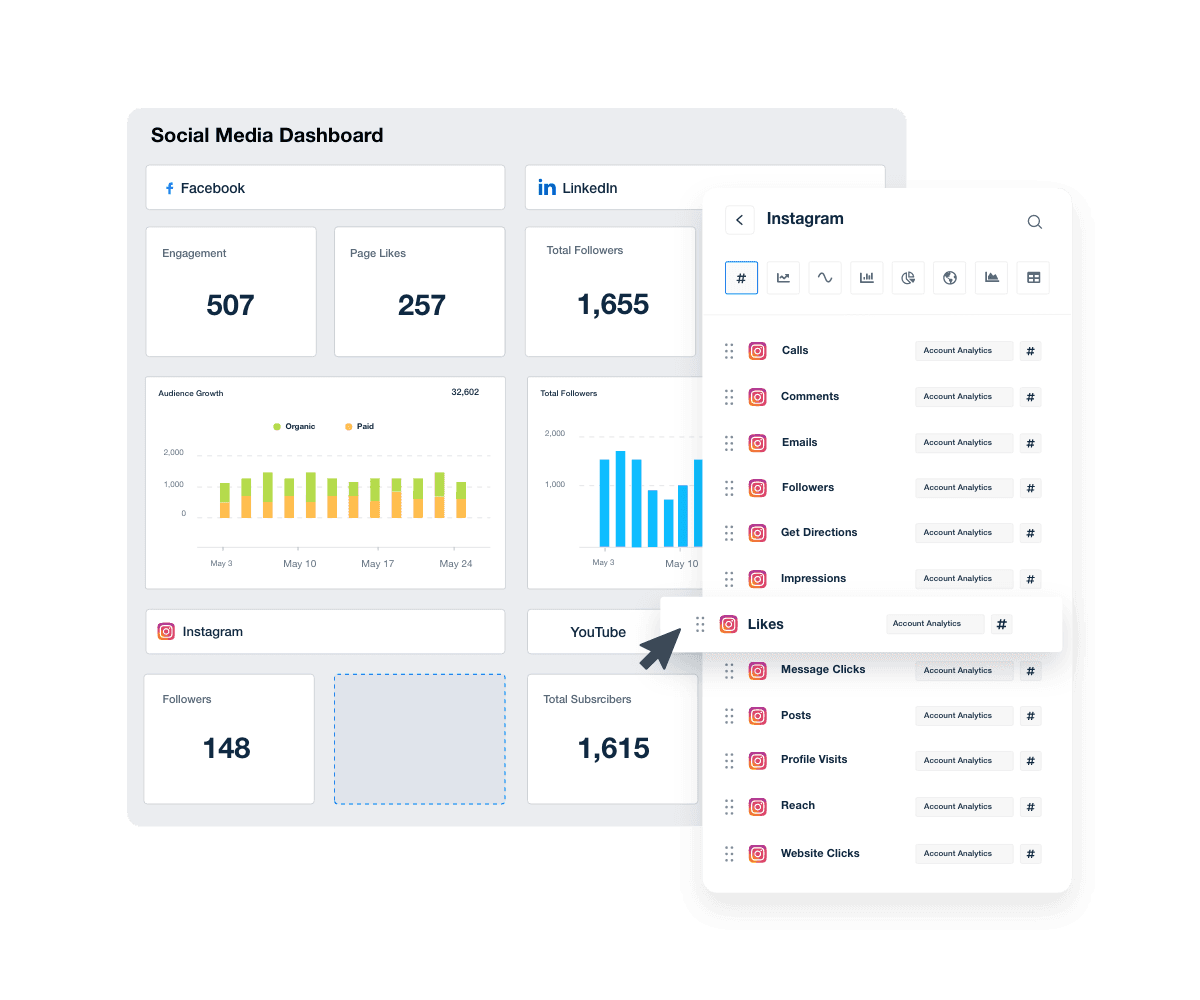
6. Content marketing dashboards
Content marketing dashboards monitor the performance of various content pieces, including blogs, videos, and social media posts. They track engagement, shares, and conversion metrics to gauge the impact of content marketing efforts.
7. Executive KPI summary dashboards
Executive KPI summary dashboards are designed for high-level stakeholders who need a consolidated view of the company’s overall performance. An executive KPI dashboard is a high-level performance monitoring tool tailored for executives, providing a comprehensive snapshot of key metrics to enable informed decision-making regarding the overall direction and health of the organization.
These dashboards distill complex data into key insights, focusing on metrics that directly impact business objectives and strategic decisions. They often include a blend of financial metrics, marketing performance, operational efficiency (if that's within your agency's scope), and customer engagement indicators.
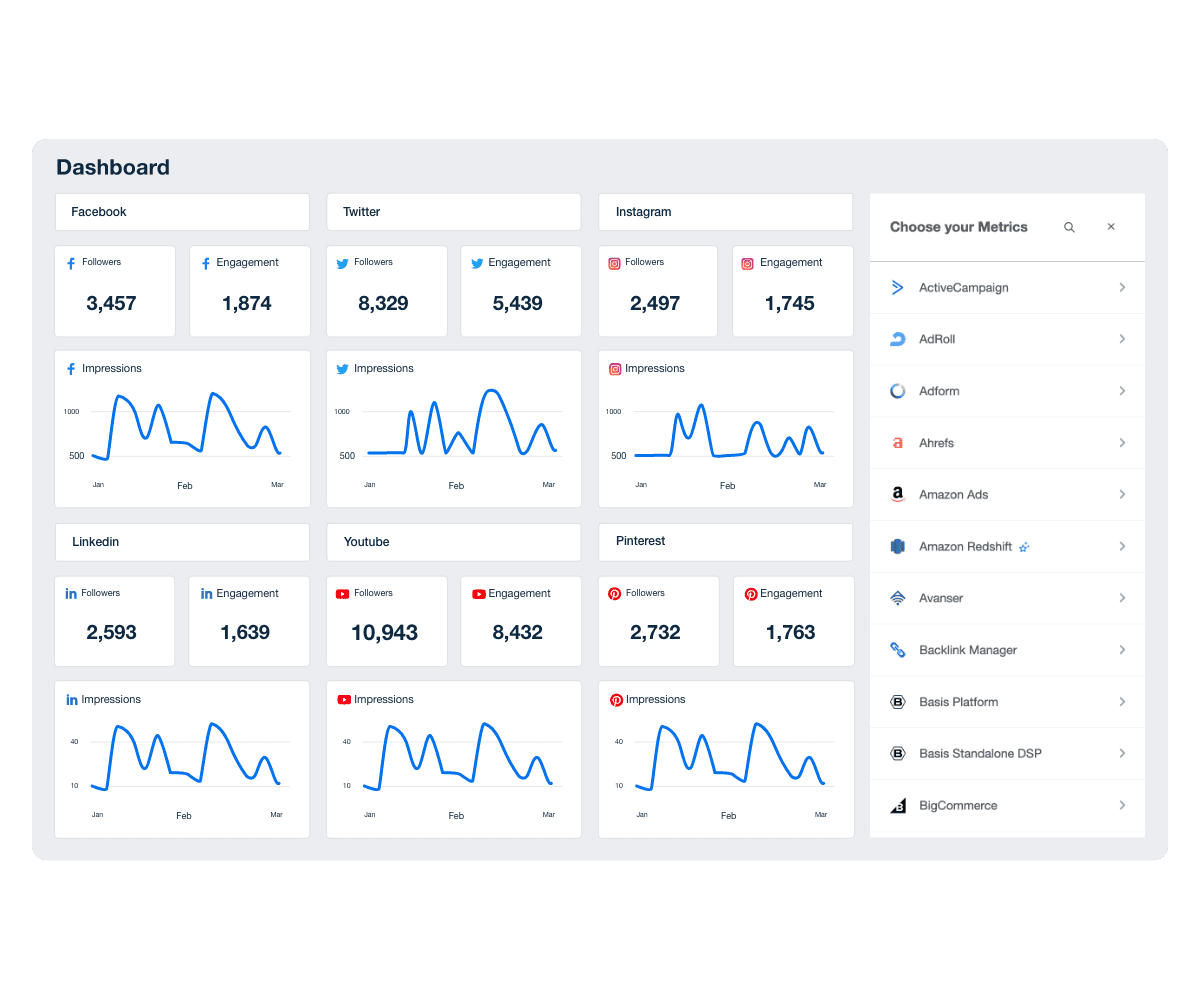
Other, often-used KPI dashboard examples include:
KPI Dashboards by integration with other digital marketing tools
KPI dashboards can be integrated with a range of digital marketing tools to provide a more holistic view of marketing efforts. For example:
Integration with CRM systems allows for tracking customer journeys and understanding interactions at each touchpoint.
Email marketing platforms feed data into these dashboards, offering insights into open rates, click-through rates, and campaign performance.
Integrating social media management tools provides a centralized view of social media engagement and effectiveness.
If you're looking for a quick way to build something impactful, simply generate a Smart dashboard that autopopulates with your client's unique metrics across multiple platforms. The best part? It takes just 11 seconds, and it's fully customizable too!
Tailoring dashboards for different business sizes and industries
Small businesses
For small businesses, dashboards need to be straightforward yet insightful. They often focus on key performance indicators that directly impact revenue and customer acquisition, such as lead generation metrics, website traffic, and basic social media engagement.
The dashboard template for small businesses is usually simpler, emphasizing easy-to-understand data visualizations and critical metrics that indicate business health. A KPI dashboard template serves as a pre-designed tool specifically tailored for small businesses to track and measure these key performance indicators effectively.
Large corporations
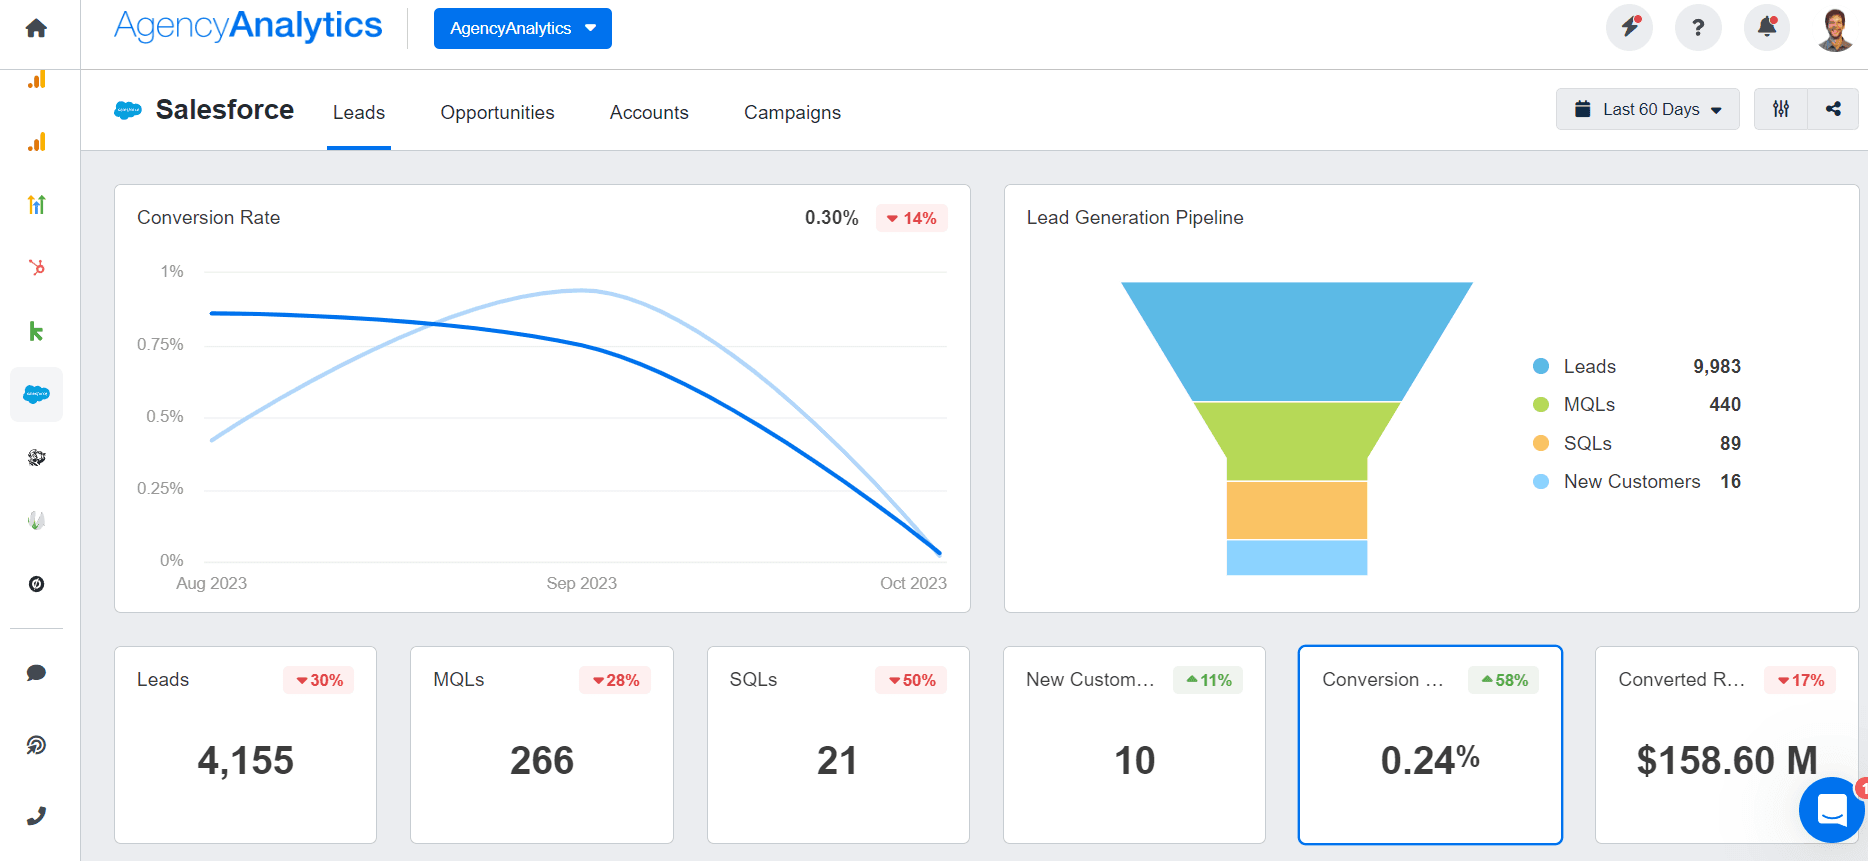
In contrast, large corporations require more complex dashboards that are able to handle a greater volume of data and more nuanced metrics. These dashboards often include advanced analytics dashboards and operational dashboards that integrate data from various departments and channels. They offer a more detailed analysis, such as market segmentation, customer lifetime value, and in-depth competitor analysis.
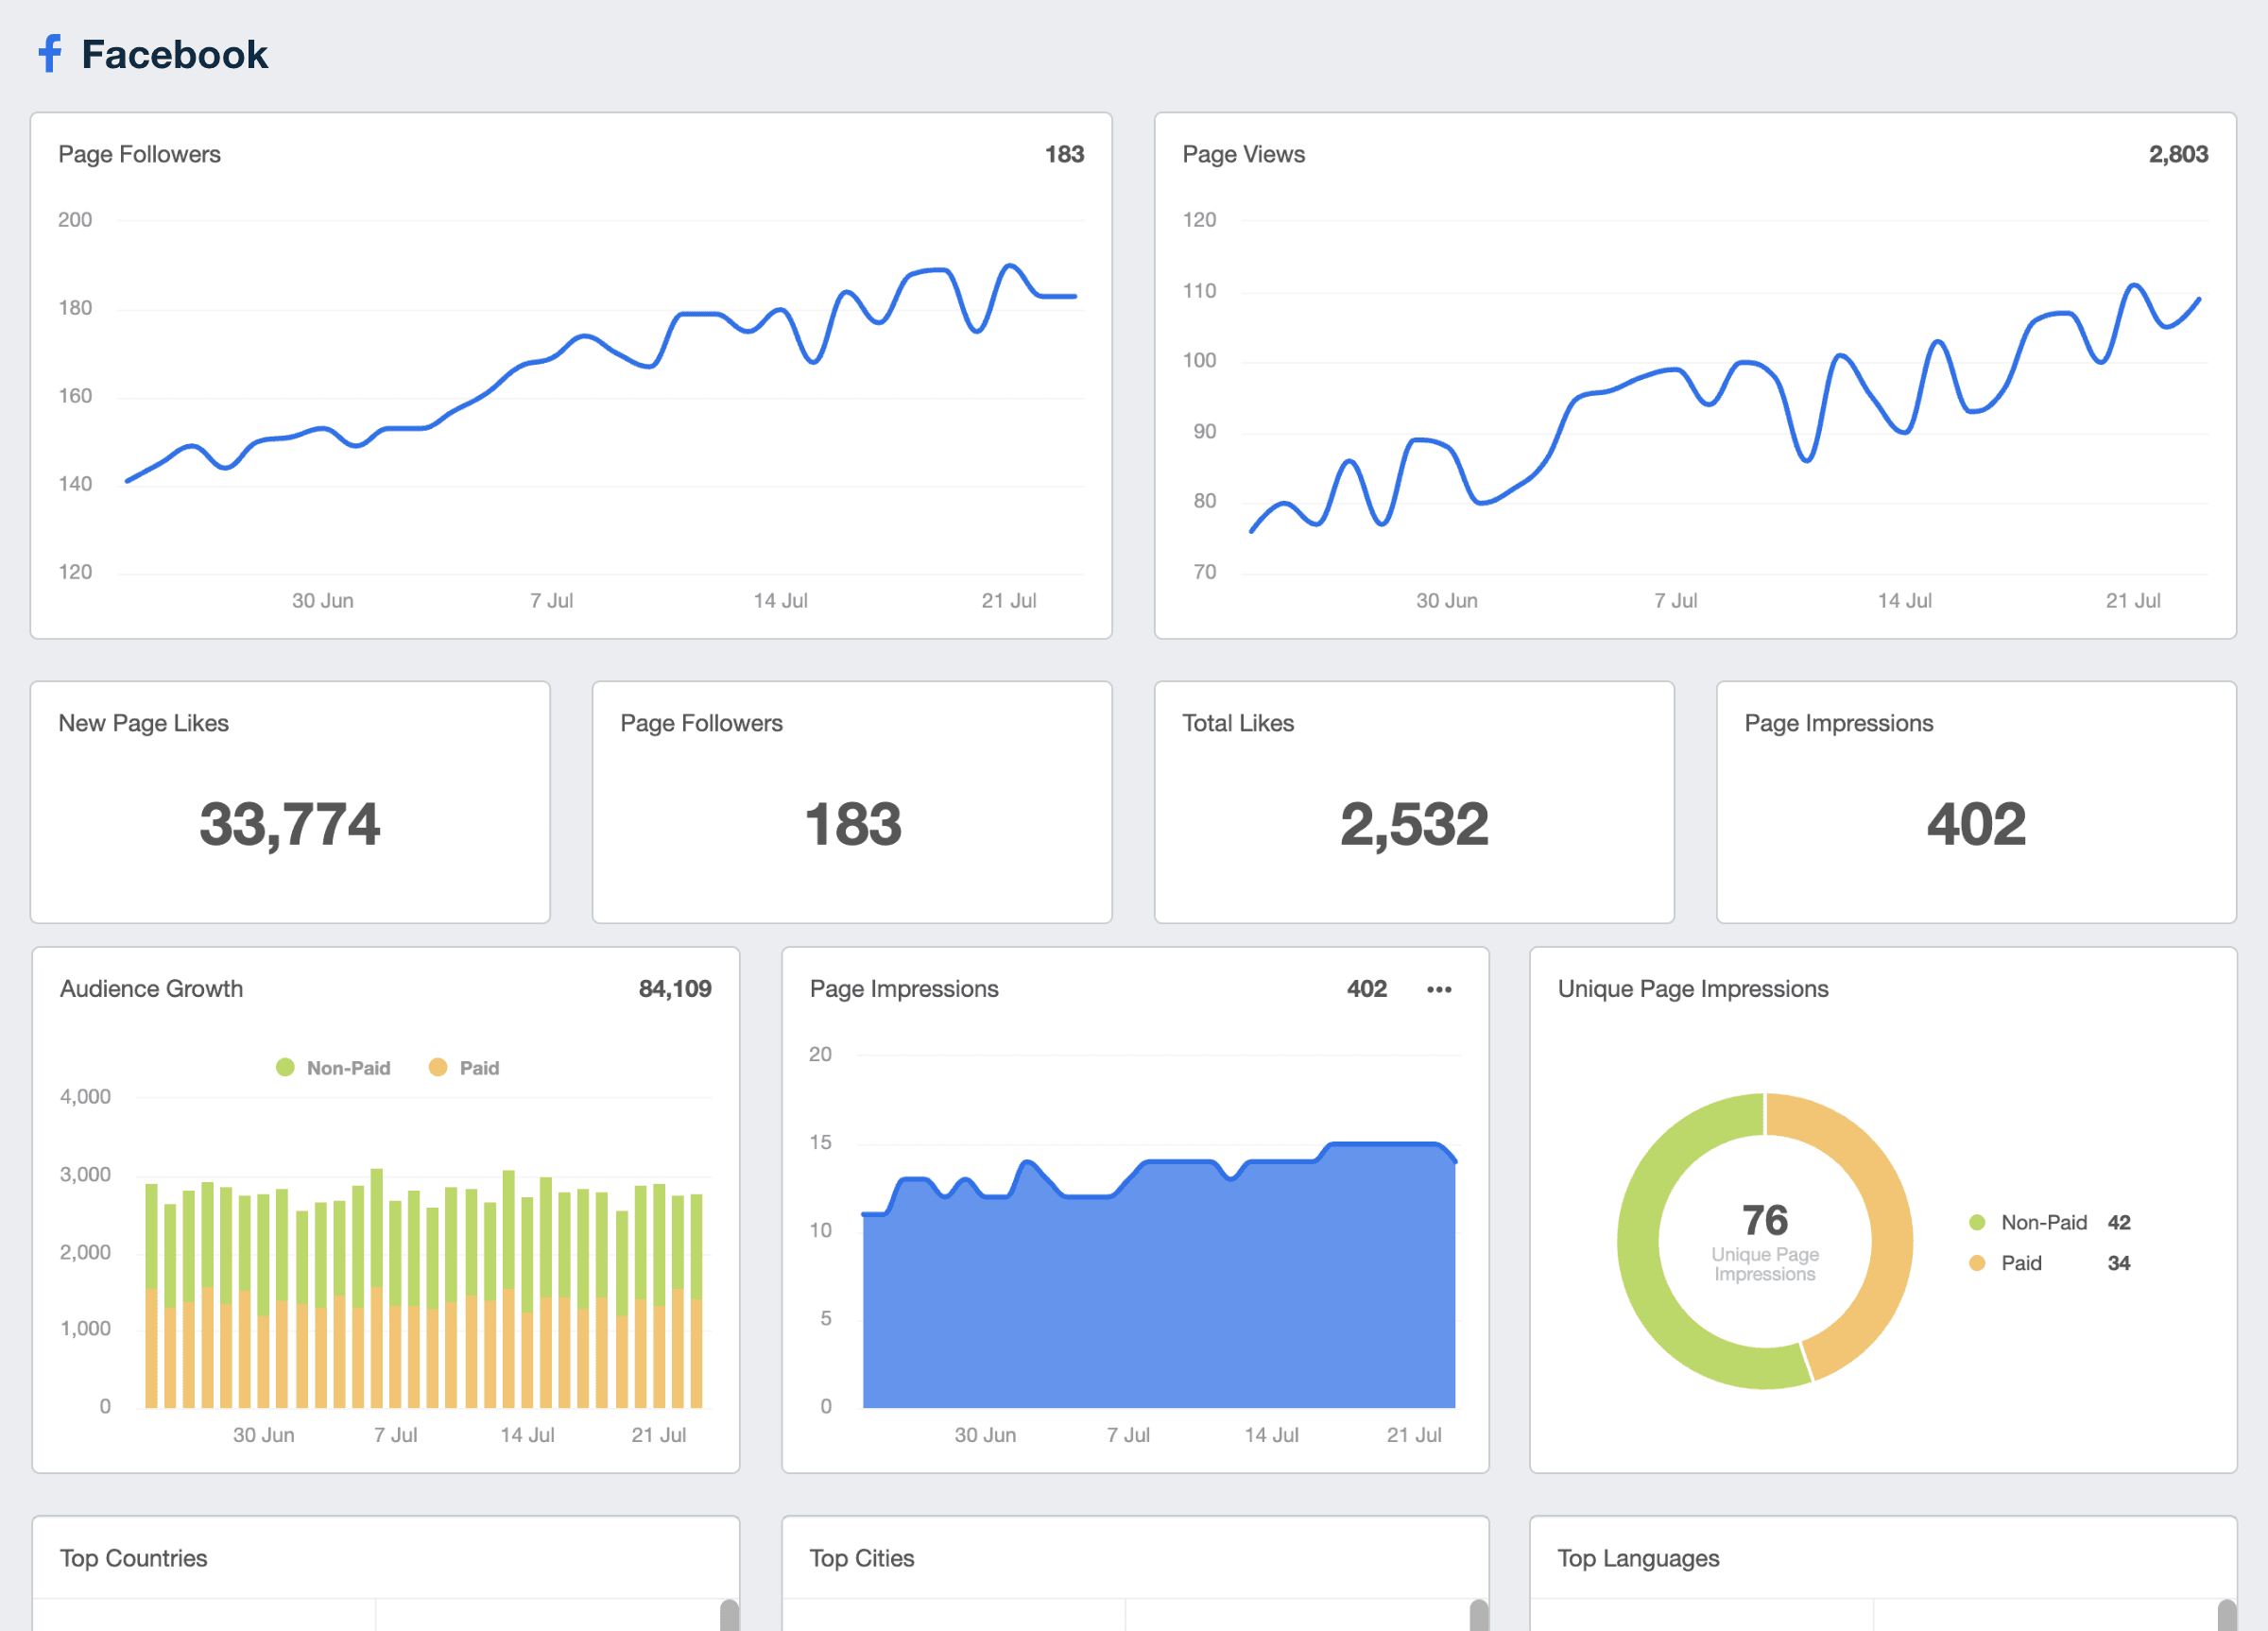
Showcase campaign performance using client-facing dashboard reporting software like AgencyAnalytics. With over 80 built-in integrations to choose from, the possibilities are endless! Sign up for a free 14-day trial today.
Industry-specific dashboards
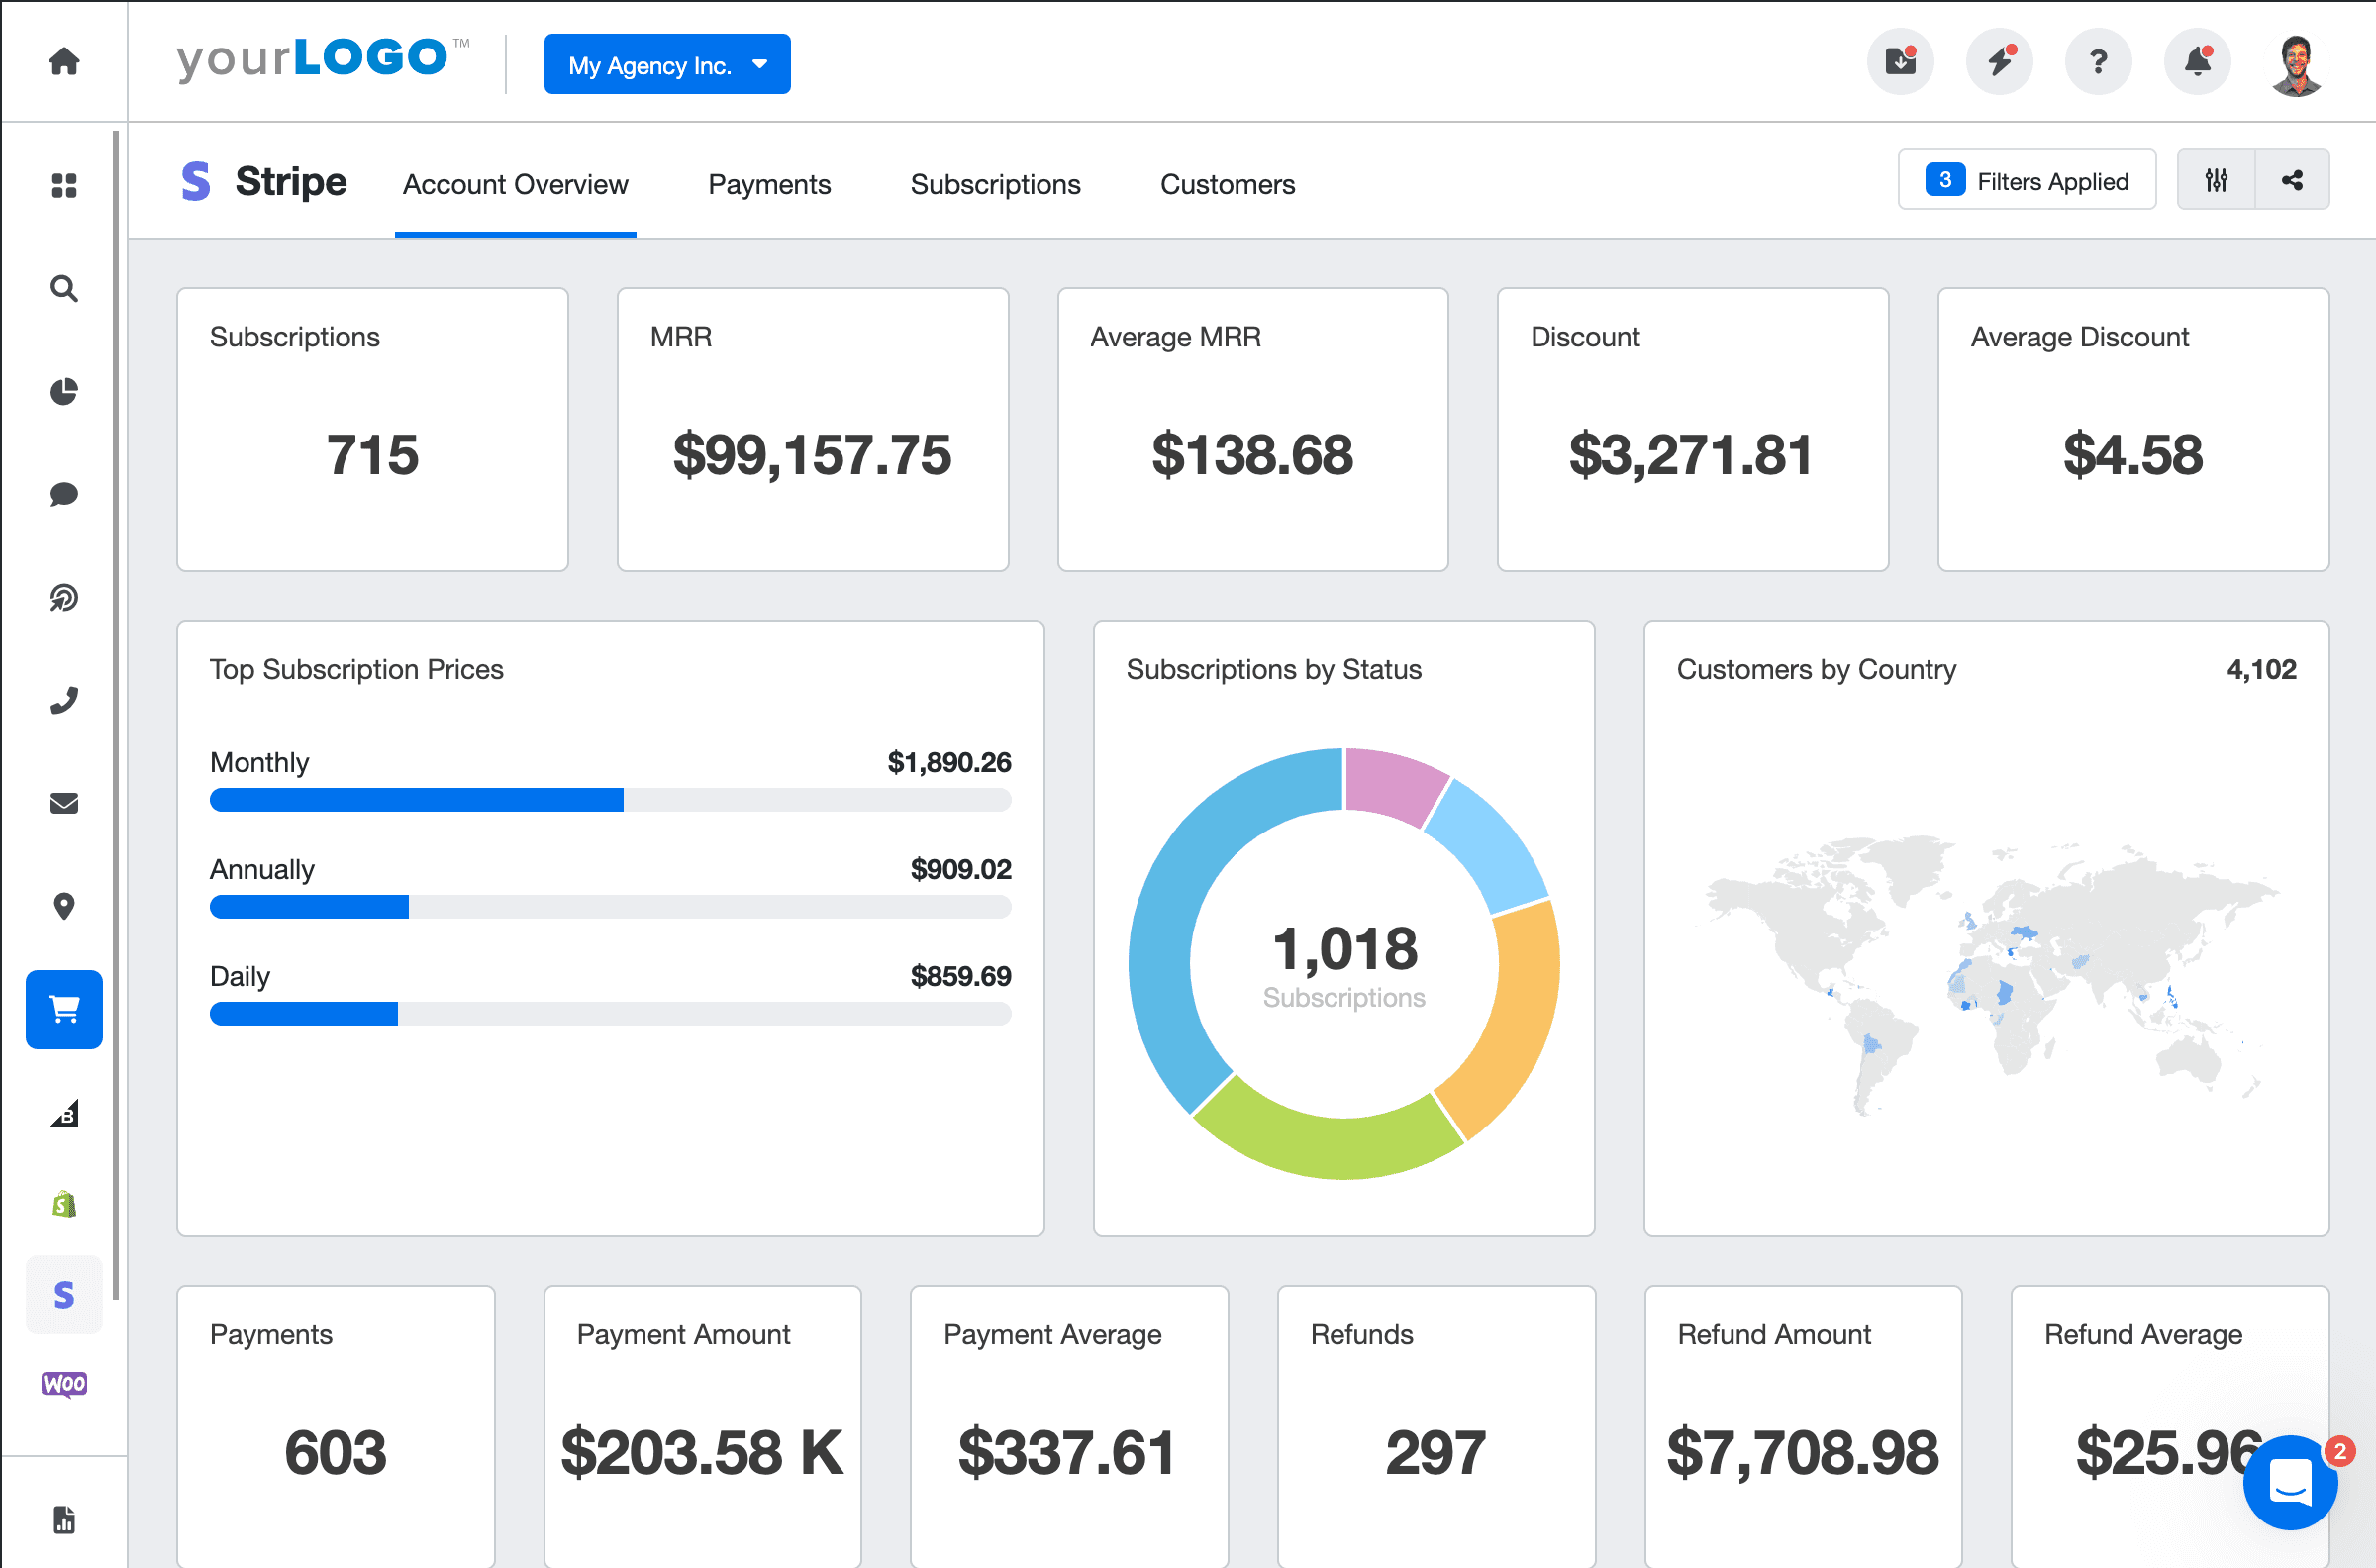
KPI dashboards should also be customized for specific industries. For instance, a dashboard for an eCommerce business would focus heavily on conversion rates, cart abandonment rates, and average order value. In contrast, a dashboard for a service-based industry might emphasize customer satisfaction metrics, service utilization rates, and renewal rates.
Utilizing historical data for strategic planning
KPI dashboards are not only about monitoring current performance but also about leveraging historical data for strategic planning. By analyzing past trends and performance, these dashboards help agencies predict future patterns and make informed decisions about where to allocate resources for maximum impact.
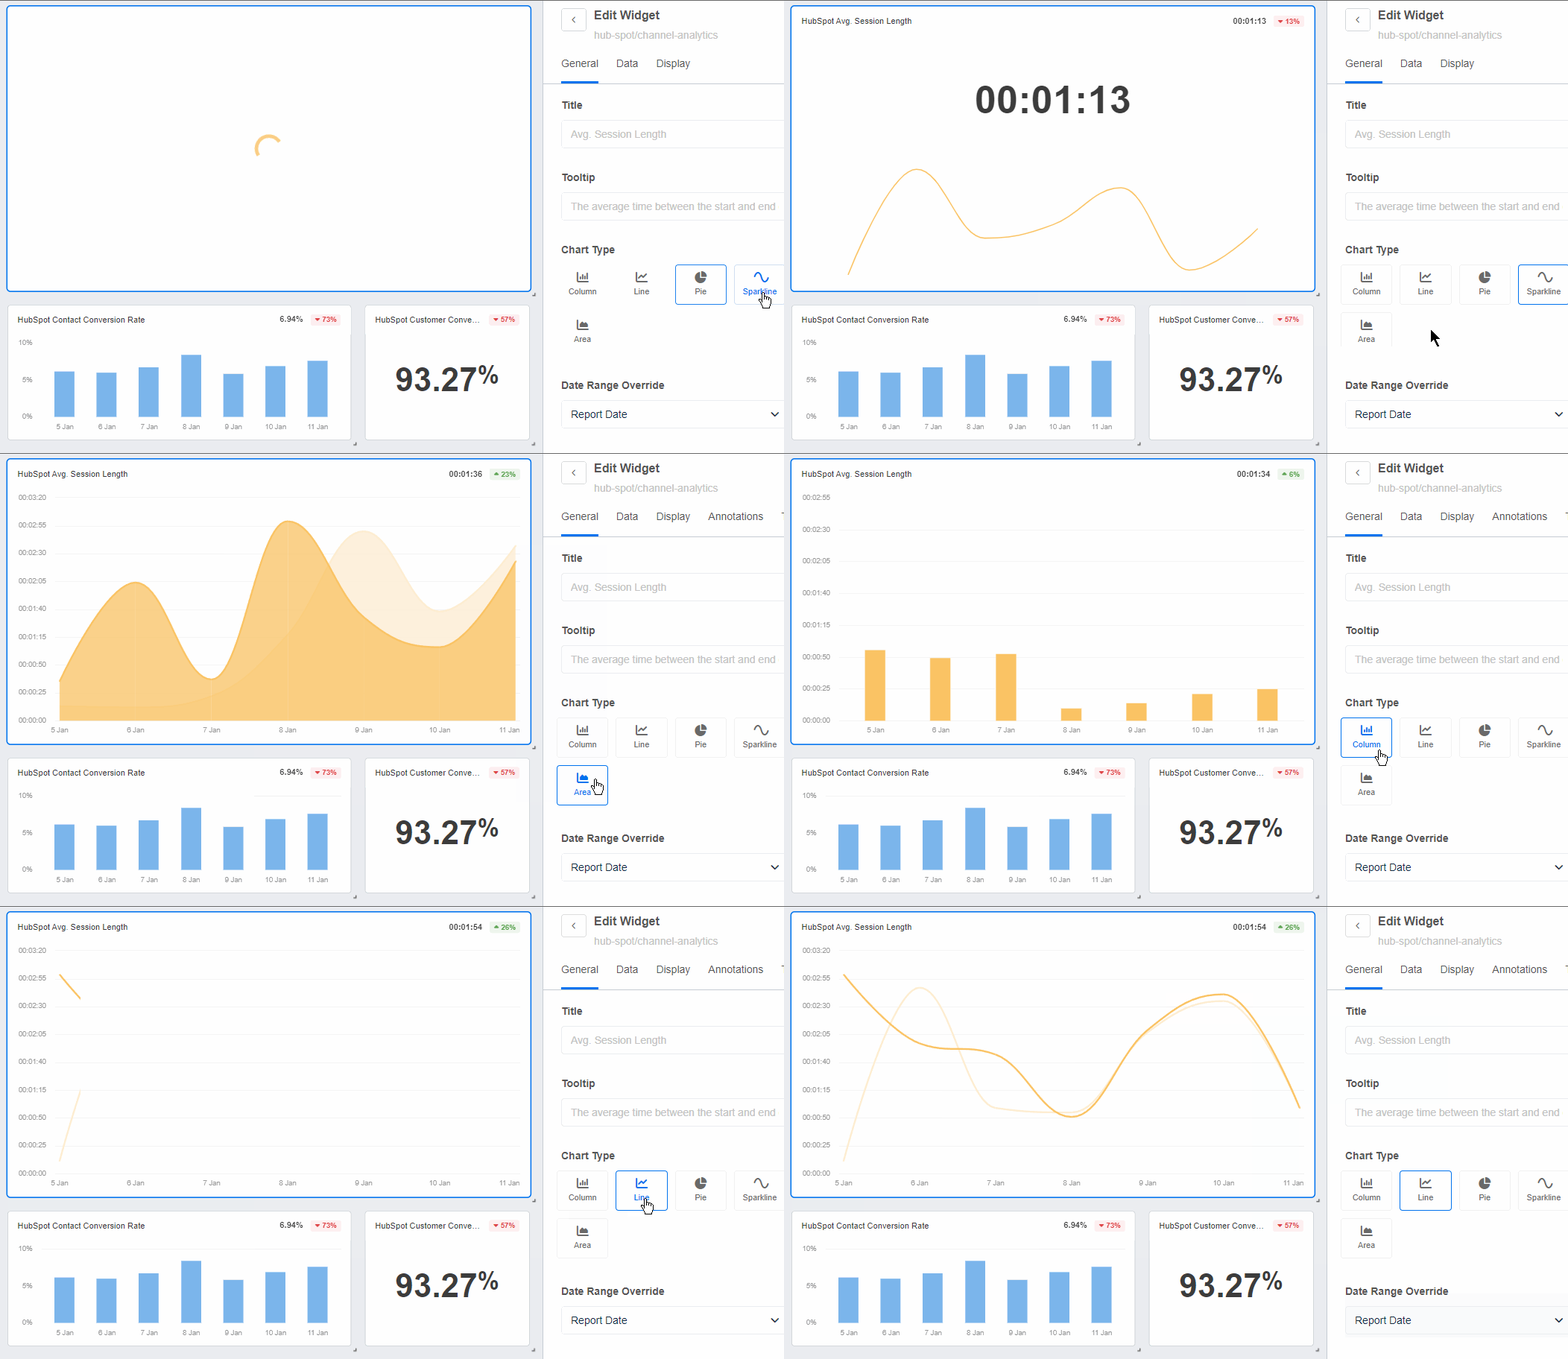
Whether it’s through analytics dashboards, operational dashboards, or channel-specific dashboards like PPC, SEO, and social media, these tools provide key performance indicators and data visualizations which make measuring progress and guiding decision-making easier and more intuitive.
Benefits of KPI dashboards
Tracking KPIs is essential for making strategic decisions and streamlining the management process.
Narrowing the focus of a KPI dashboard helps your clients understand what’s most important to them. This clearly shows how your marketing efforts are helping clients reach their goals. Monitoring KPIs related to client retention and lead conversion rates is critical for making strategic decisions and driving growth.
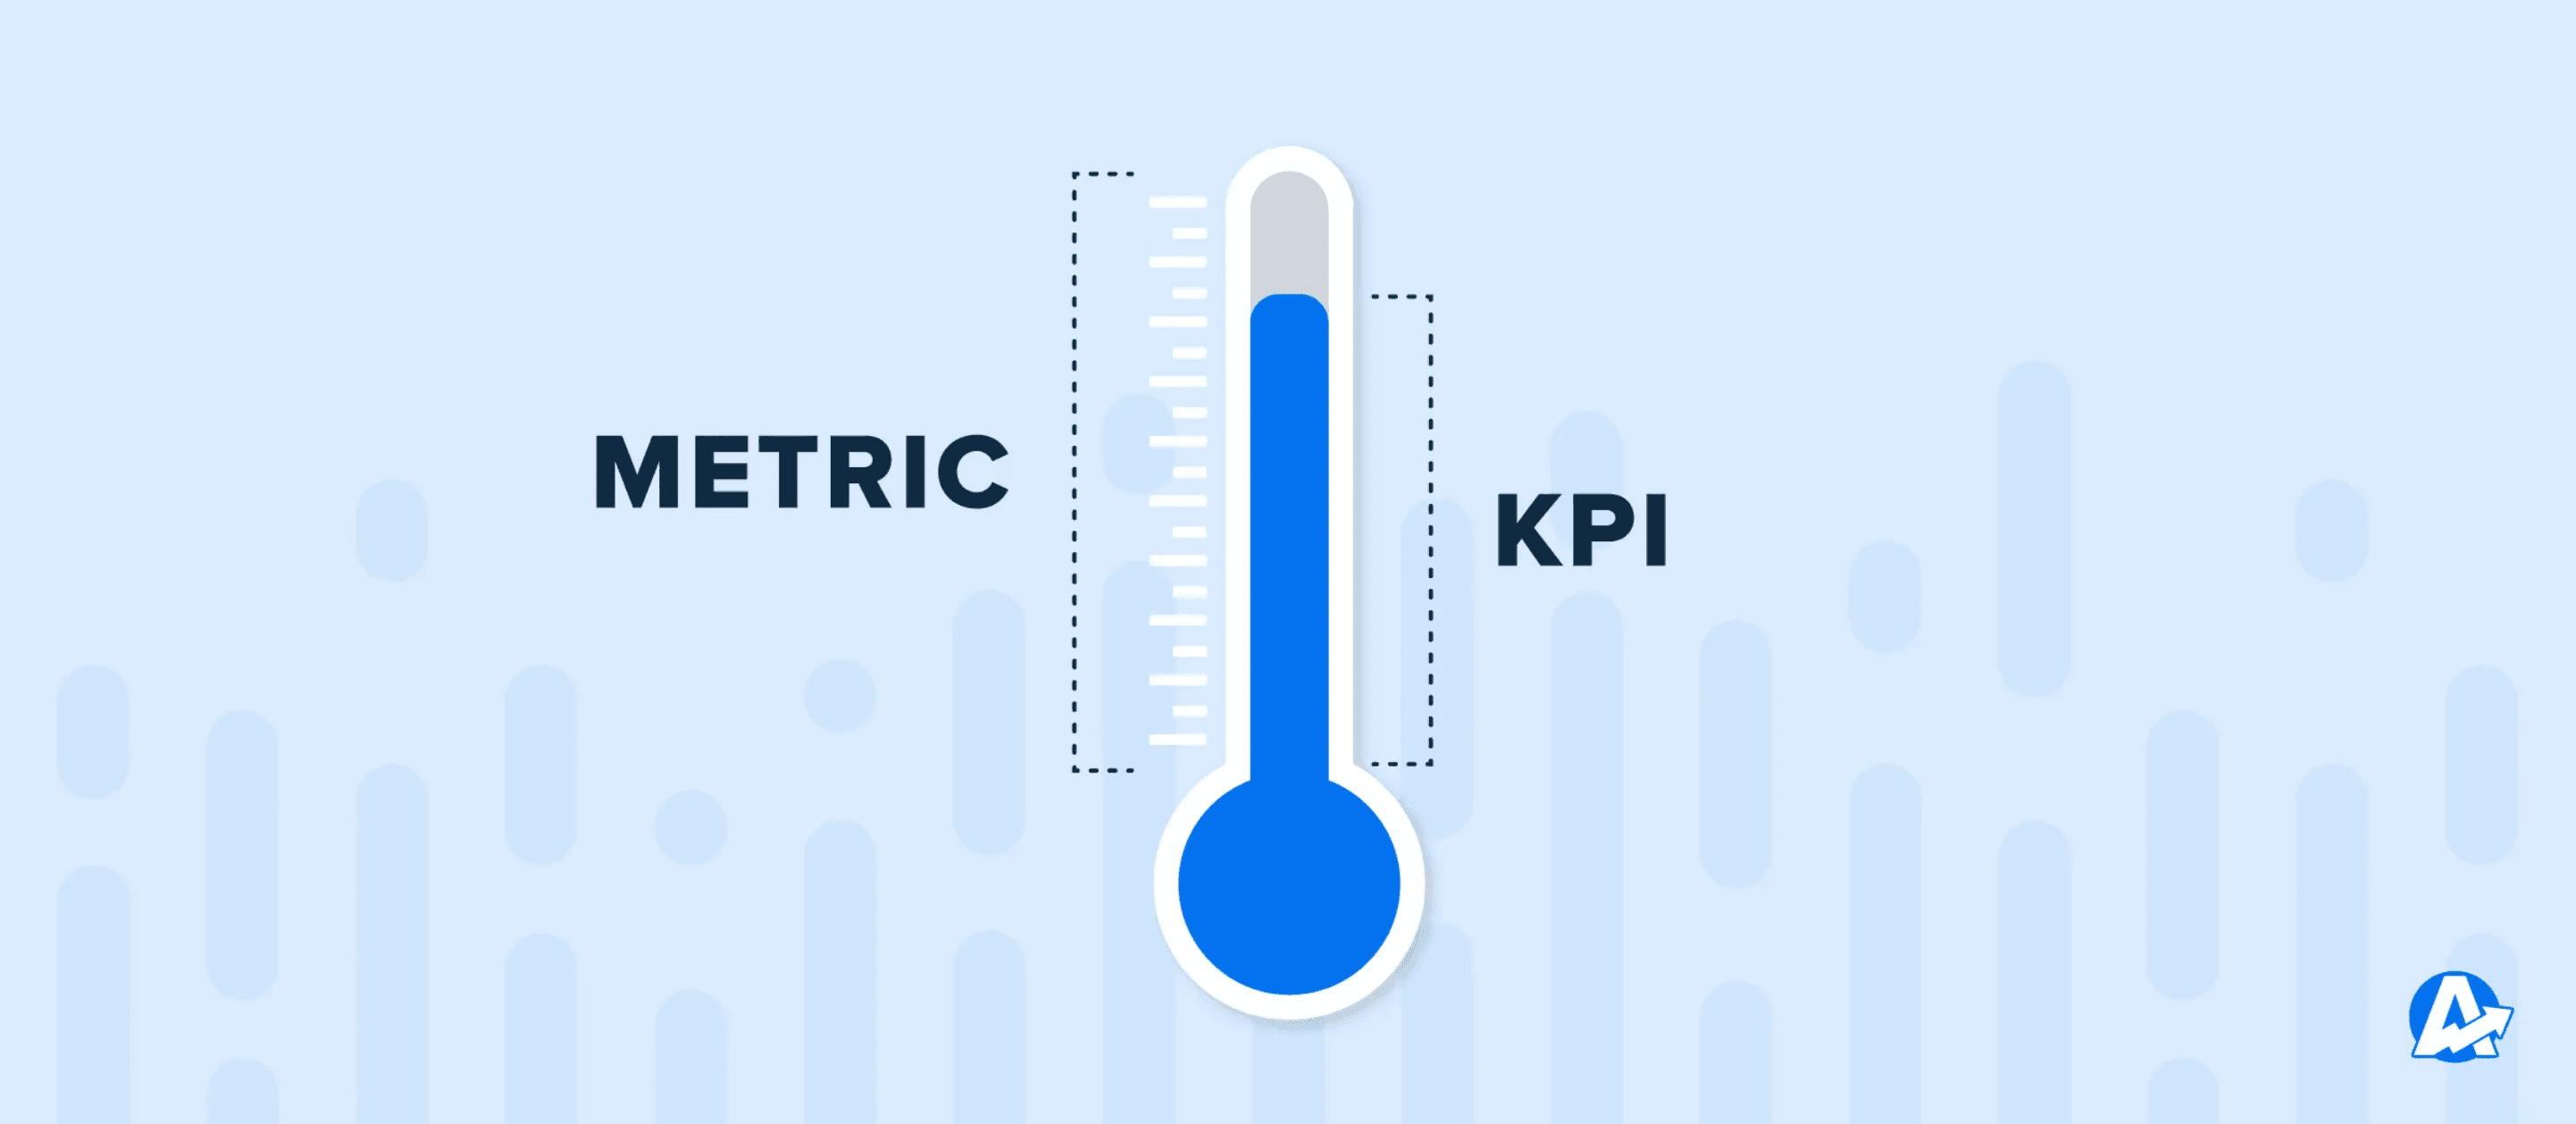
You want to show them enough data so that they feel fully informed without including distracting data points that just look good. Not sure what the difference is between KPIs and metrics? We explain this more in our blog post, KPIs vs. Metrics: What is the Difference?
The data your agency chooses to include will vary from client to client, but a general report could include KPIs related to website performance, organic/paid social media, email marketing, PPC campaigns, SEO, and lead generation.
It may be helpful to create a separate report for each of these areas, but that’s something to determine with your individual clients.
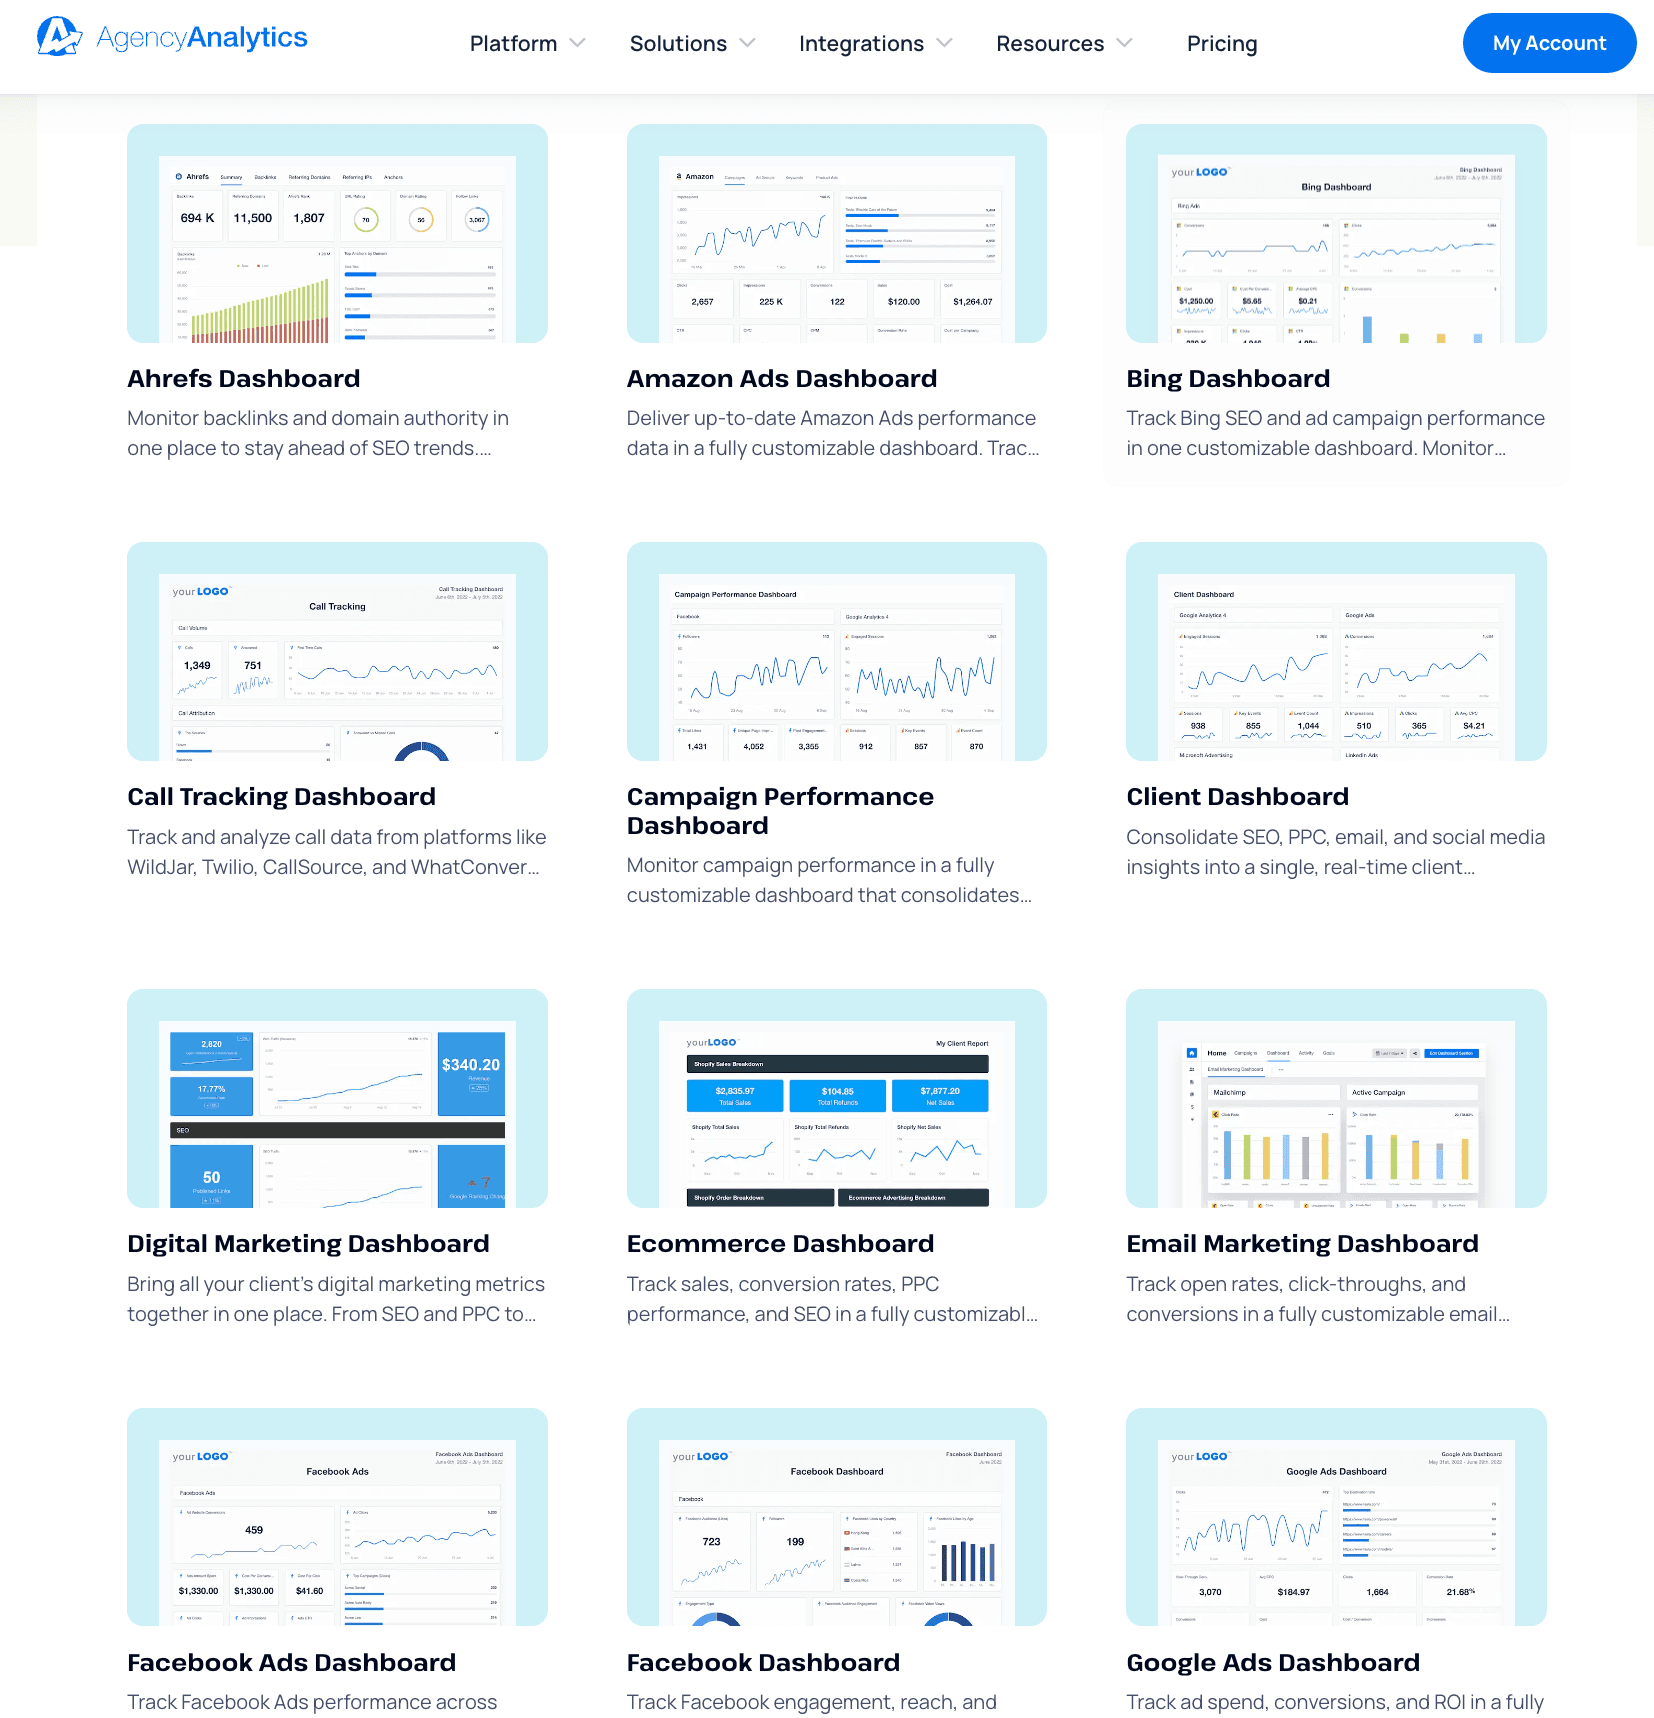
Real-time dashboards are great for those more savvy business owners or decision-makers who understand the need to look longitudinally at their marketing investment. The transparency always helps to strengthen long-term relationships.
Bodie Czeladka, Creative & Managing Director, Dilate Digital
Overall, KPI dashboards deliver many benefits that help build agency-client relationships:
Providing a snapshot of all the information clients need to assess the success of their campaigns.
Allowing agencies and their clients to focus on immediate problems, issues, or any relevant information in line with priorities.
Clearly communicating marketing objectives and allowing for transparent goal-progression, which in turn reduces churn.
Motivating employees to achieve specific goals and improve productivity.
Helping businesses assess their competitive position and identify areas where they need to improve.
Impact of KPI dashboards on decision-making processes
KPI dashboards are instrumental in guiding decision-making in business and marketing strategies. Their primary function is to transform complex data sets into coherent visualizations, aiding in a data-driven approach to business operations.
Role in data-driven decisions
The integration of KPI dashboards into decision-making processes shifts the focus from intuitive to data-driven strategies. A sales KPI dashboard serves as a tool for monitoring sales performance indicators, enabling sales managers and executives to analyze performance and anticipate any deficiencies for early detection and informed decision-making.
These dashboards display critical metrics that are essential to track, offering a tangible measure of progress toward organizational goals. This clarity enables decision-makers to base their strategies on solid data rather than assumptions.
Streamlining team collaboration
Dashboards provide a centralized platform for team members to access and analyze real-time data. This centralized approach ensures that all team members have a uniform understanding of the company's objectives and performance. By presenting data in a user-friendly format, dashboards allow team members to quickly identify areas requiring attention and adjust their strategies accordingly.
Informing strategic adjustments
KPIs dashboards play a starring role in identifying the effectiveness of various strategies. They provide real-time feedback on the performance of marketing campaigns and business initiatives. This immediate insight allows for swift adjustments, enhancing the efficiency and effectiveness of strategies.
Establishing and reinforcing best practices
KPI dashboards are valuable for recognizing and establishing best practices within an organization. They allow for a systematic analysis of past and current data, identifying successful strategies. This knowledge is critical in shaping future tactics and ensuring continuous improvement.
Predictive analysis for future planning
Beyond tracking KPI's current performance, dashboards offer predictive insights. They help in forecasting future trends, enabling businesses to anticipate market changes and adapt strategies proactively. This forward-looking capability is important for sustaining competitiveness and growth.
A KPI dashboard is about more than just tools for monitoring metrics; it is essential for informed, strategic decision-making. By providing comprehensive data analysis, dashboards enable businesses to make well-informed decisions, foster team alignment, facilitate strategic adjustments, establish best practices, and predict future trends.
How to create a KPI dashboard for efficient automation
Creating a KPI dashboard for your clients doesn’t need to be complicated or time-consuming. You want your clients’ dashboards to provide a high-level overview, so simplicity is key. And creating a KPI dashboard with client reporting software like AgencyAnalytics streamlines the entire process.
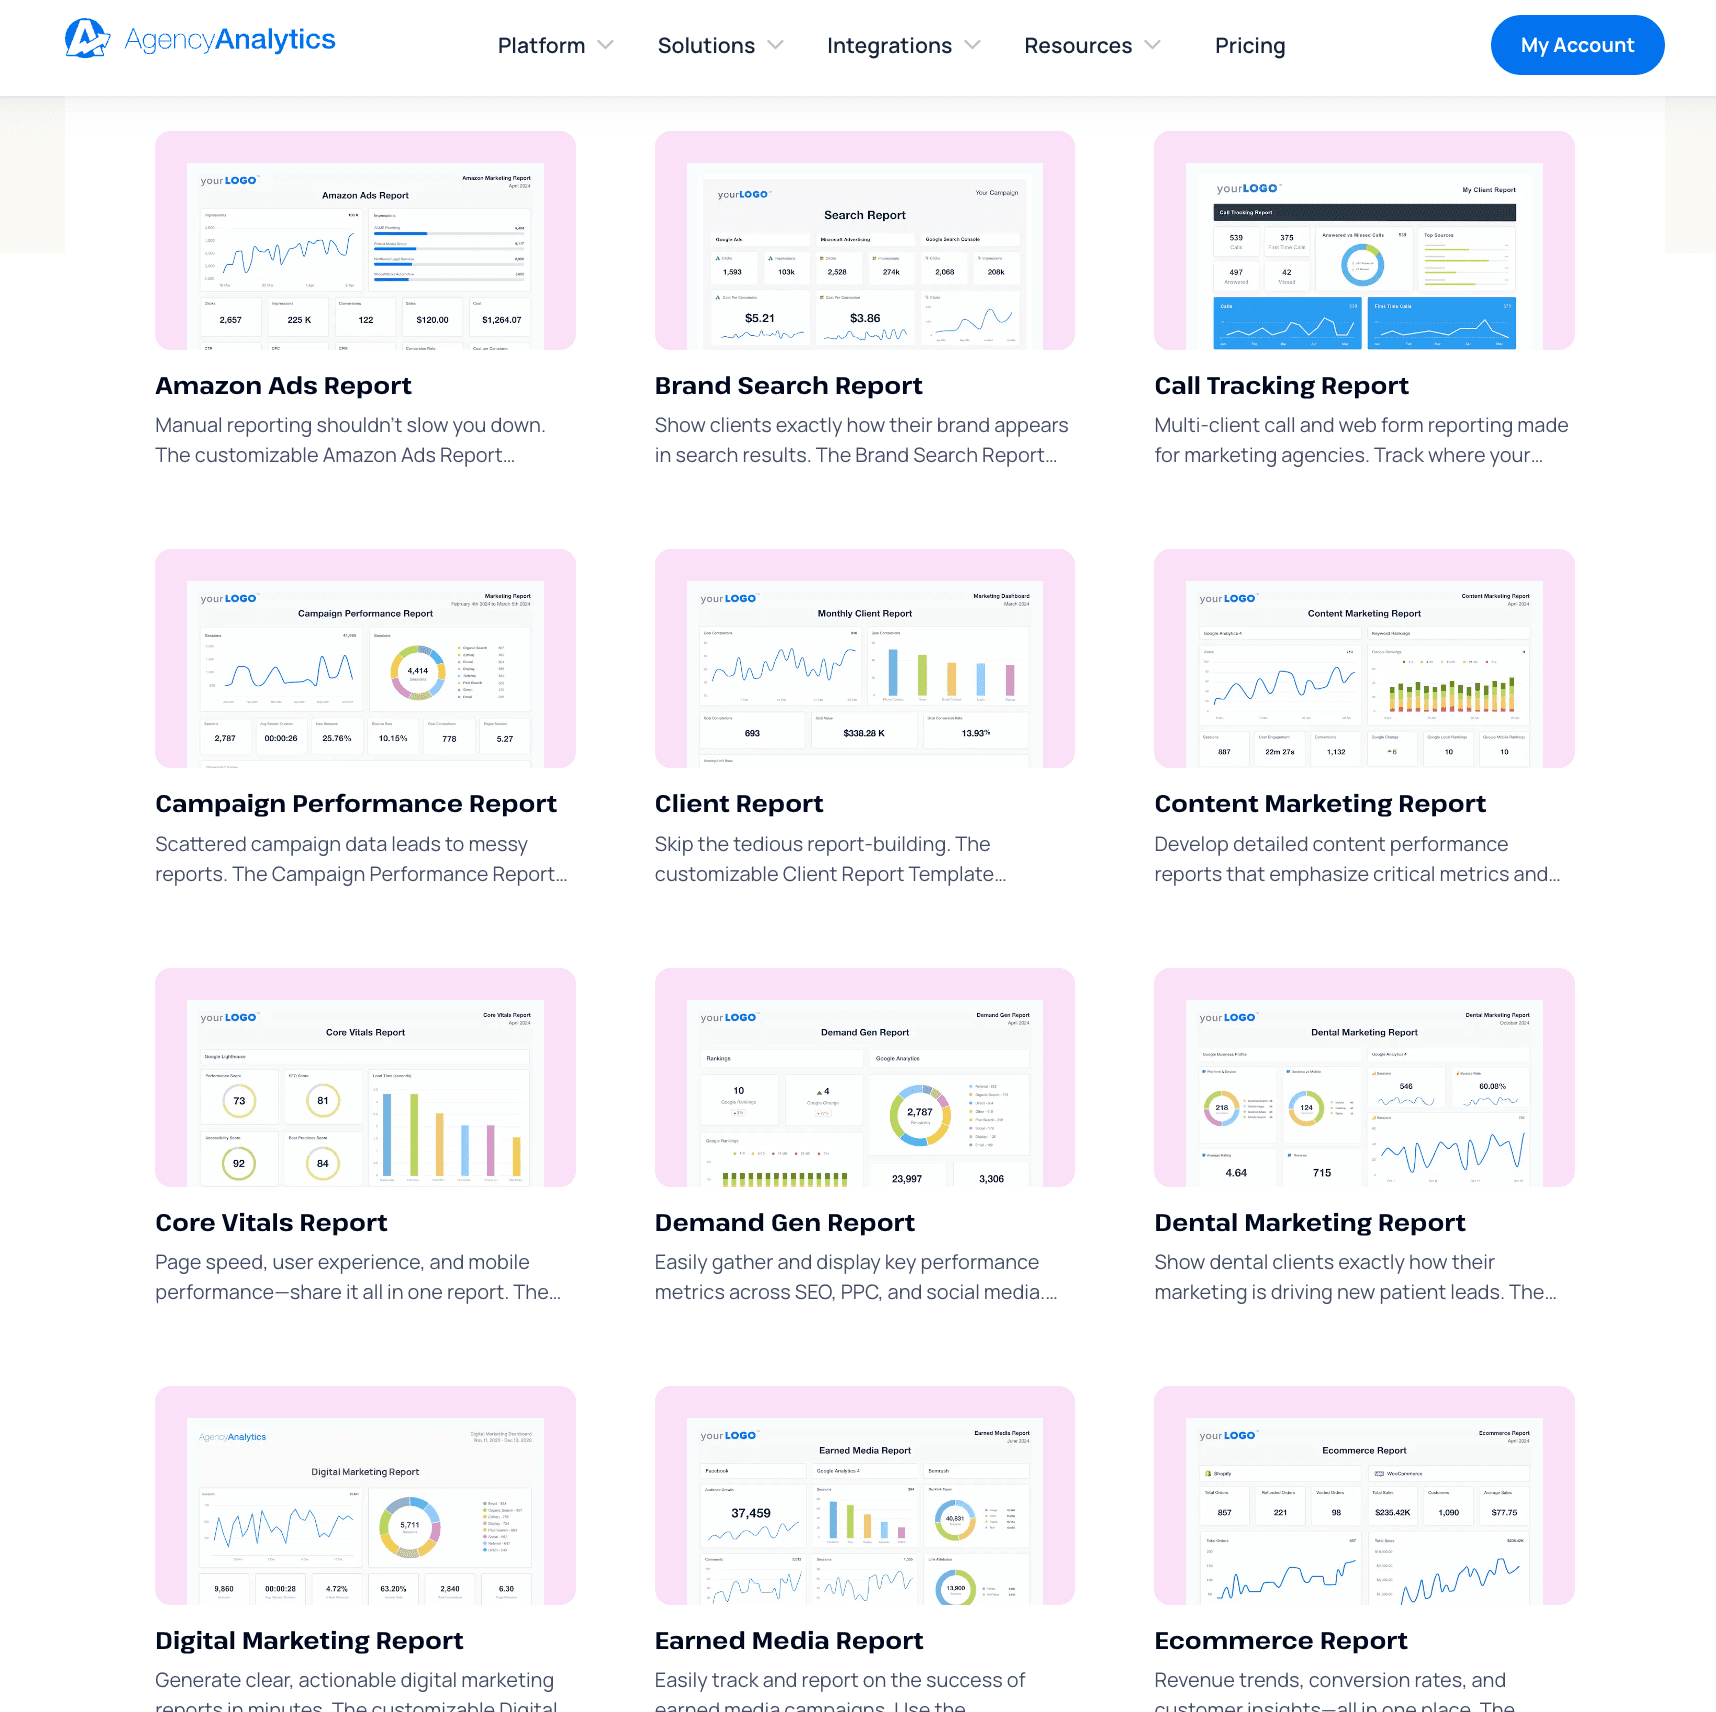
Choose from poplular marketing dashboards including the following KPI dashboard templates:
Here are some simple steps to follow when creating the best KPI dashboards for efficient automation and improved client satisfaction:
Step 1: Identify your clients’ most important objectives
You’ll want to discuss with your clients what KPIs are important to them. If your client is in an analyst role, business manager, or an executive, they might want to know if specific KPIs are being met and gather key takeaways. If your client is a salesperson with little technical or subject matter expertise, they might need a simplified display that provides key customer insights or shows sales figures over time.

Create goals to automatically track the progress toward your client's top KPIs. Try AgencyAnalytics free for 14 days.
Whatever your client’s role, it’s important to determine (and agree upon) the most appropriate KPIs in your marketing dashboard. Some common KPI examples that we’ve seen agencies use:
Channel analytics
Campaign performance
Sales and goals
Conversion rate
Revenue
Step 2: Make sure your reporting tool pulls all the KPIs your client needs
AgencyAnalytics has over 80 integrations (such as Google Analytics, Facebook Ads, Backlink Manager, Instagram, Spotify Ads, and more) to ensure you’ll find the platform your client uses.
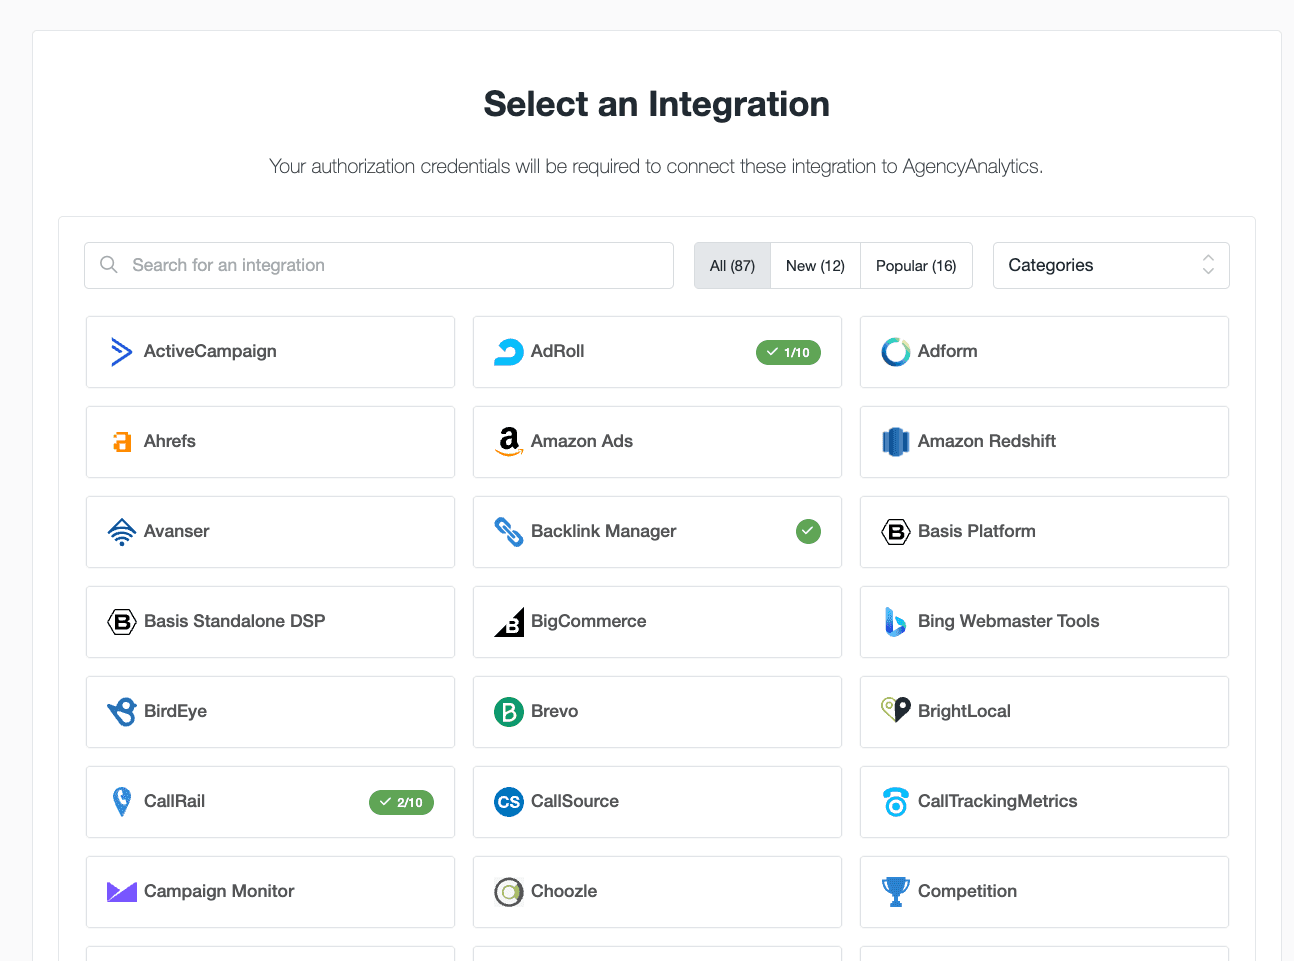
Quickly and easily connect the marketing platform integrations that matter most to your clients to create a customizable marketing KPI dashboard. The most popular integrations from AgencyAnalytics users include:
Step 3: Visualize the information
Explore and test out different charts and other ways to display data visually for your client’s dashboard. A map might work best to display social media followers in different parts of the world, a pie chart might work best for Google Analytics data, and a line chart helps visualize growth in the critical sales KPI. Give yourself time to play around or start with a pre-made dashboard template like our digital marketing dashboard template!
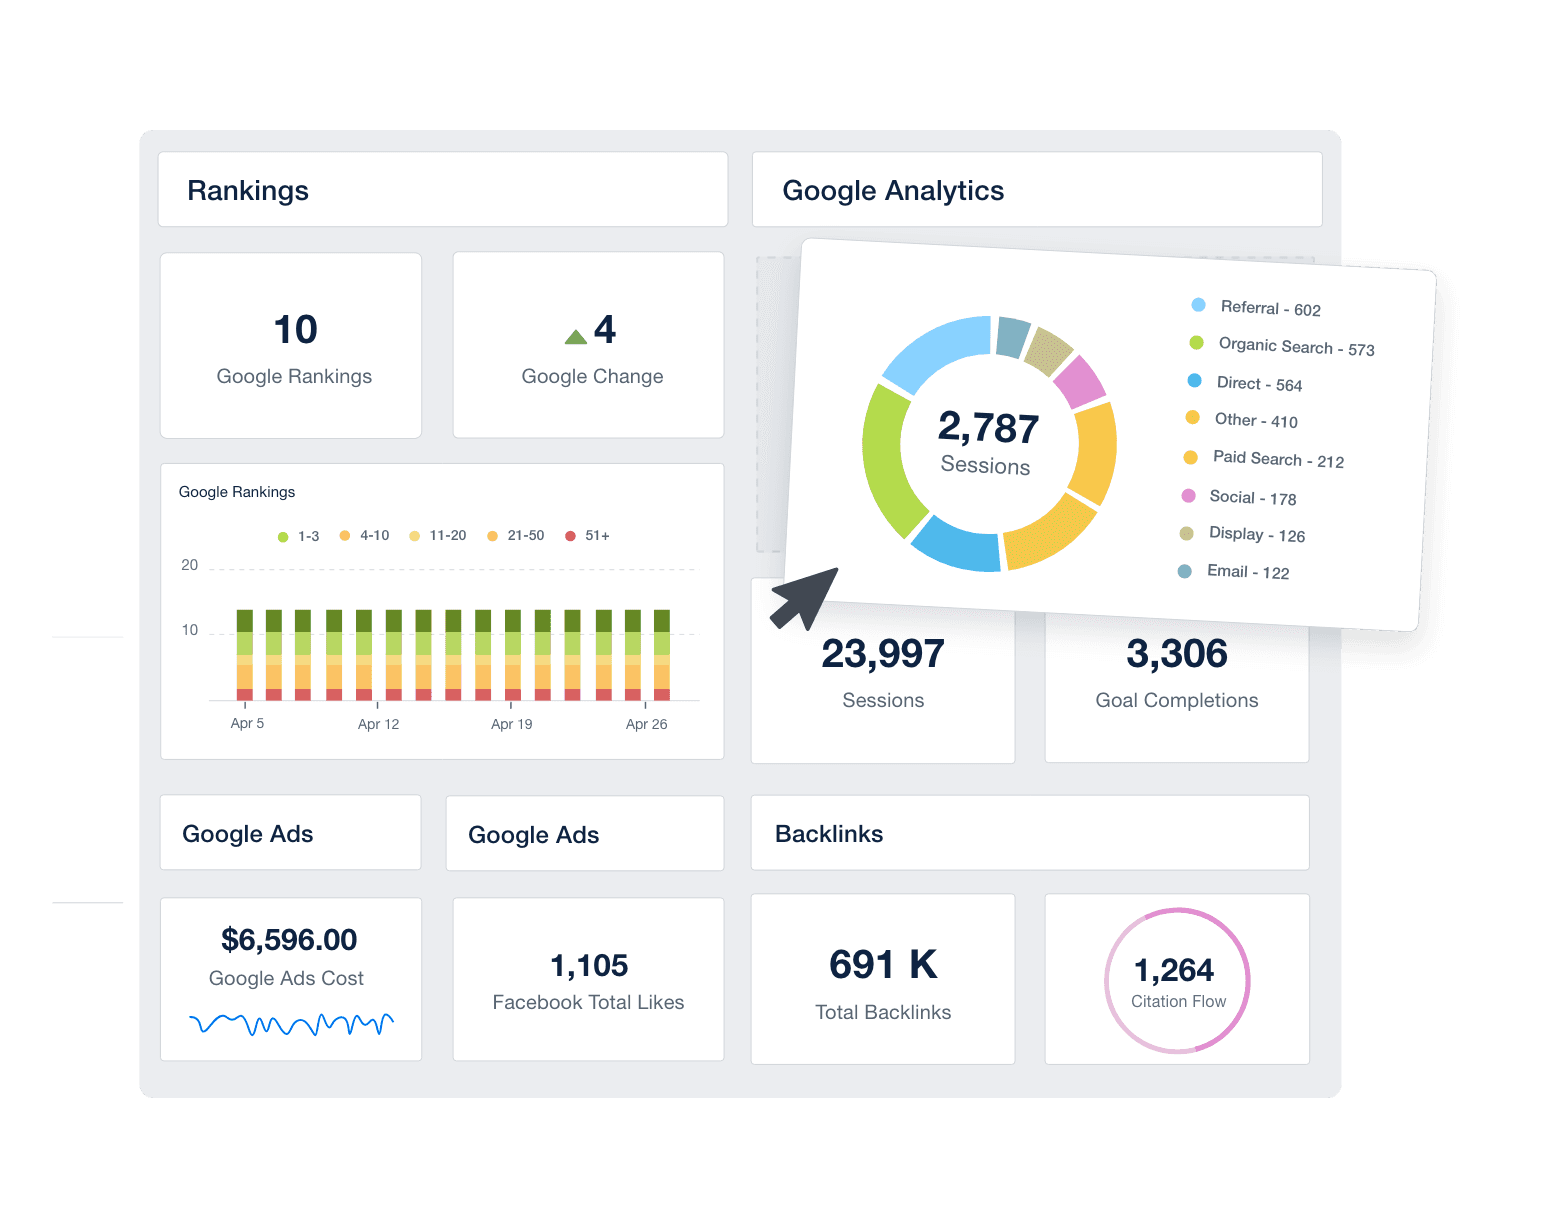
Step 4: Customize your agency’s KPI report
Starting with a KPI dashboard example is handy, but creating a report specifically catered to your client shows their data in a personalized way. It highlights that your agency cares about the reports you’re sending and delivers value by customizing their specific KPIs. Get started with a professional pre-built KPI report template.
Agency Tip: Organize your client’s dashboards with title headers that they can understand easily. And don’t forget to white label your client’s marketing dashboard with your agency’s logo for an additional personalized touch.
What to look for when choosing KPI dashboard software
Your agency will want to choose a dashboard software that integrates with the key services that you offer. There is a variety of KPI dashboard software out there, but they’re not all created equally. When deciding which one best fits your agency’s needs, consider the following:
Integrations
The ability to integrate with various platforms your clients use is critical. You don't want to be switching between platforms to get all of your client’s data into one place. AgencyAnalytics has 80+ to choose from to keep your reporting process streamlined. And that list keeps growing!
Understanding your clients
There’s really only so much data the brain can process at once, and it does so most effectively with images. This is why dashboards are the most effective way to communicate and present data to your clients. Set up a simple structure with clear visuals to represent the data. Keep in mind that the average person often remembers 5 to 9 pieces of information at any given time.
Customization
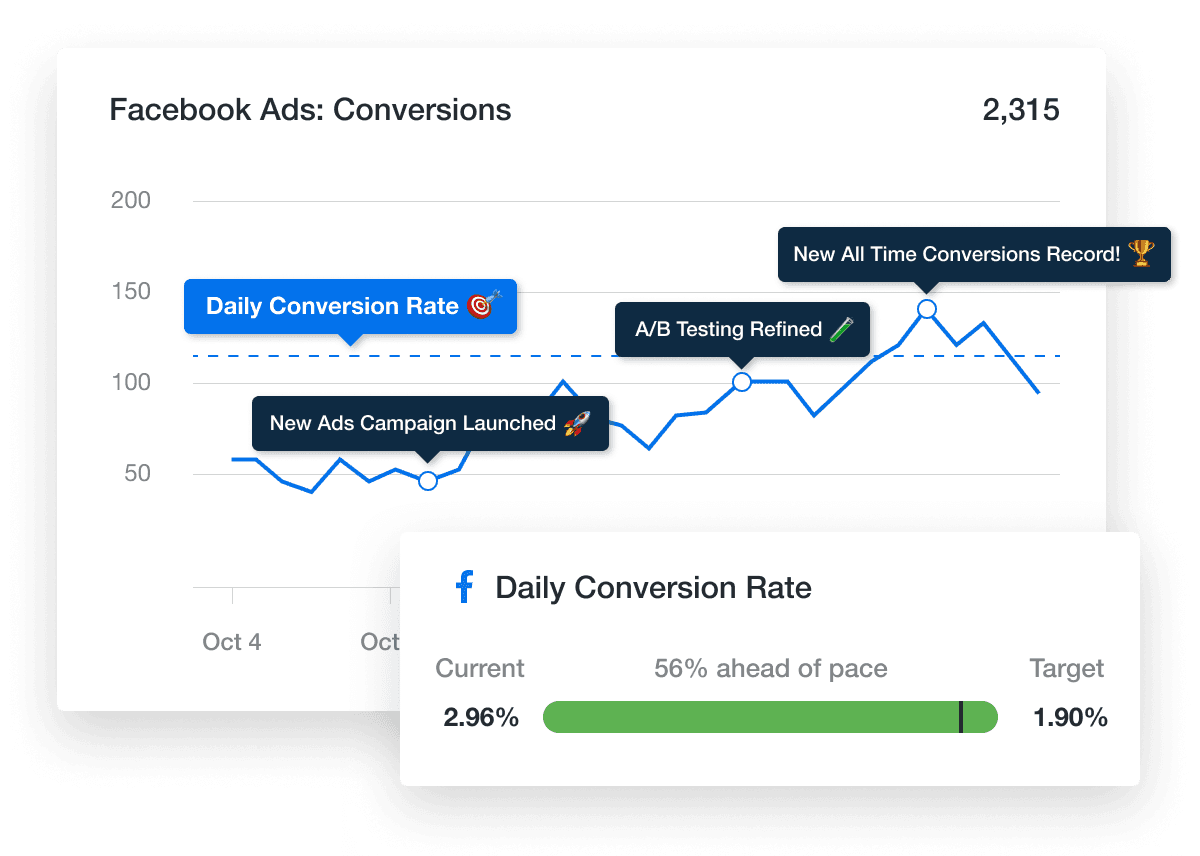
Not everyone reads data the same way. Your agency software must allow you to choose how to display information to your clients. AgencyAnalytics enables agencies to display the data in the most intuitive formats, including pie charts, area charts, gauge charts, and even maps.
Collaboration
Some dashboards limit the number of users who can access them or the number of people who are able to work on them simultaneously. Depending on your agency’s needs, check whether the software enables multiple users to work together or if you’ll have the ability to share the data with external users.
User experience
The user experience (UX) is important when considering what software to use. You want your agency’s KPI data to be displayed as clearly as possible, but also have the ability to explain what the data means. Your KPI dashboard should give you the ability to label or include descriptions.
Real-time data
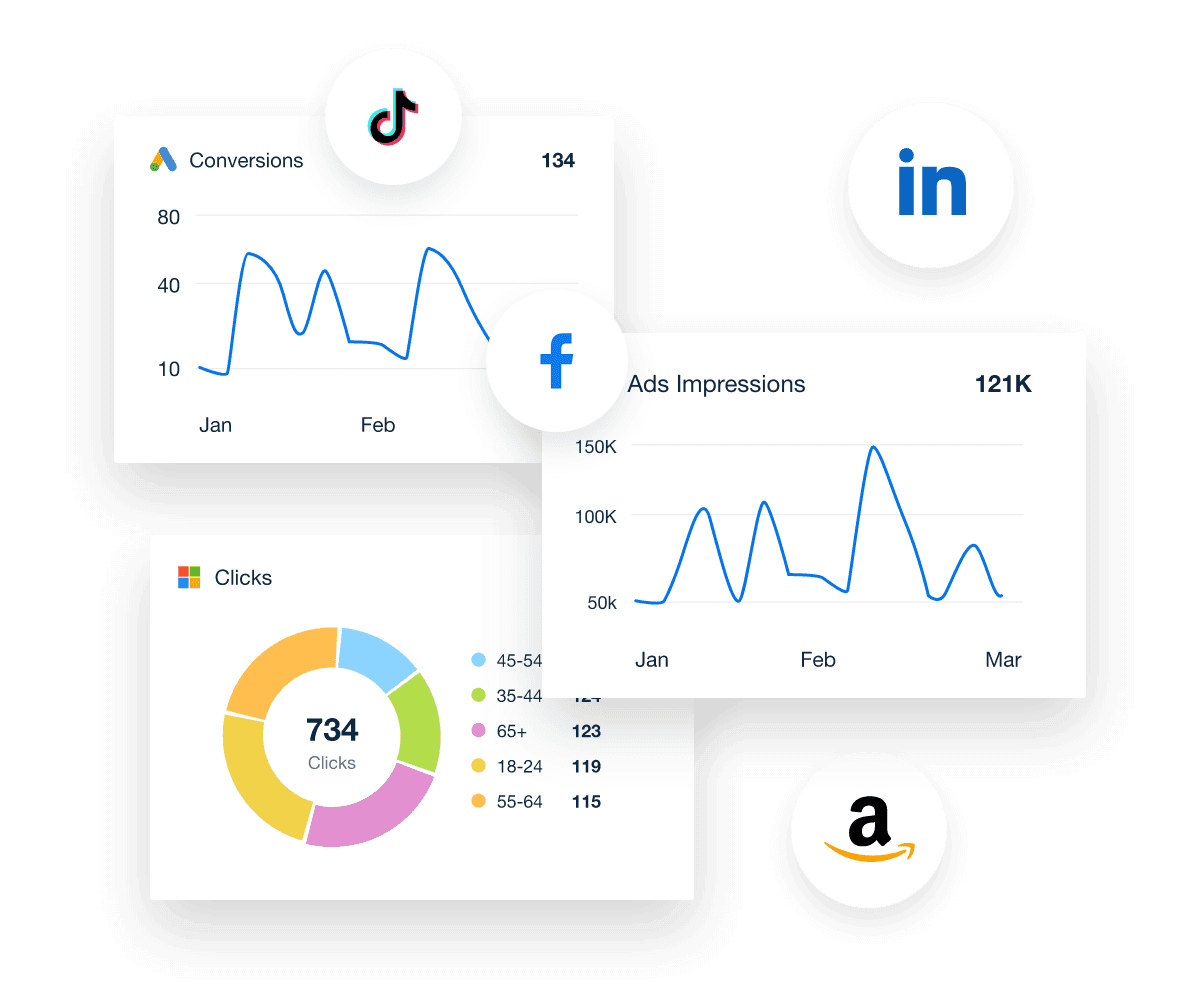
Streamline your reporting with real-time data. No more manual updates and long waiting periods to collect your agency’s data. Create operational KPI dashboards that provide real-time data that your clients can use whenever they want. For example, Monday morning meetings become much more efficient with an operational KPI dashboard in hand.
Automated client reporting
Waiting a long time to compile all of your agency’s data is tedious and extremely time-consuming. Therefore, you’ll want to look for software that automatically gauges daily, weekly, or monthly pictures of your clients’ key performance indicators and puts them together in an easy-to-understand KPI dashboard. This automated process empowers you to quickly identify noteworthy patterns and deliver valuable insights.
New and improved integrations
It’s important to stay ahead of the curve. Choose a KPI dashboard software that values improvement and constantly updates its integrations. When your client joins new, emerging marketing platforms, your agency should be able to provide the reports they need.
Why should you automate your KPI reports?
Gathering your client’s marketing metrics from various marketing channels quickly becomes time-consuming and repetitive. The biggest benefit of sending automated reports? Saving TIME.
Easily collect your client’s important KPIs in one place and have them updated automatically with custom dashboards and reports from AgencyAnalytics. An automated reporting system lets your agency focus on scaling rather than frequently creating tedious client reports.
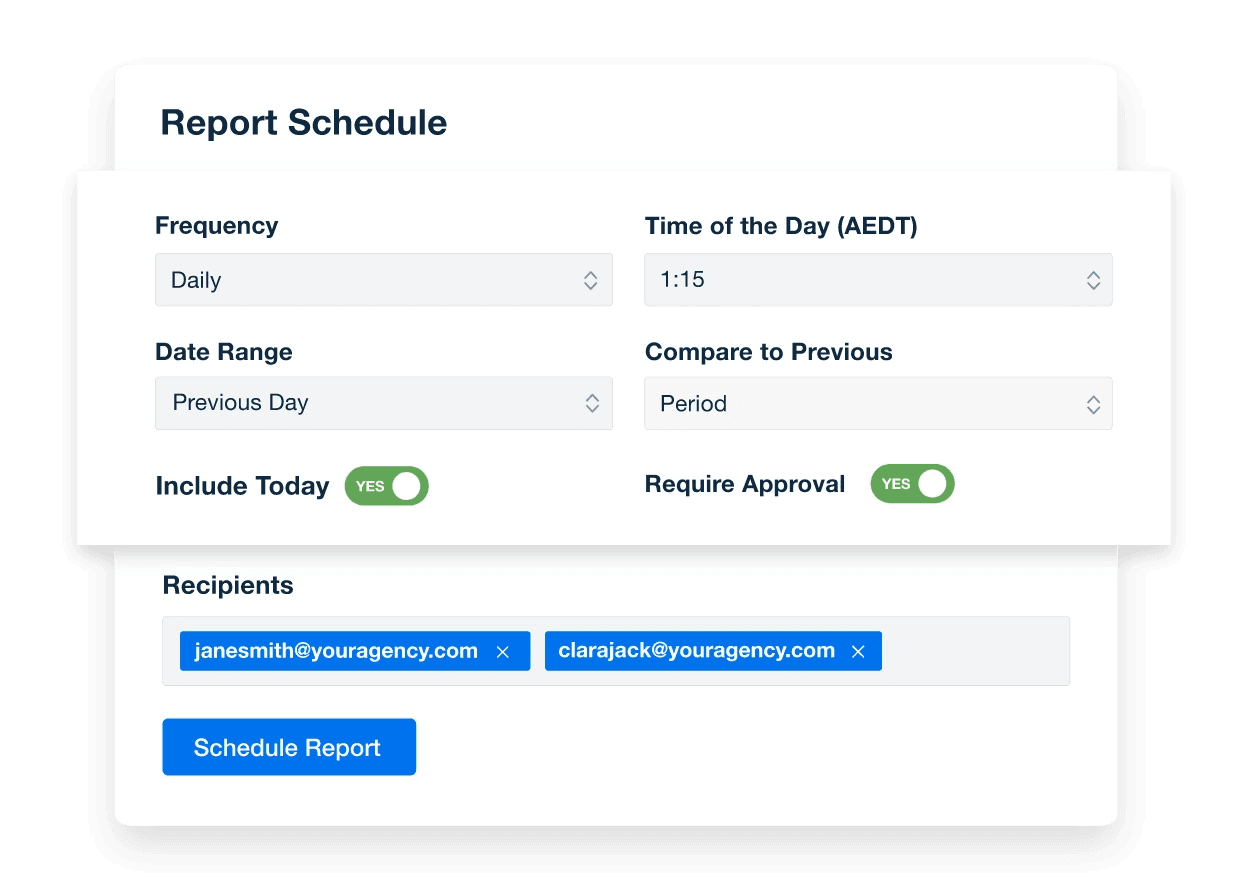
After building a report in AgencyAnalytics for the first time, put the entire process on autopilot with a simple and scalable reporting schedule and approval process. Choose to send out reports daily, weekly, or monthly, compare against previous reports, and so much more.
There are so many features and they are all very easy to use. Having monthly reports sent to clients automatically couldn't be better. Clients are happy, I'm happy!
Angus Ewart, Digital Marketing Director, Marwick Marketing
It’s time to streamline and automate your client's KPI reporting. Explore everything AgencyAnalytics has to offer and start your free 14-day trial today!

Written by
Richelle Peace is a writer with a degree in Journalism who focuses on web content, blog posts, and social media. She enjoys learning about different topics and sharing that knowledge with others. When she isn’t writing, Richelle spends time teaching yoga, where she combines mindfulness, movement, and her passion for wellness.
Read more posts by Richelle PeaceSee how 7,000+ marketing agencies help clients win
Free 14-day trial. No credit card required.


