Table of Contents
QUICK SUMMARY:
Customizable dashboards simplify client reporting by organizing data and tracking key metrics across all campaigns. They turn complex analytics into clear, visual stories that help agencies make faster, data-driven decisions. This guide explores 20+ dashboard examples—from multi-channel to platform-specific—that make data visualization effortless and elevate client reporting.
Managing multiple client campaigns means keeping track of key performance indicators, organizing data, and ensuring reports are straightforward and easy to understand. It’s a lot to handle, and if you’ve ever wondered if there’s a way to make client reporting and data analysis more manageable, you’re not alone.
Dashboards eliminate that chaos by bringing every metric into one view. Instead of piecing together reports manually, agencies get a real-time, bird’s-eye view of performance. That clarity fuels better strategy and faster decision-making for both internal teams and clients.
In this guide, we’ll walk through different dashboard examples designed to improve client reporting and data analysis.
Curious to see how customizable dashboards will help streamline your data processes? Let’s get started.
Benefits of Dashboards for Data Analysis and Client Reporting
Dashboards are the backbone of modern analytics reporting. They consolidate metrics, visualize results, and make it easy for agencies to translate complex data into clear, actionable insights for clients. A well-built reporting dashboard delivers a quick review of marketing efforts while highlighting opportunities for optimization.
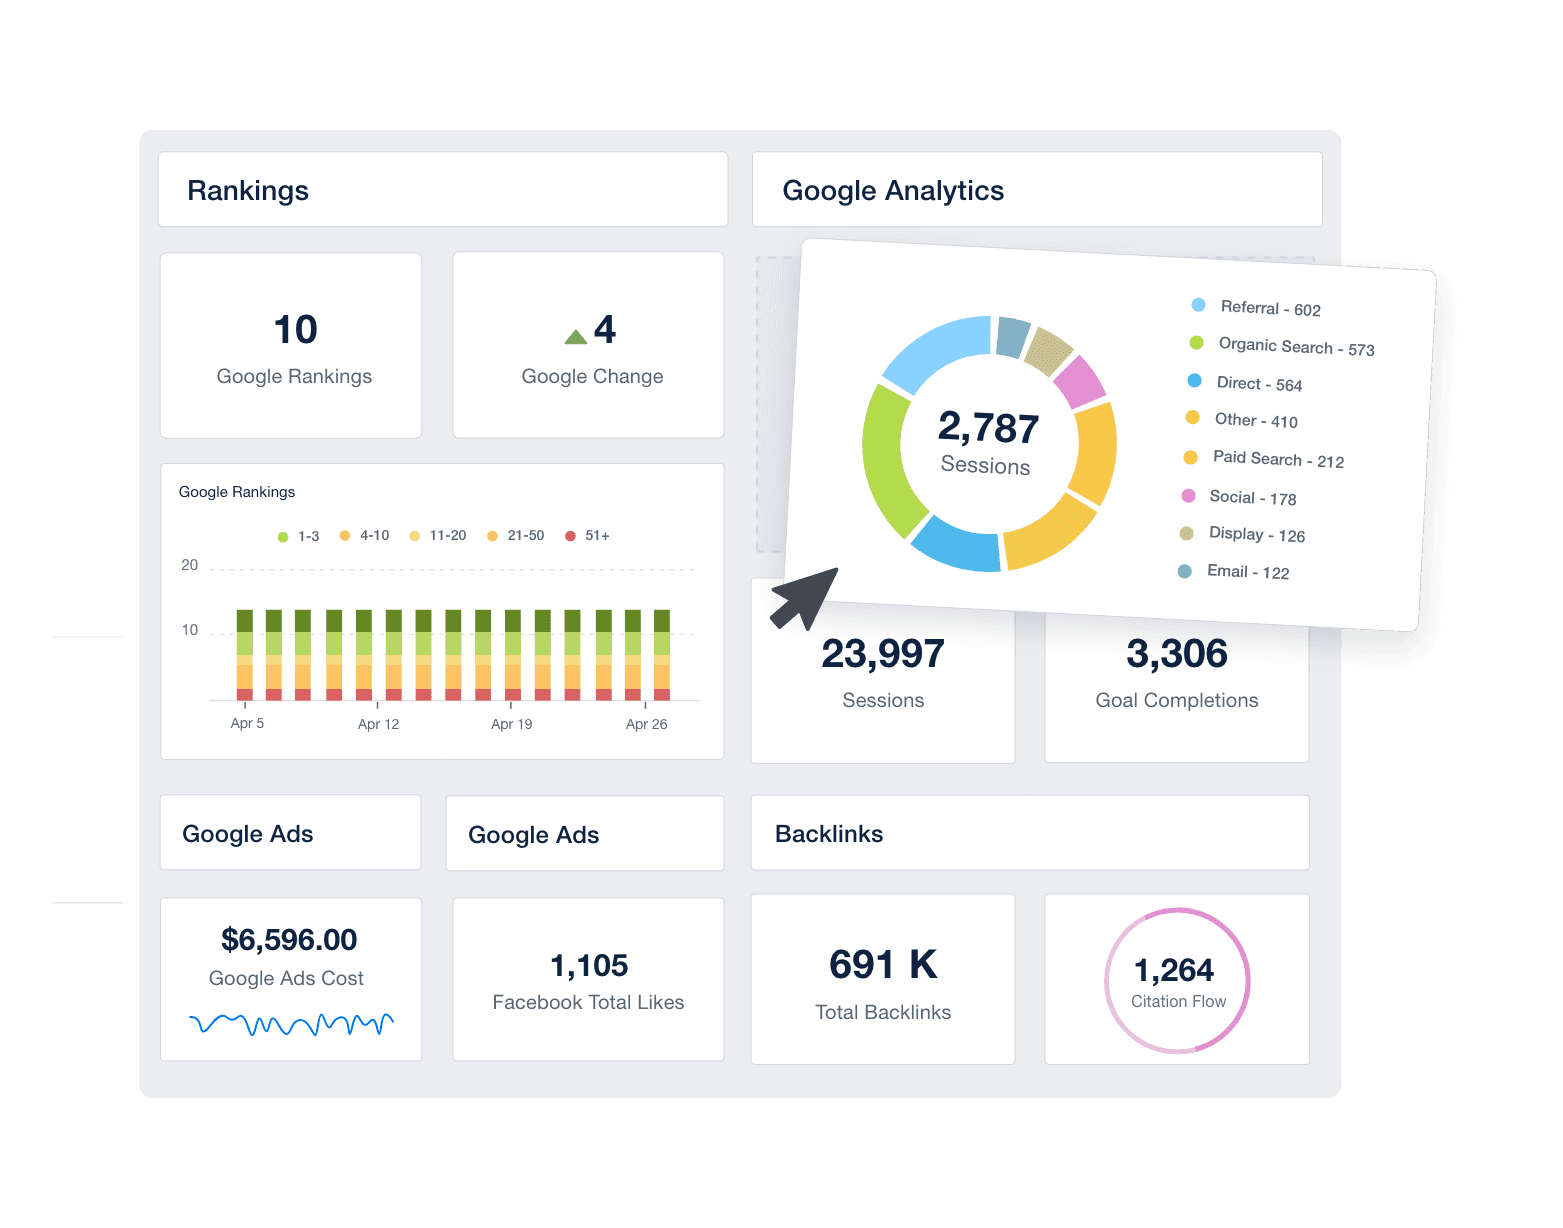
By automating manual tasks and offering interactive metrics dashboards, agencies focus on delivering actionable insights to their clients rather than getting bogged down by inefficient reporting methods.
The Advantage of Live Data Tracking and Performance Monitoring
One of the most significant benefits of using dashboards is the ability to track live data. This real-time tracking offers a clear view of a client’s marketing efforts, making it easier to adjust strategies on the fly.
Performance monitoring is no longer dependent on waiting for end-of-month reports; instead, key metrics are updated automatically, offering a snapshot of how campaigns are performing at any given moment.
The Value of Tracking Key Performance Indicators (KPIs) for Campaign Success
Data dashboards keep every KPI front and center—conversions, engagement, ad spend, or SEO visibility. By focusing on what matters most, agencies quickly identify which campaigns drive progress toward business goals and which need optimization. It’s decision-making powered by data, not guesswork.
With business intelligence baked into dashboards, agencies quickly assess whether campaigns are on track to meet goals, and clients easily understand how their investment is paying off.
How Automated Dashboards Streamline Reporting and Analysis
Automated dashboards eliminate repetitive, manual work. They pull metrics from multiple platforms into one intuitive interface, providing a unified business dashboard that’s ready to share with clients. Interactive data visualizations—charts, graphs, and trend lines—turn numbers into stories, helping clients grasp results at a glance.
Interactive dashboards also make it easy to navigate between different metrics and visualize the data in meaningful ways.
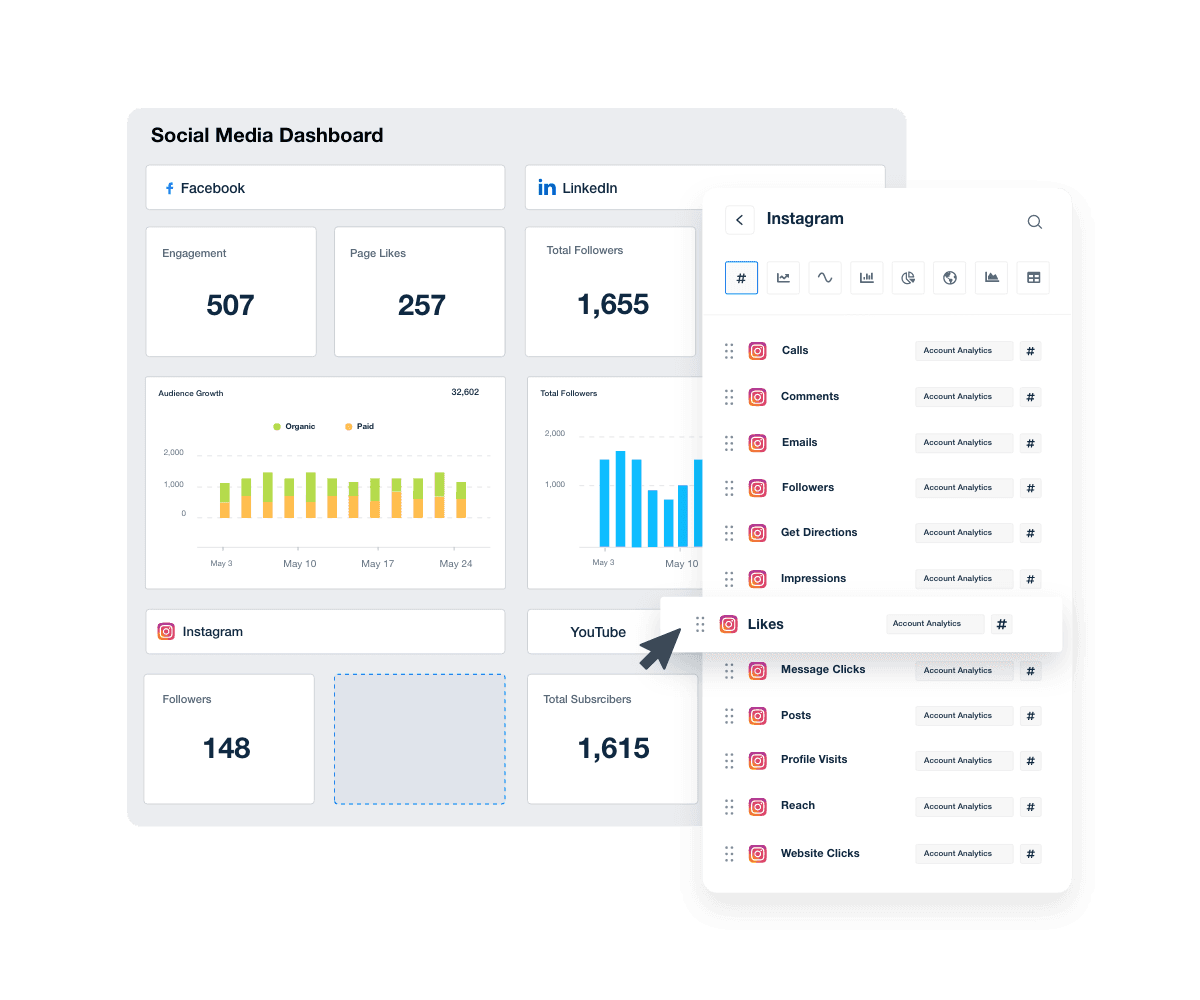
Data visualization tools help agencies and clients alike understand complex information quickly, turning raw numbers into actionable insights. Automating the reporting process means teams spend less time on repetitive tasks and more time on strategy, improving overall business intelligence.
5 Key Features of an Effective Reporting Dashboard
An effective reporting dashboard does more than gather data—it helps you make sense of it. Whether you’re tracking sales performance or key financial metrics, the right dashboard provides a clear view of your client’s marketing efforts.
A strong reporting dashboard blends intelligence and simplicity. It should visualize performance clearly, adapt to each client’s needs, and allow quick navigation across data points. These five features set the foundation for every successful analytics dashboard.
1. Integration With Third-Party Tools for Seamless Data Collection
Whether you’re pulling in data from Google Analytics, Facebook Ads, or a CRM system, the ability to integrate with third-party tools means you won’t have to manually gather and input data—meaning no manual imports and no broken Excel formulas.
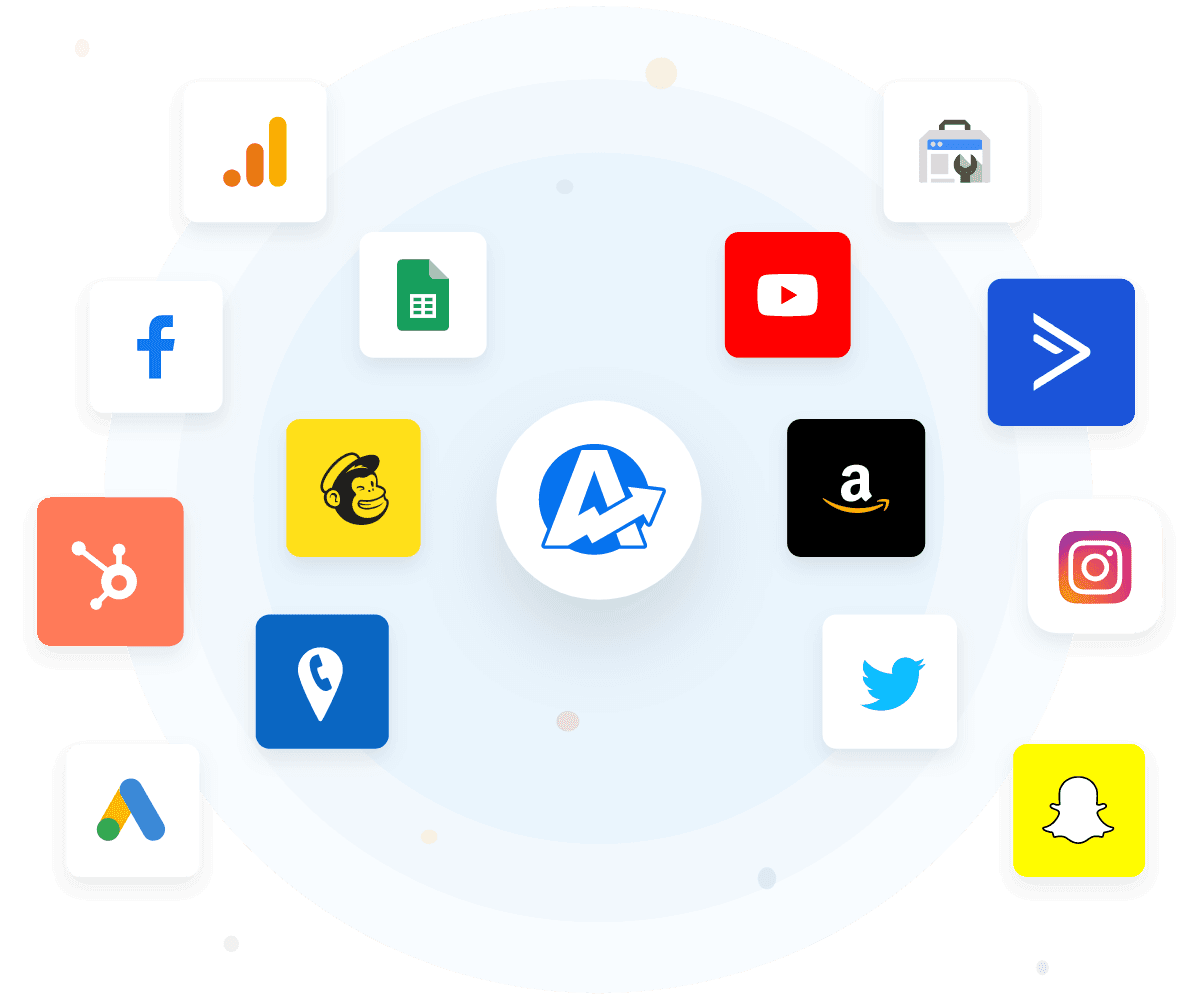
This seamless data collection gives you a complete view of everything in one place, which is essential for tracking a client’s full marketing and sales performance.
Browse the over 80 data connectors included with every AgencyAnalytics plan.
2. Customization To Meet Client Needs
No two agencies (or clients) are the same, so a good dashboard needs customization options. Dashboards should adapt to each client’s unique goals. From branding and layout to color palette and KPI selection, customization ensures every client dashboard aligns with their strategy and reporting style. White-label options make the experience feel like it’s their own.
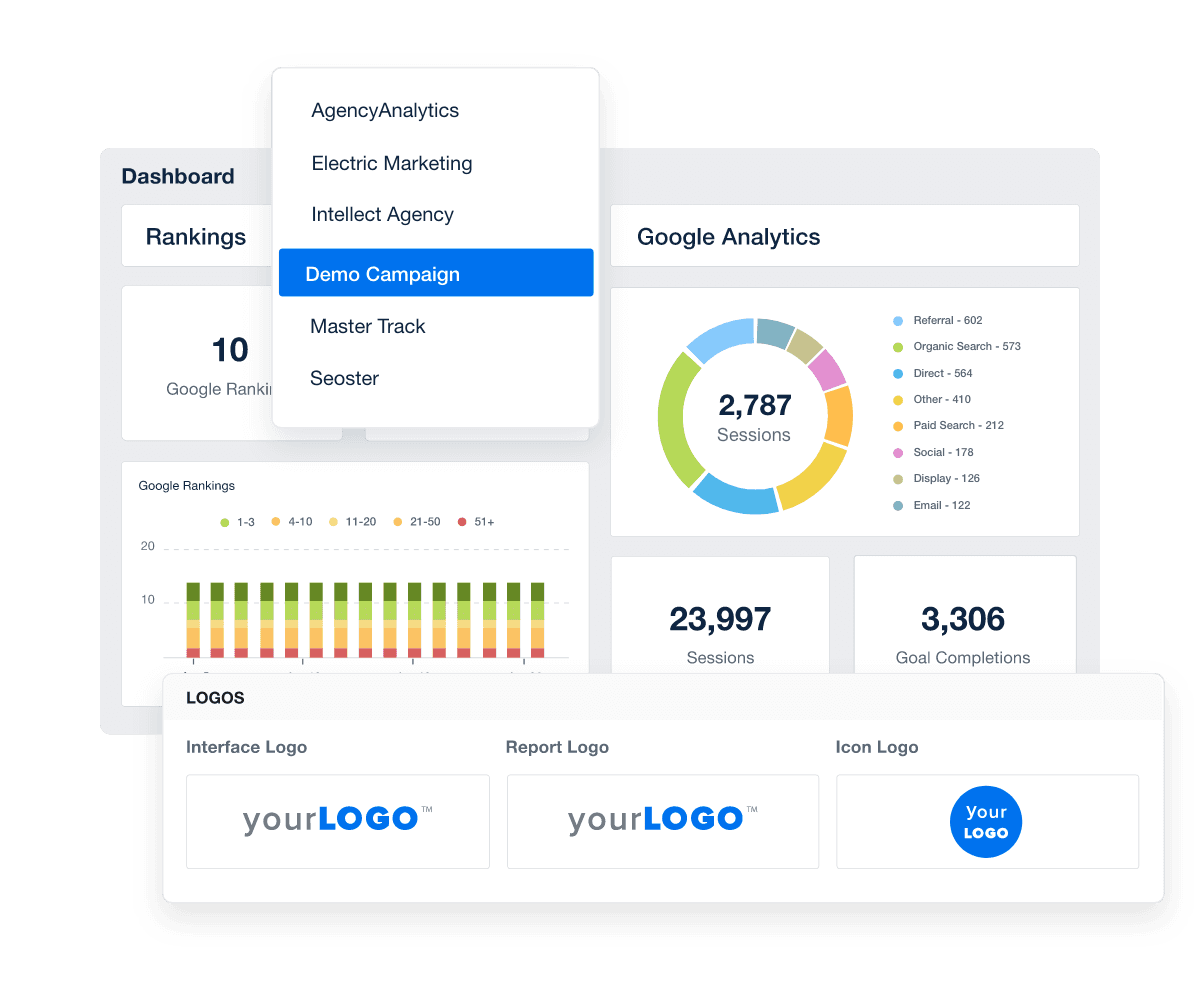
White labeling is another key feature—clients appreciate reports that look like they come straight from their own team. And easy-to-use data visualization options are a must!
The flexibility to tailor everything based on what matters to your client’s business goals is what makes a great dashboard tool.
3. Real-Time Reporting Capabilities
Real-time dashboards help agencies pivot instantly. As data flows in, teams see which campaigns perform best and where adjustments will have the biggest impact. It’s a faster, smarter way to support data-driven decision-making.
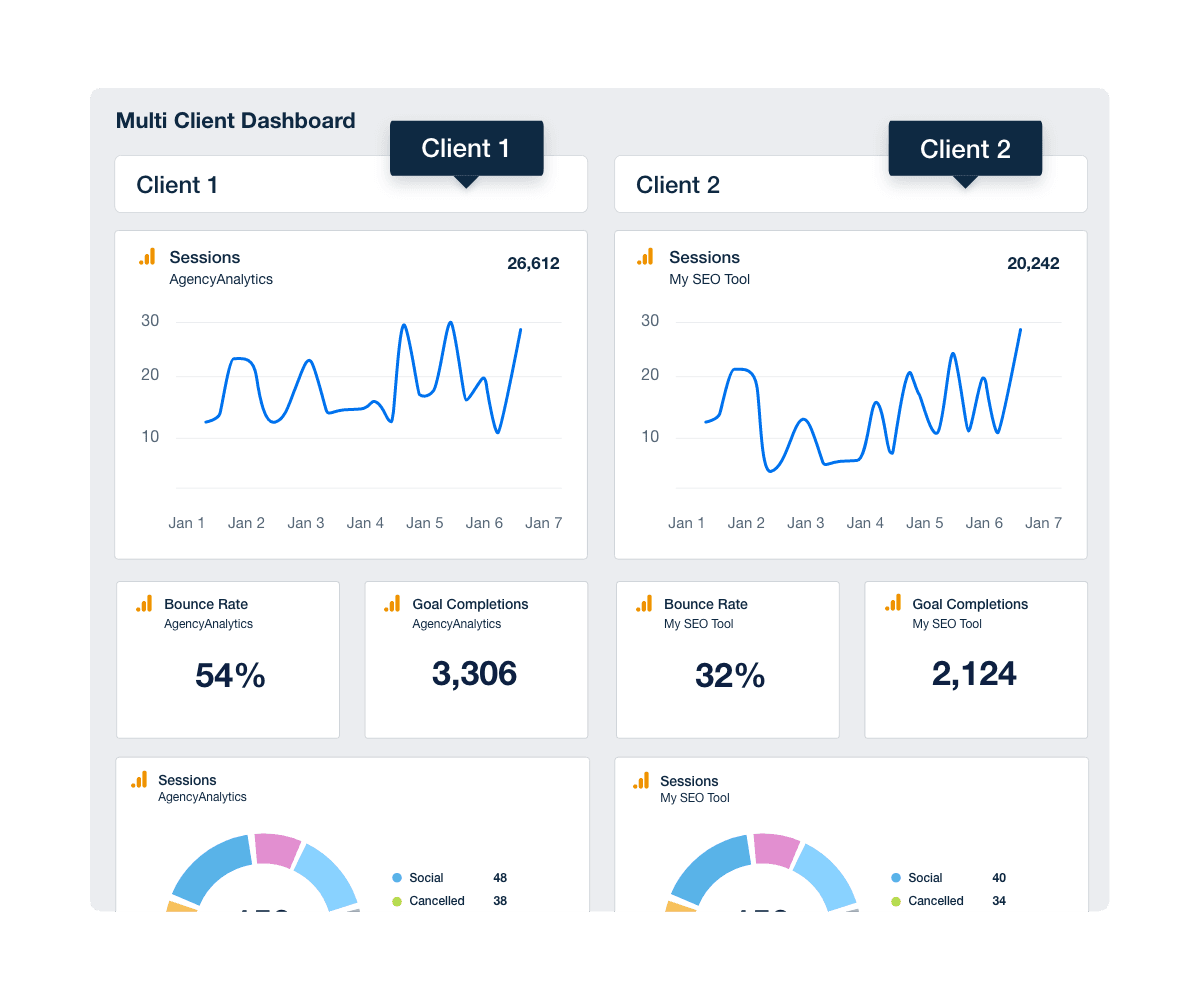
Access to live data gives you—and your clients—valuable insights right when they need it, allowing for quick adjustments and better-informed decisions.
4. User-Friendly Design and Ease of Use for Both Agencies and Clients
Dashboards should be beautiful and functional. Clean design, easy navigation, and intuitive drag-and-drop editing make it simple to explore metrics. Visual consistency and clear color palettes guide focus so users find meaning, not clutter.
After all, a dashboard isn’t of much use if it’s too complicated to navigate. Use the drag-and-drop report builder to easily add data visualizations like charts, graphs, and other visuals to make complex data easier to understand.
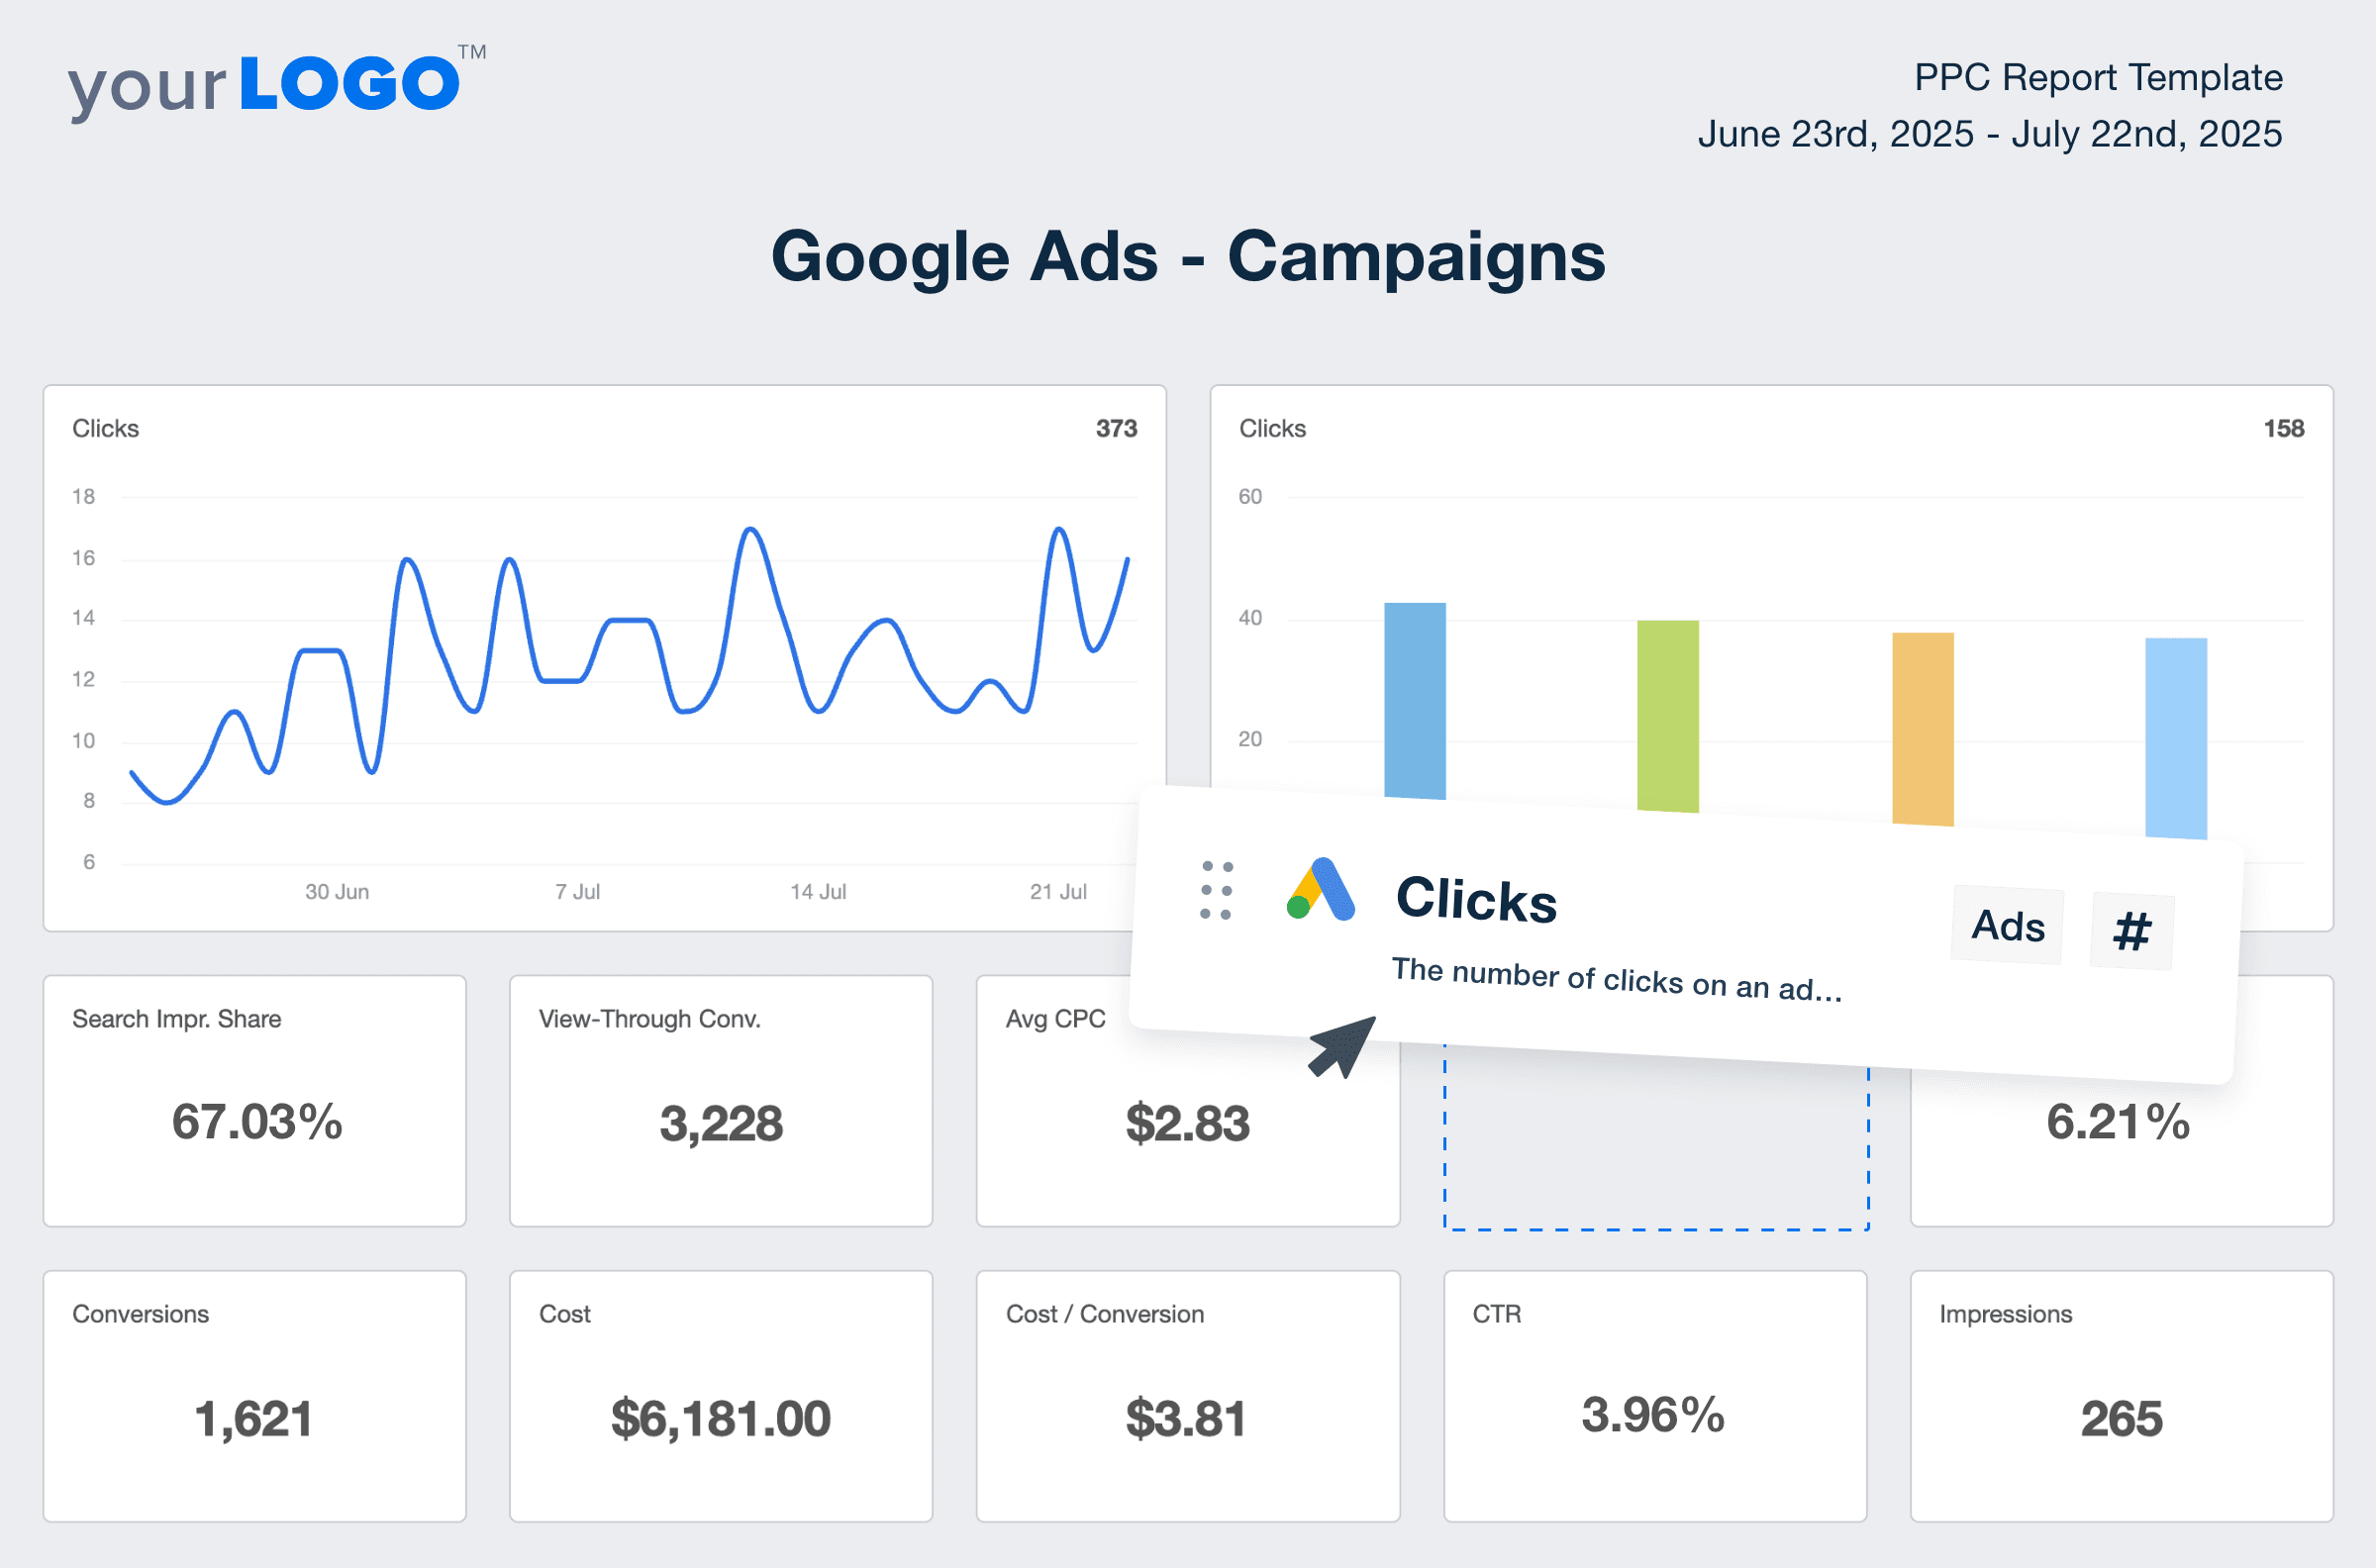
A clean, intuitive interface ensures that even clients with little technical expertise can log in and instantly see how their campaigns are performing. The best dashboards strike the right balance between powerful features and simple navigation, helping users quickly get to the valuable insights.
5. AI Tools for Instant Insights
A dashboard equipped with AI reporting tools makes data analysis even easier. AI-powered dashboards amplify human intelligence. By analyzing trends automatically, they surface insights your team might miss and recommend optimizations across channels.
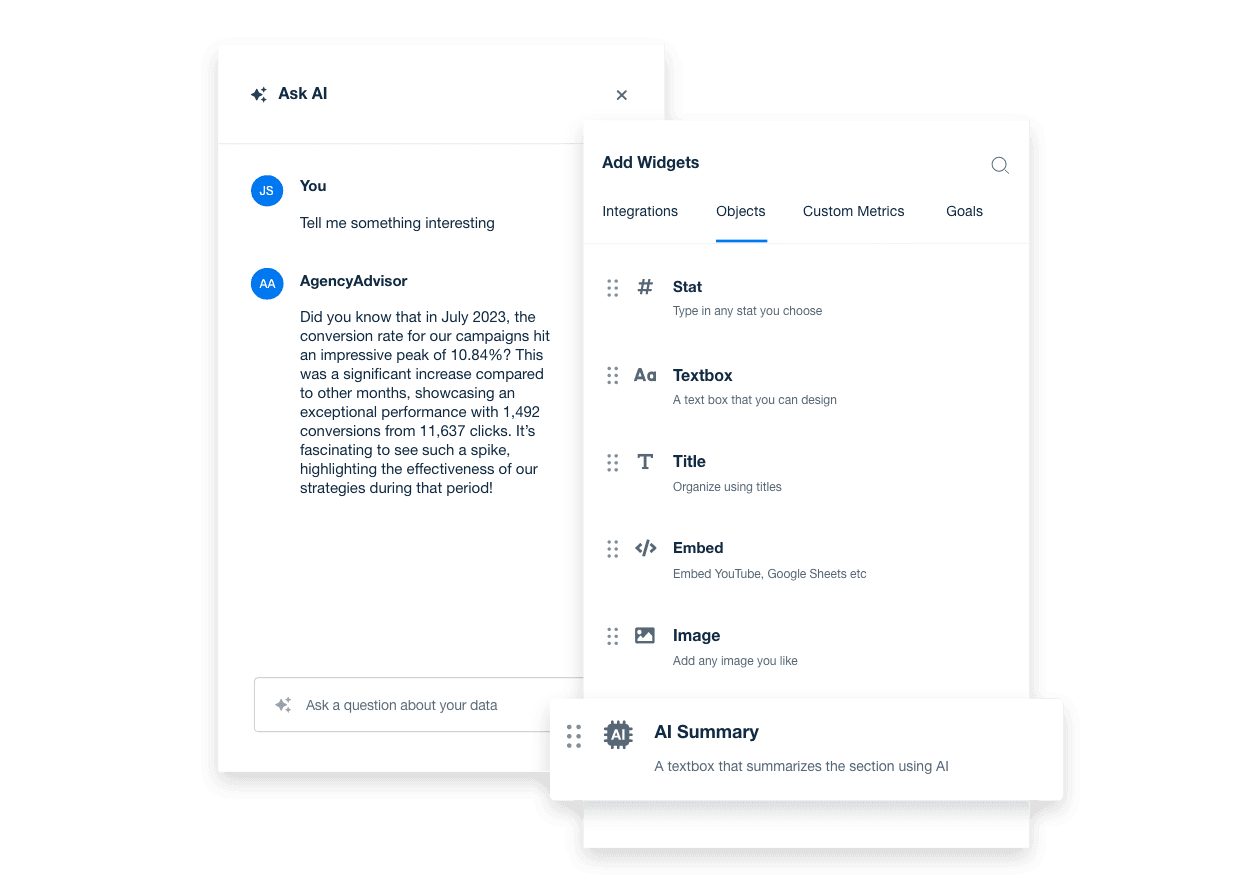
Having AI built right into the dashboard means you don’t need to manually search for insights—they come to you. It’s like having an analyst working 24/7 behind the scenes, helping you spend more time on strategy and creative execution.
Want to see how AI insights improve your agency’s campaign management and reporting? Try AgencyAnalytics free for 14 days!
In short, a great reporting dashboard offers more than just data collection. It tracks key metrics, integrates easily with other tools, provides real-time updates, and is customizable to each client’s needs. Most importantly, it’s easy to use for everyone involved.
To help kickstart this process, we’re highlighting 80 dashboard examples that are available on every AgencyAnalytics plan. These dashboard templates help agencies get from data chaos to professional client reports in minutes, not hours.
Multi-Channel Dashboard Examples
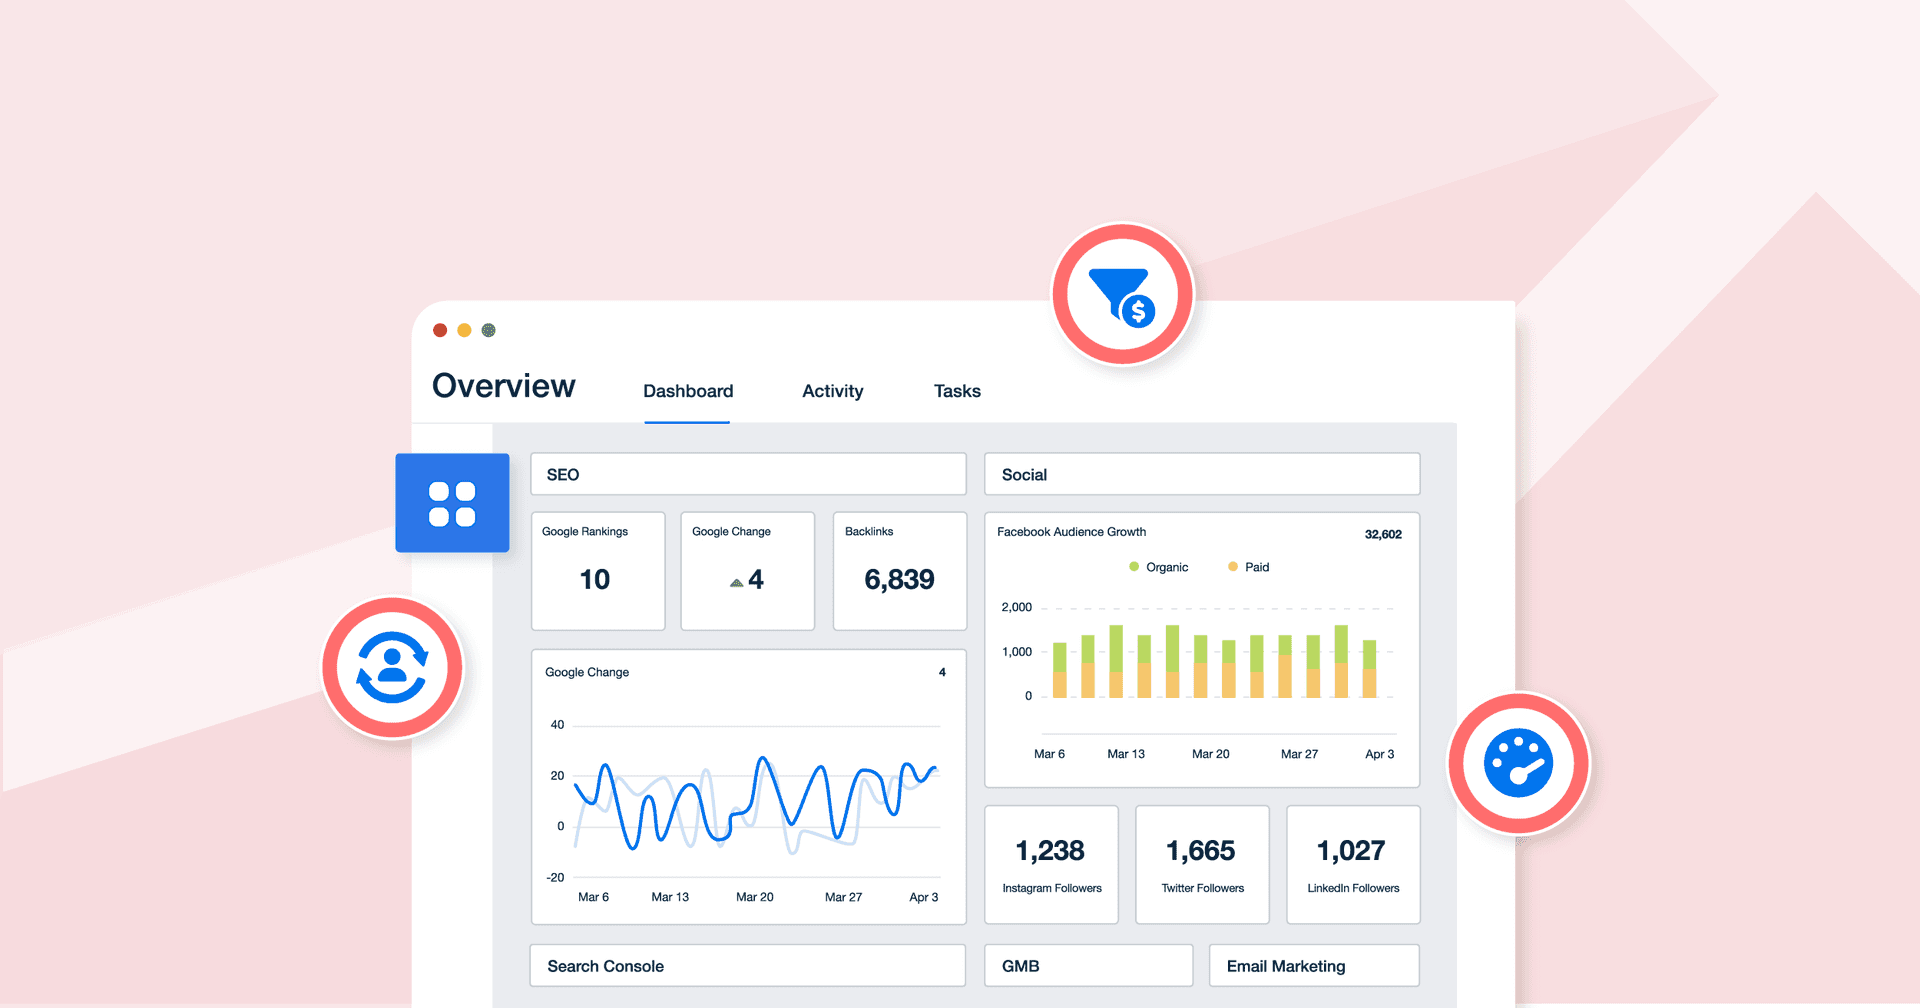
A multi-channel business dashboard brings all your client’s key metrics into one place, offering a clear view of your client’s marketing efforts across different platforms. From social media to SEO, a comprehensive dashboard allows agencies to gain insights from multiple data sources in real-time.
Below are some of the best marketing dashboards to help you optimize performance across all channels.
Digital Marketing Dashboard
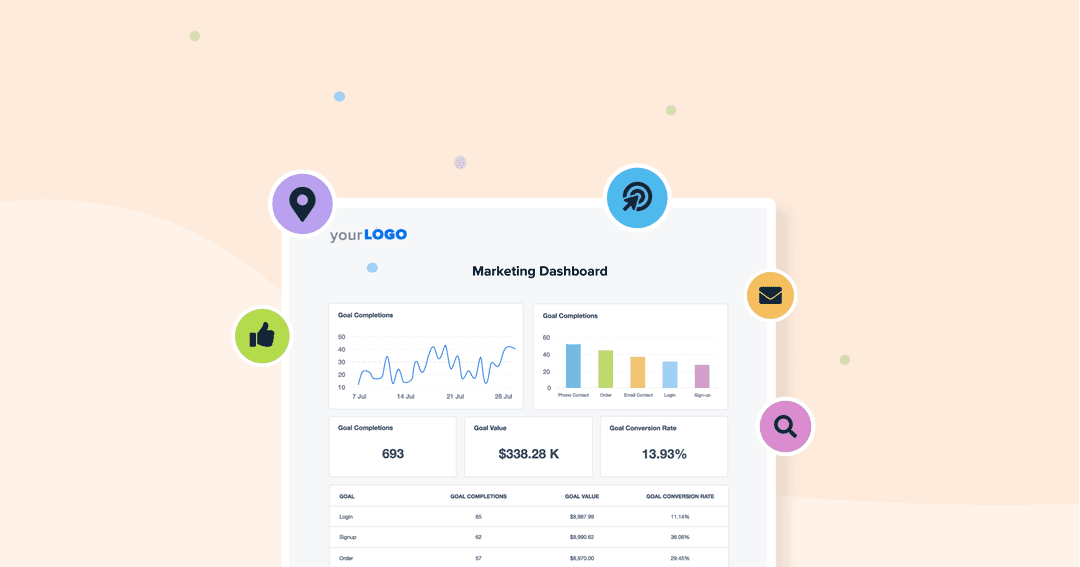
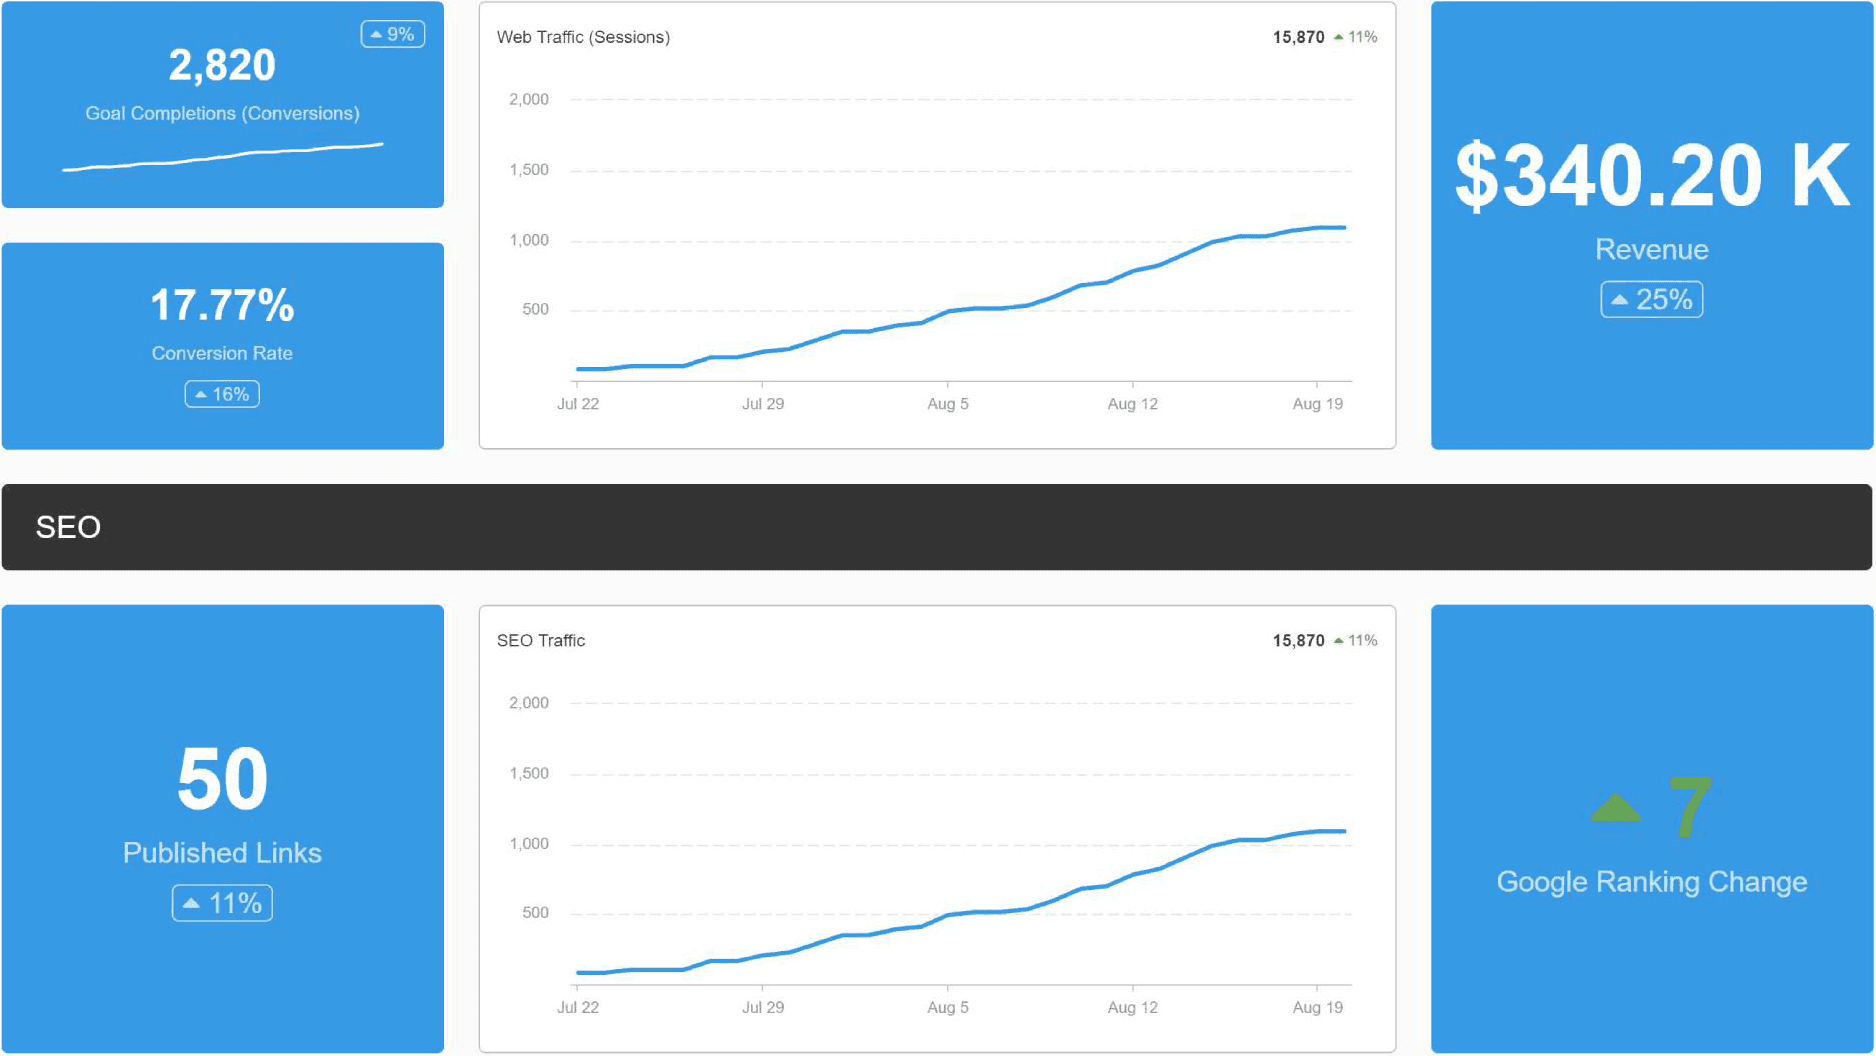
A digital marketing dashboard is your all-in-one view of client performance. It blends data from sources like Google Analytics, social platforms, and paid media to create a comprehensive dashboard, so you see how everything works together. It’s perfect for understanding the big picture and spotting opportunities for improvement.
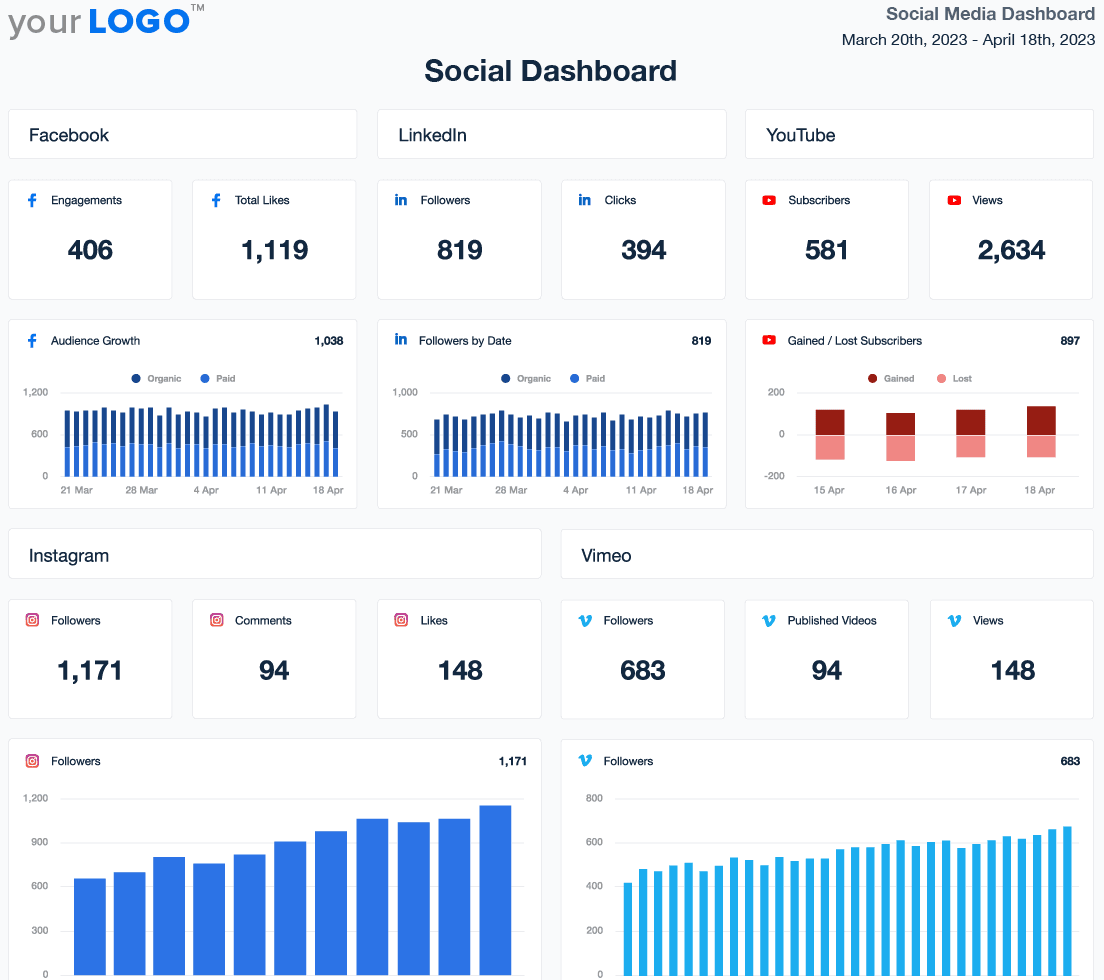
Social Media Dashboard
The social media dashboard centralizes all social KPIs—engagement, reach, and follower growth—across networks like Facebook, LinkedIn, Instagram, and X. It helps agencies identify which platforms drive brand awareness and where to refine strategy for stronger audience connection.
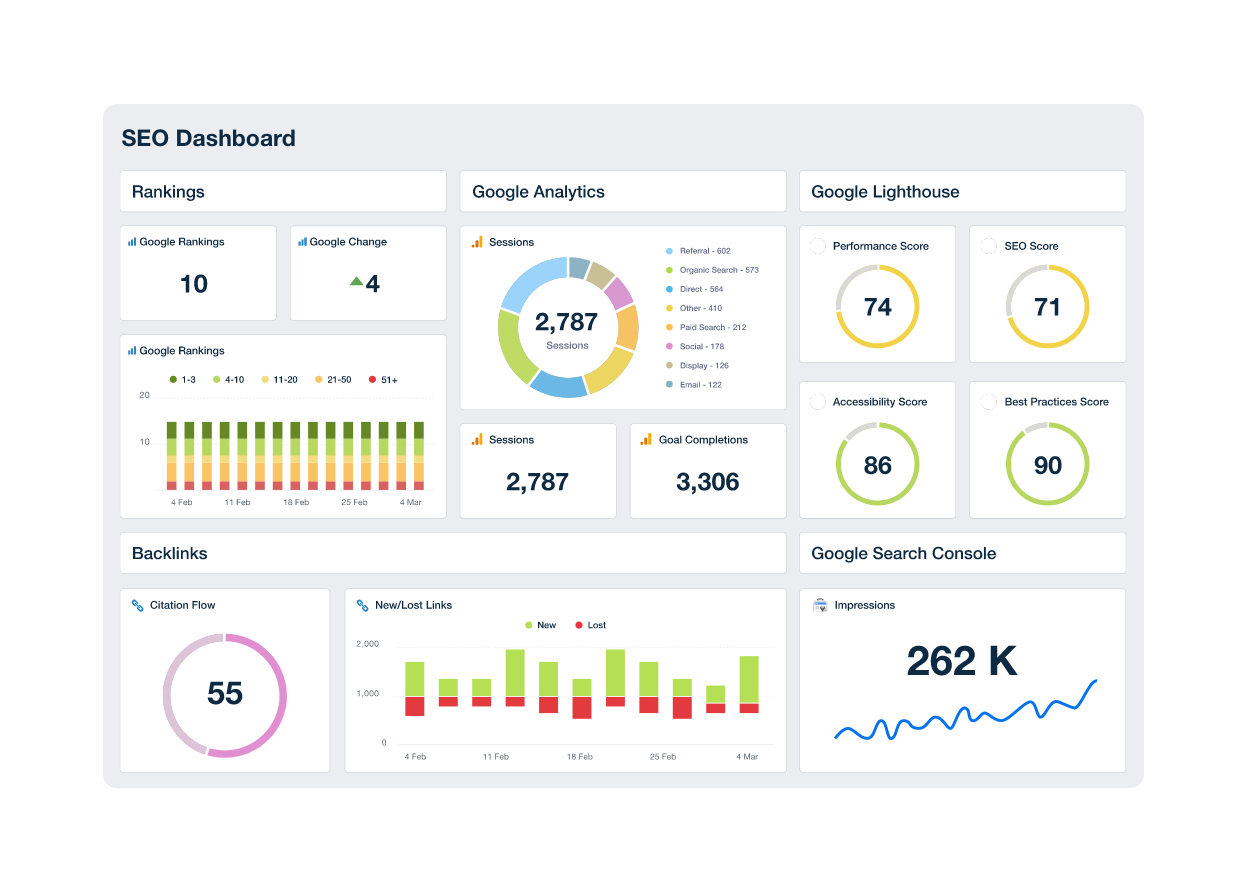
SEO Dashboard
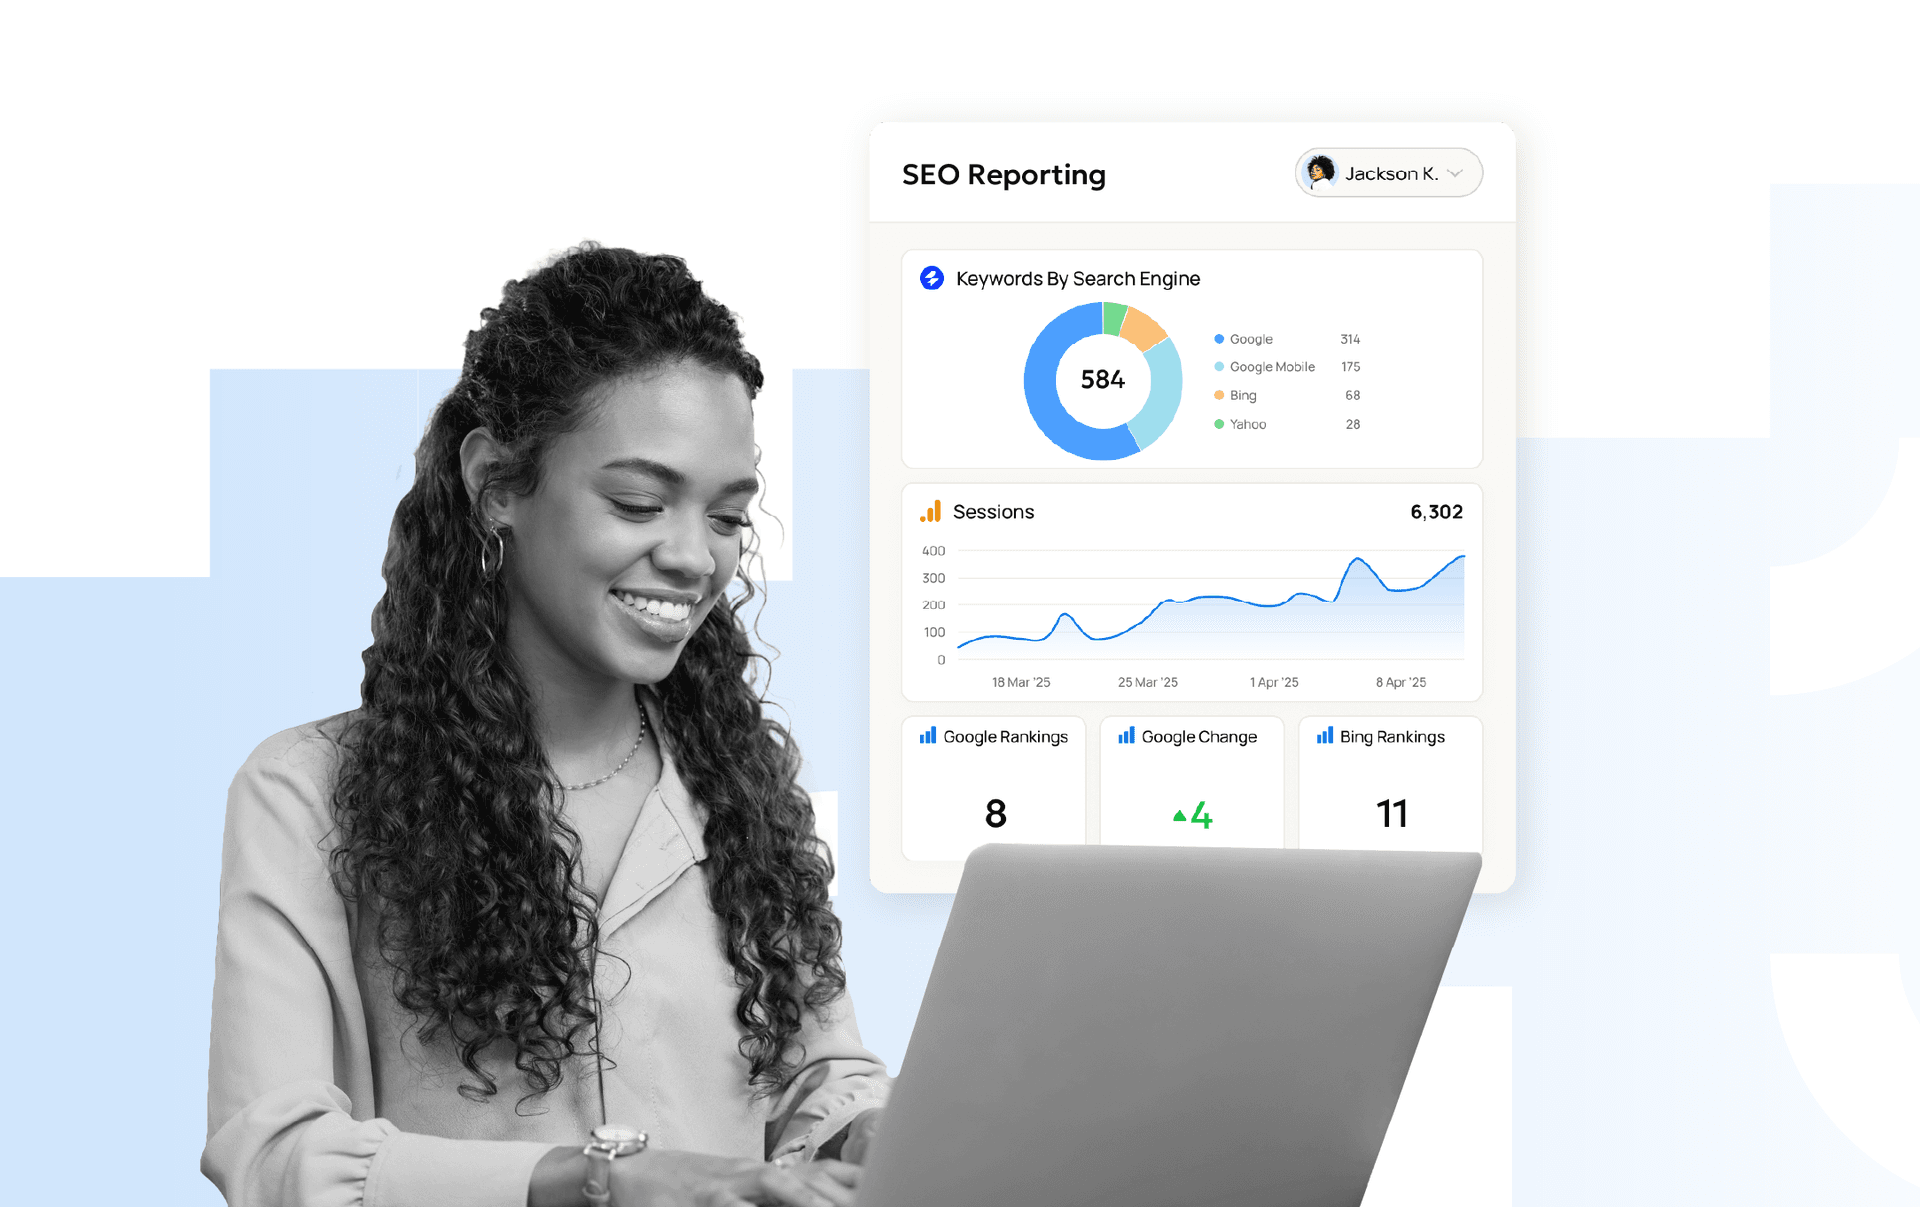
An SEO dashboard is all about tracking organic search performance. SEO dashboards combine keyword rankings, backlinks, and organic traffic trends in one interface. By surfacing patterns in visibility and search intent, they help agencies refine on-page strategy and prove the ROI of ongoing SEO efforts.
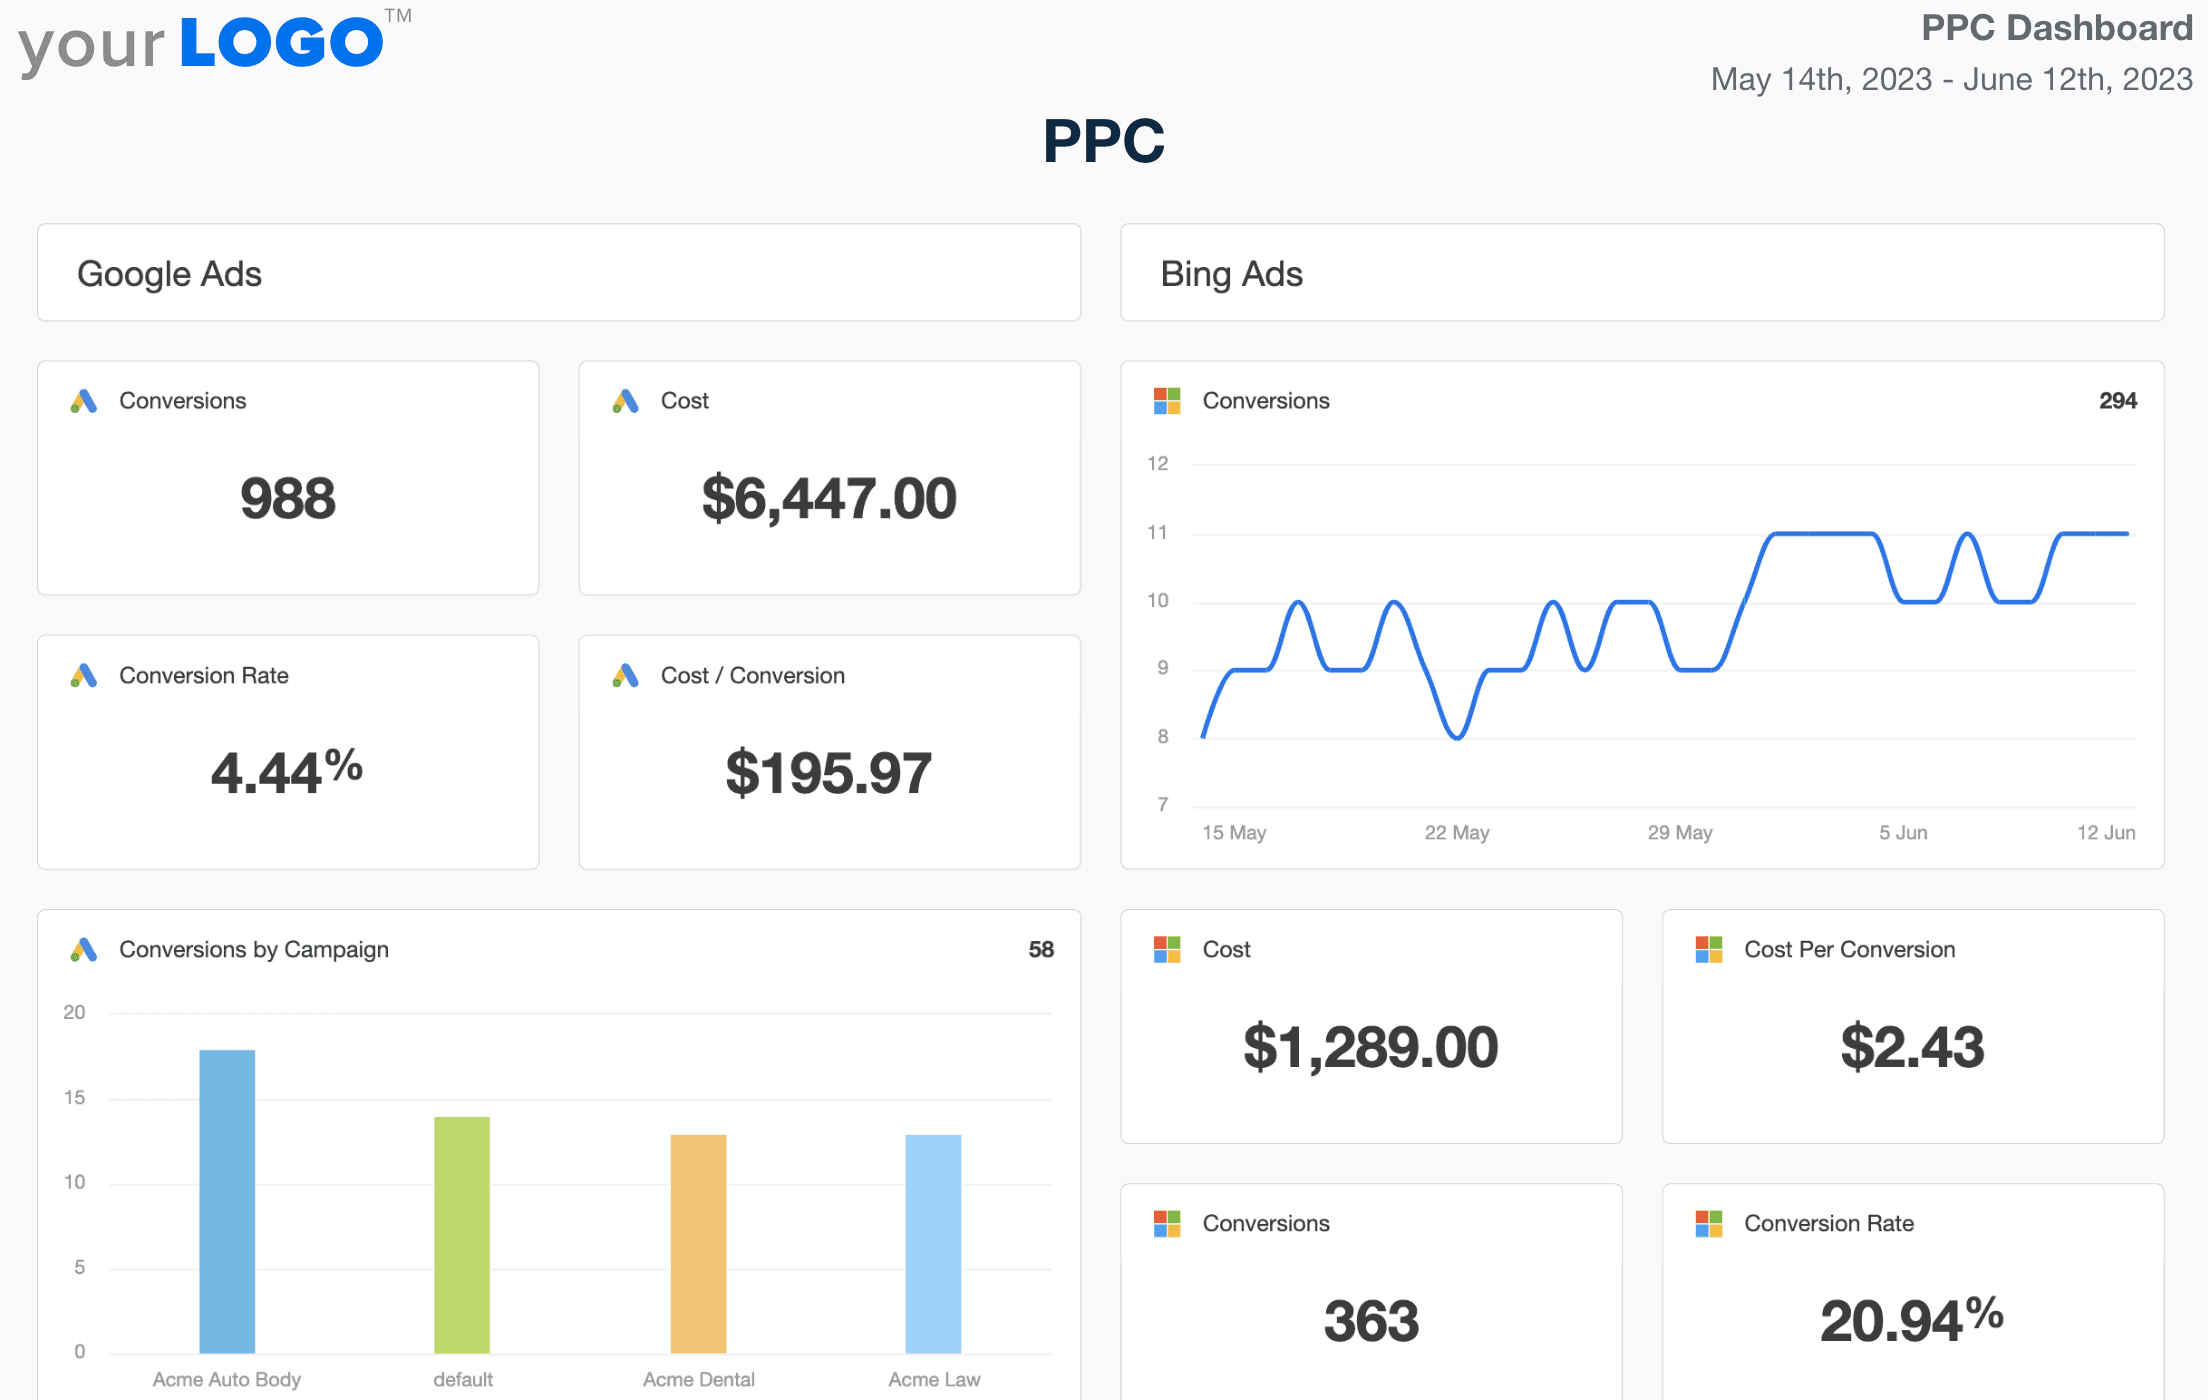
PPC Dashboard
The PPC dashboard focuses on your client’s paid search campaigns, offering real-time data on metrics like cost-per-click, ad spend, and conversions. With live updates on ad spend, CTR, and conversions, it enables quick optimization and smarter budget allocation. This dashboard is essential for clients focused on performance marketing.
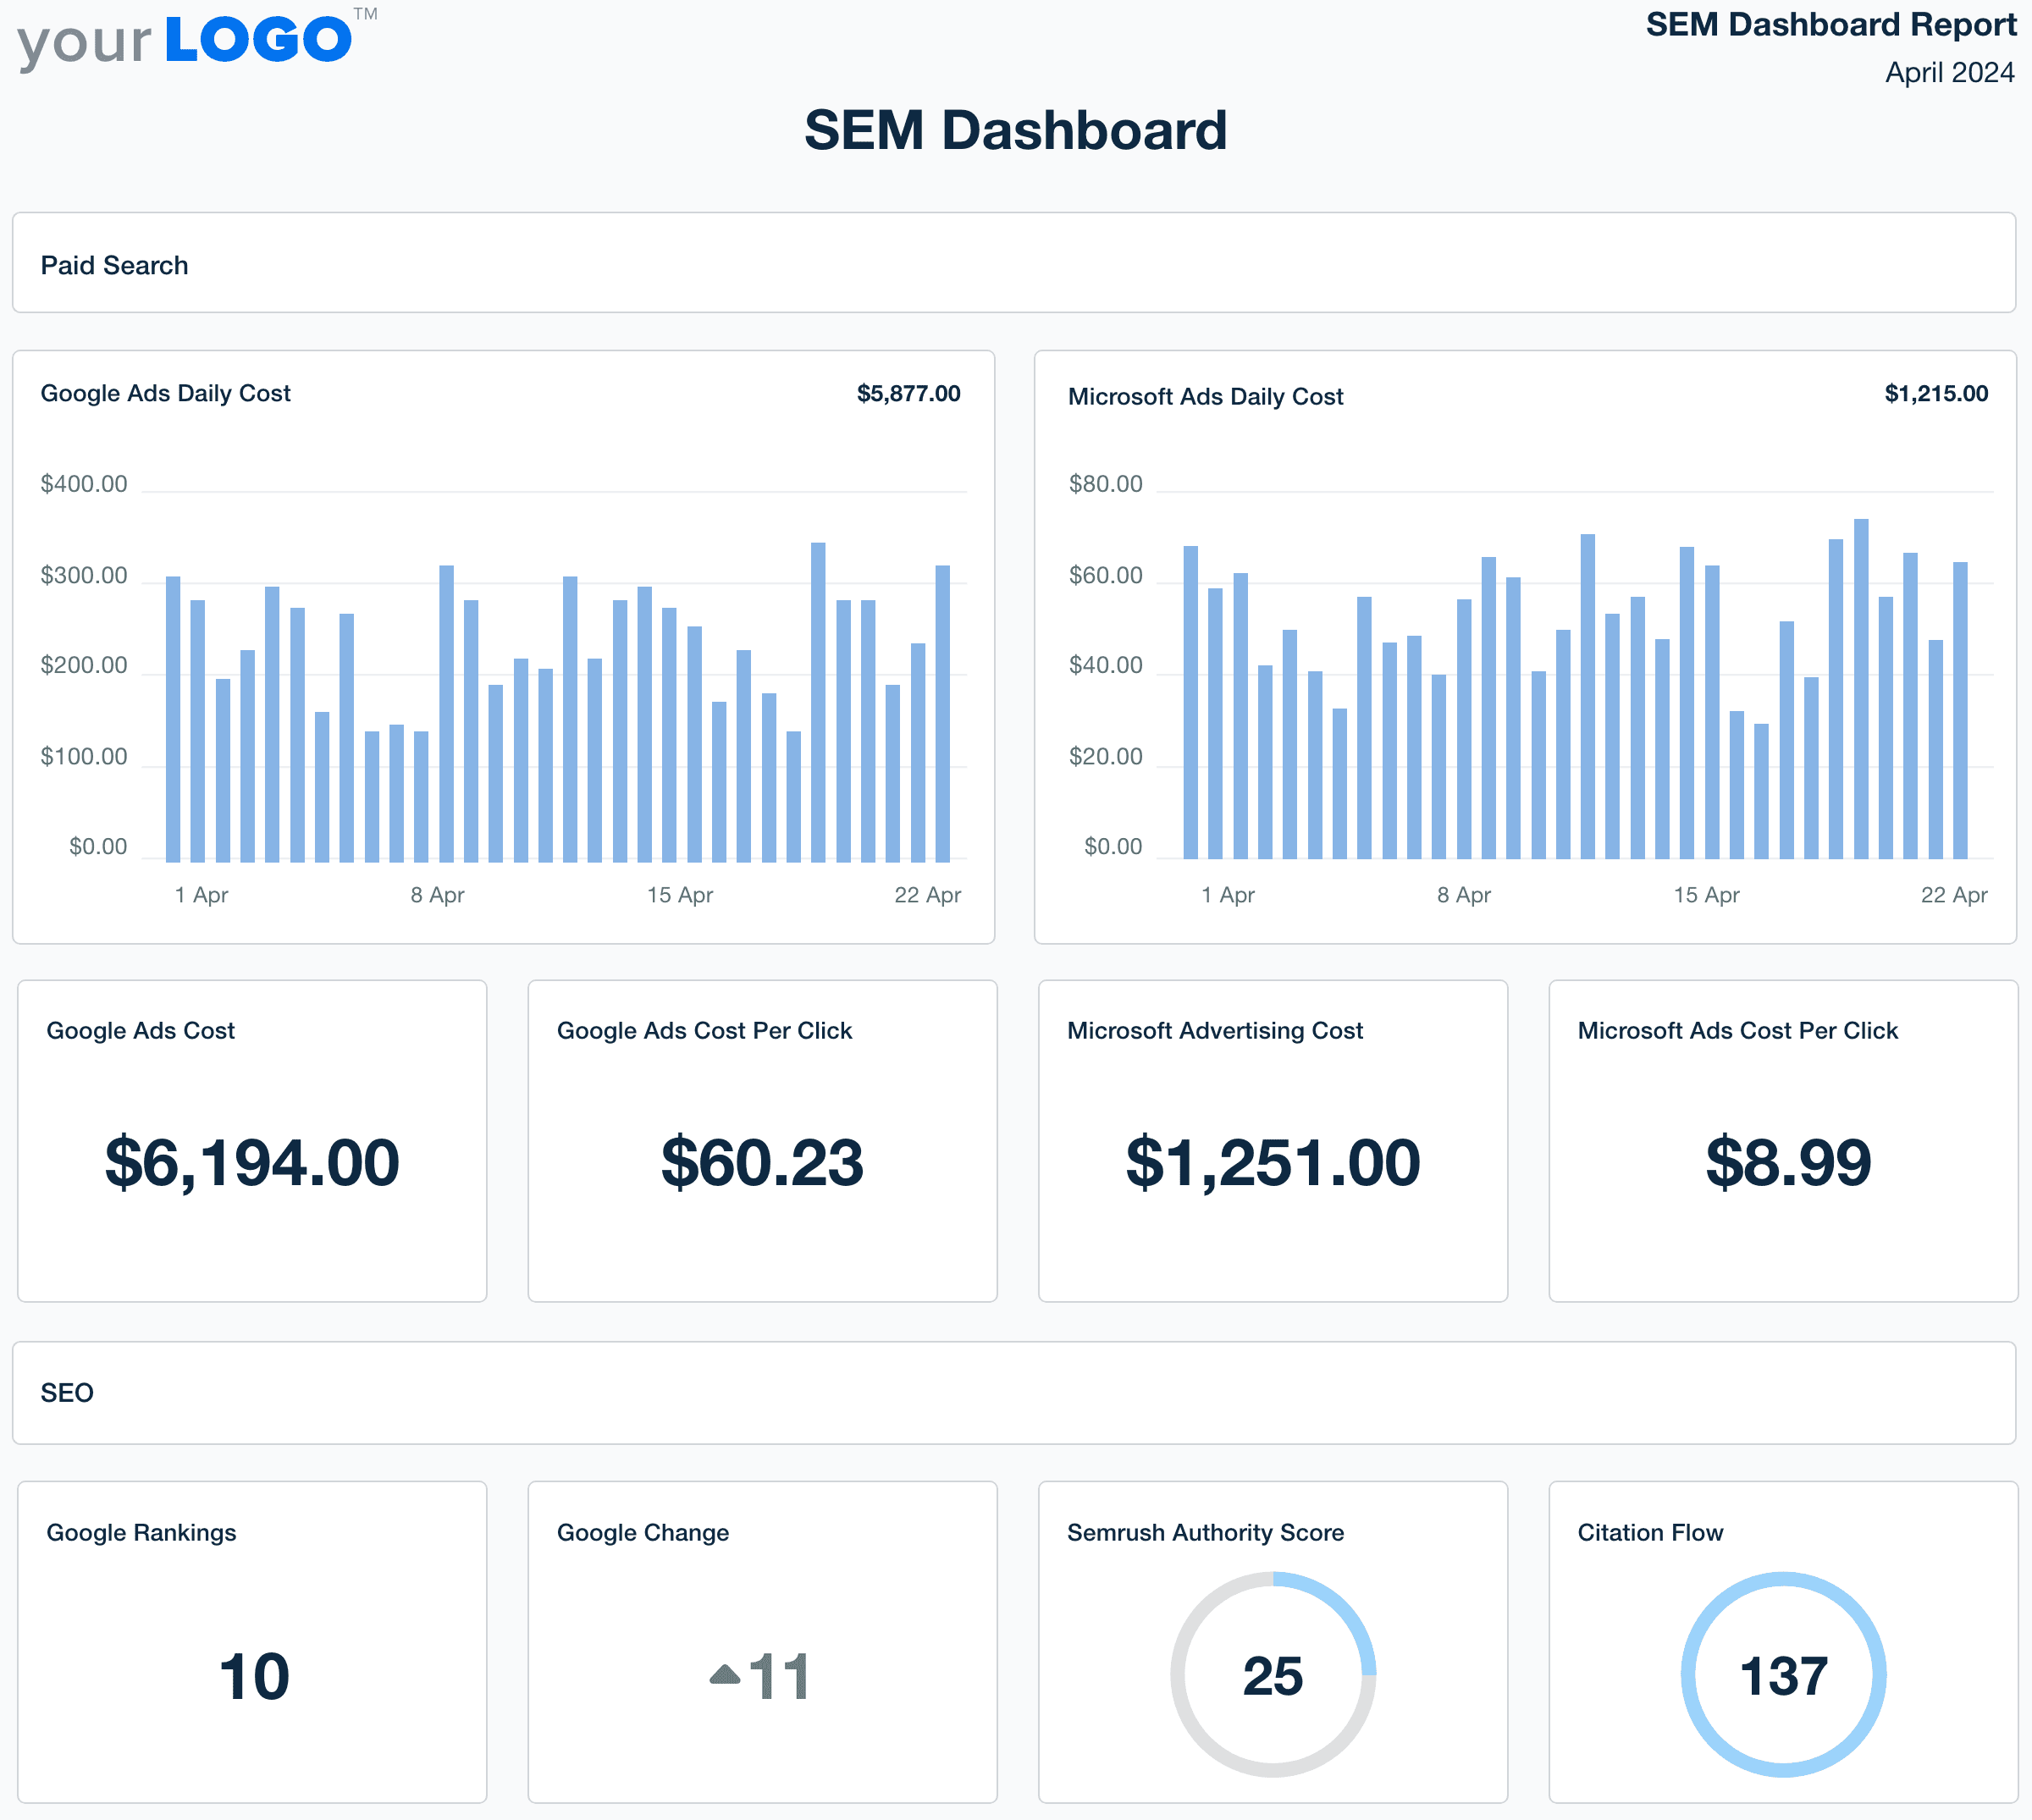
SEM Dashboard
A search engine marketing (SEM) dashboard combines paid and organic search data for a more complete view of search visibility. By merging insights from multiple channels, agencies identify how each campaign contributes to the overall marketing funnel.
It’s ideal for tracking the overall effectiveness of your client’s SEM strategies, pulling SEM performance metrics from multiple data sources to provide a full picture of search marketing efforts.
Email Marketing Dashboard
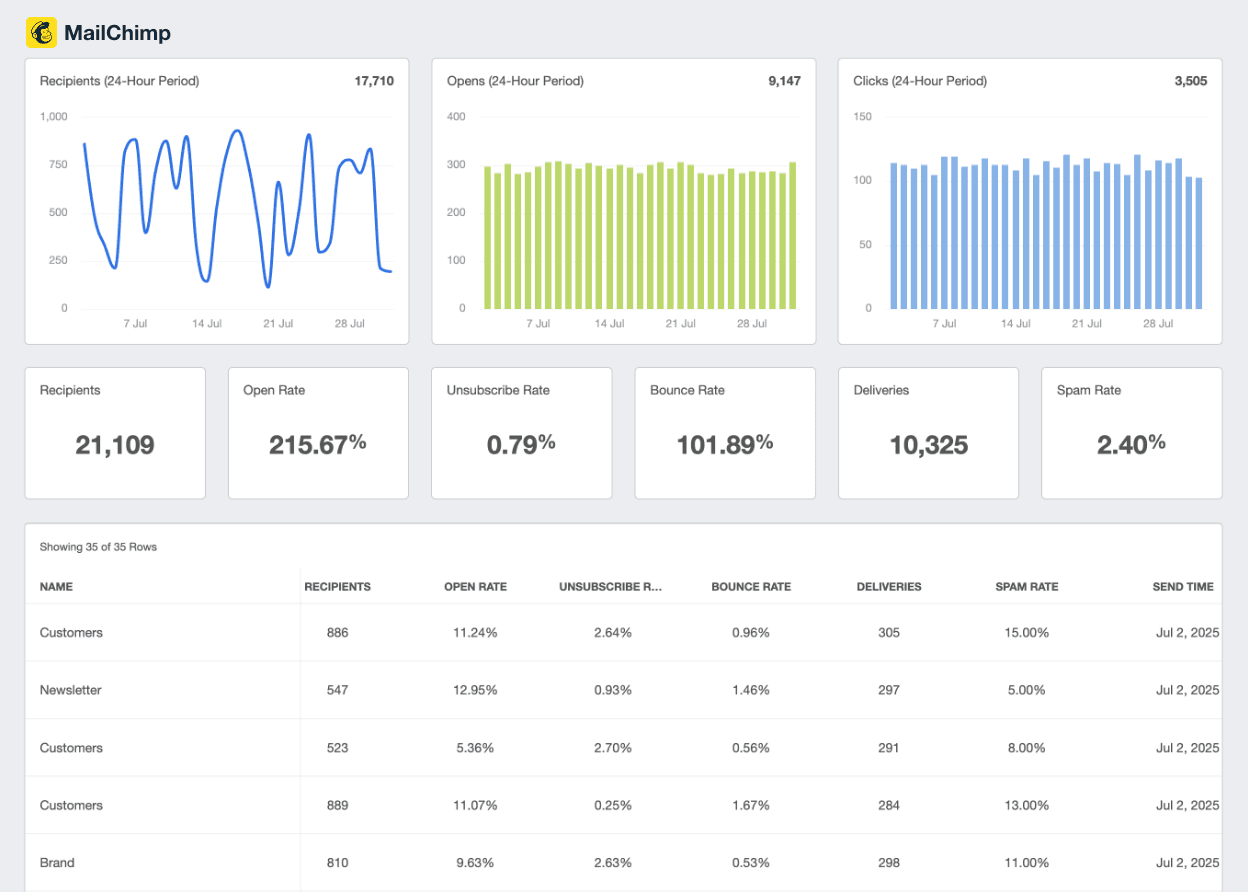
The email marketing dashboard helps you monitor key metrics from popular email platforms like ConstantContact, Mailchimp, Drip, Klaviyo and more. Track all of your client’s critical email KPIs including open rates, click-through rates, and more. It’s a simple but effective way to see how your client’s email campaigns are doing and where you might need to make adjustments for better results.
Ecommerce Dashboard
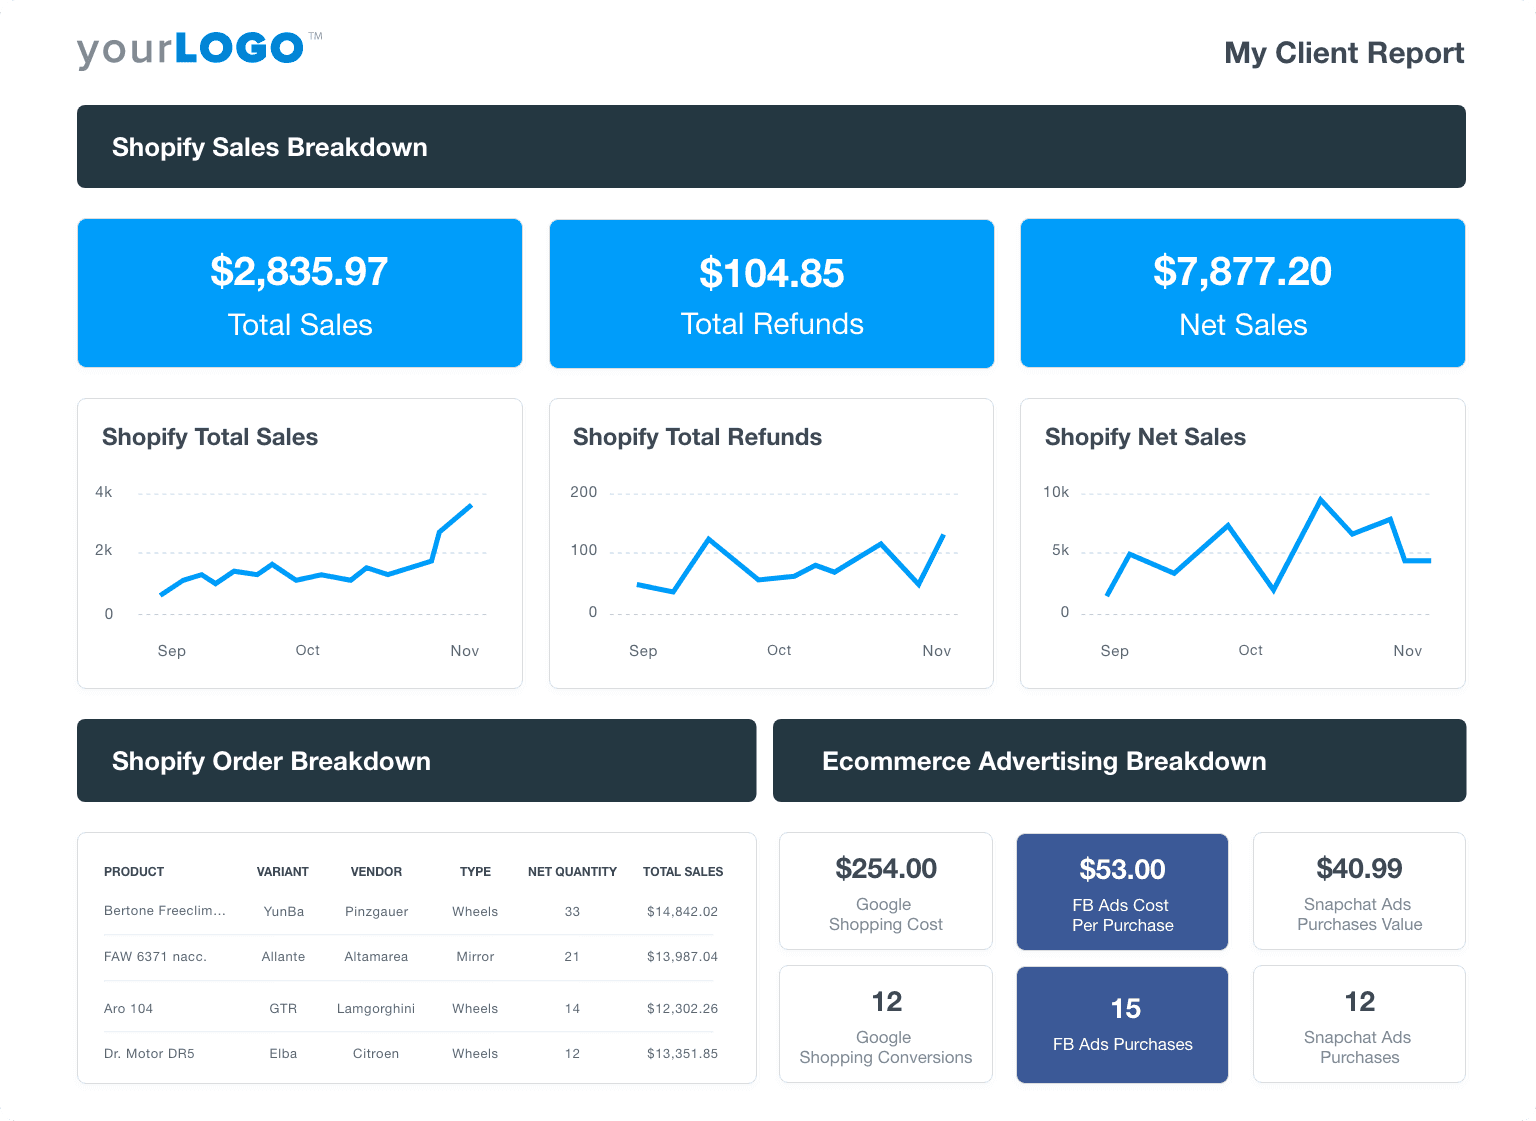
The ecommerce dashboard tracks sales performance, cart abandonment, and conversion funnels. It pulls data from platforms like Shopify and Google Analytics, offering one of the best dashboard examples for businesses focused on optimizing their online store’s performance.
Local SEO Dashboard
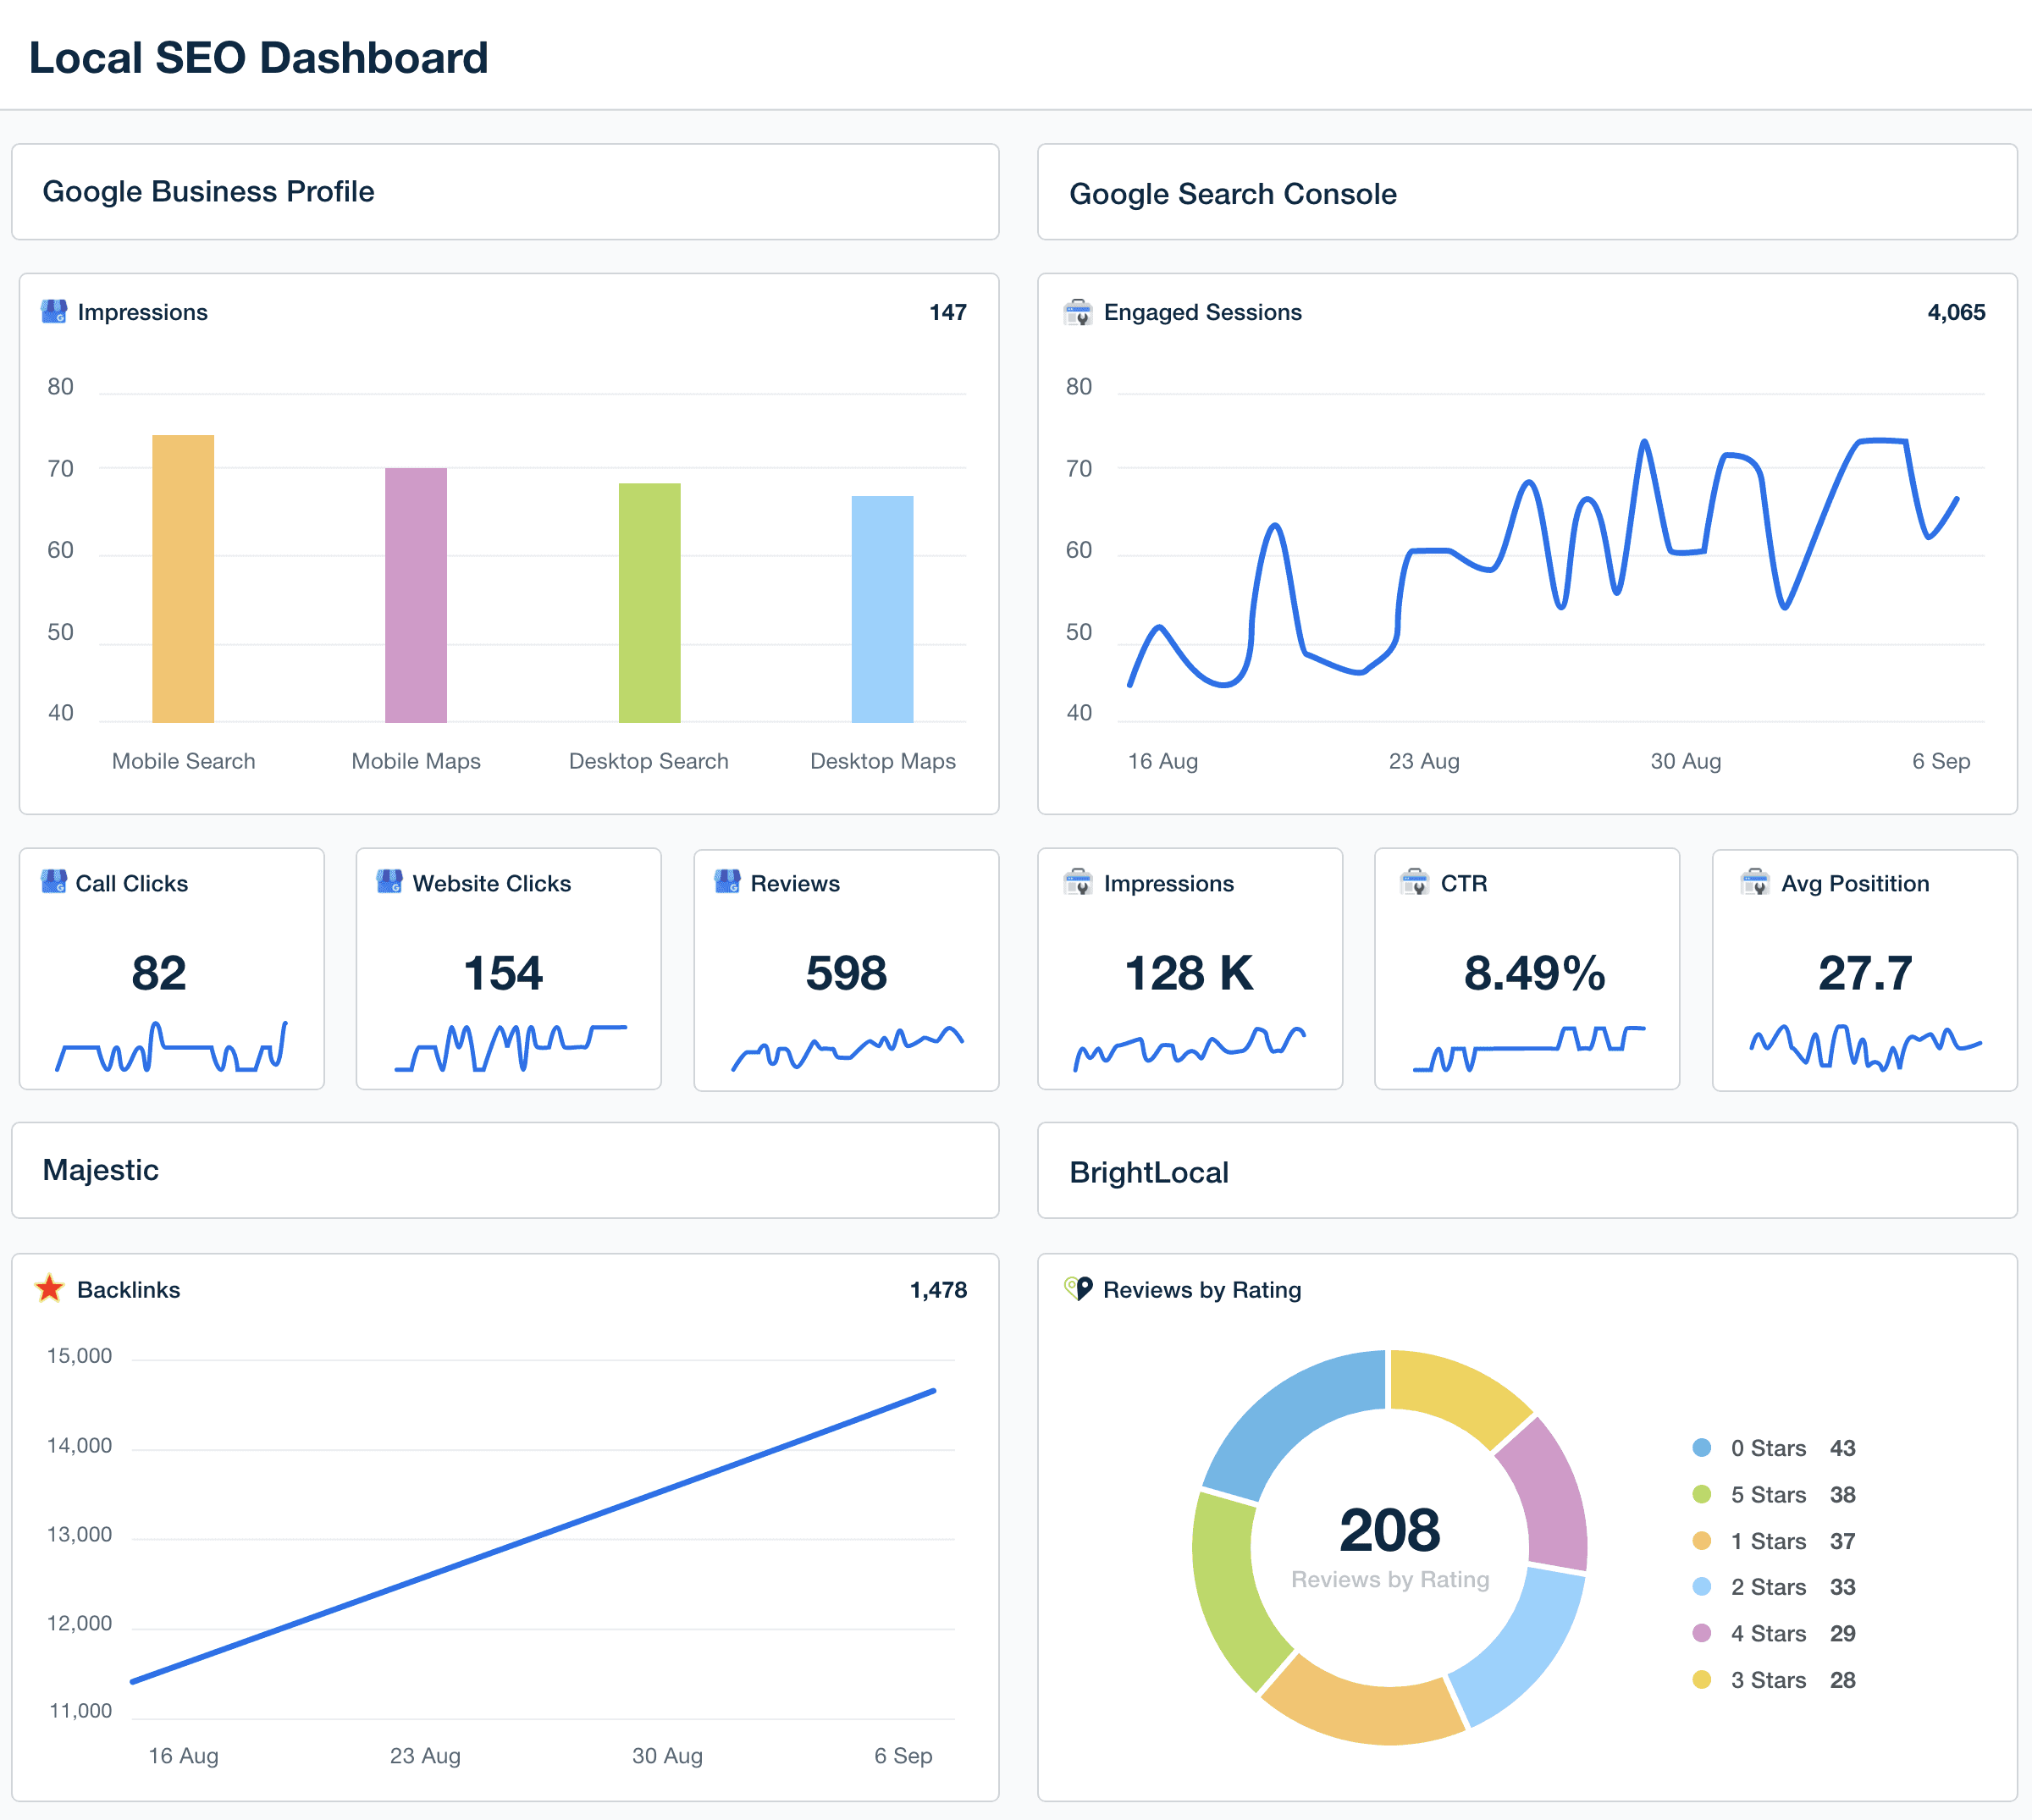
The local SEO dashboard tracks visibility and engagement for location-based businesses. It integrates data from Google Business Profile, Maps, and local citation sources to show how often customers find and interact with a client’s listings. Use it to monitor keyword rankings, customer reviews, and calls—everything you need for stronger local search performance.
Link-Building Dashboard
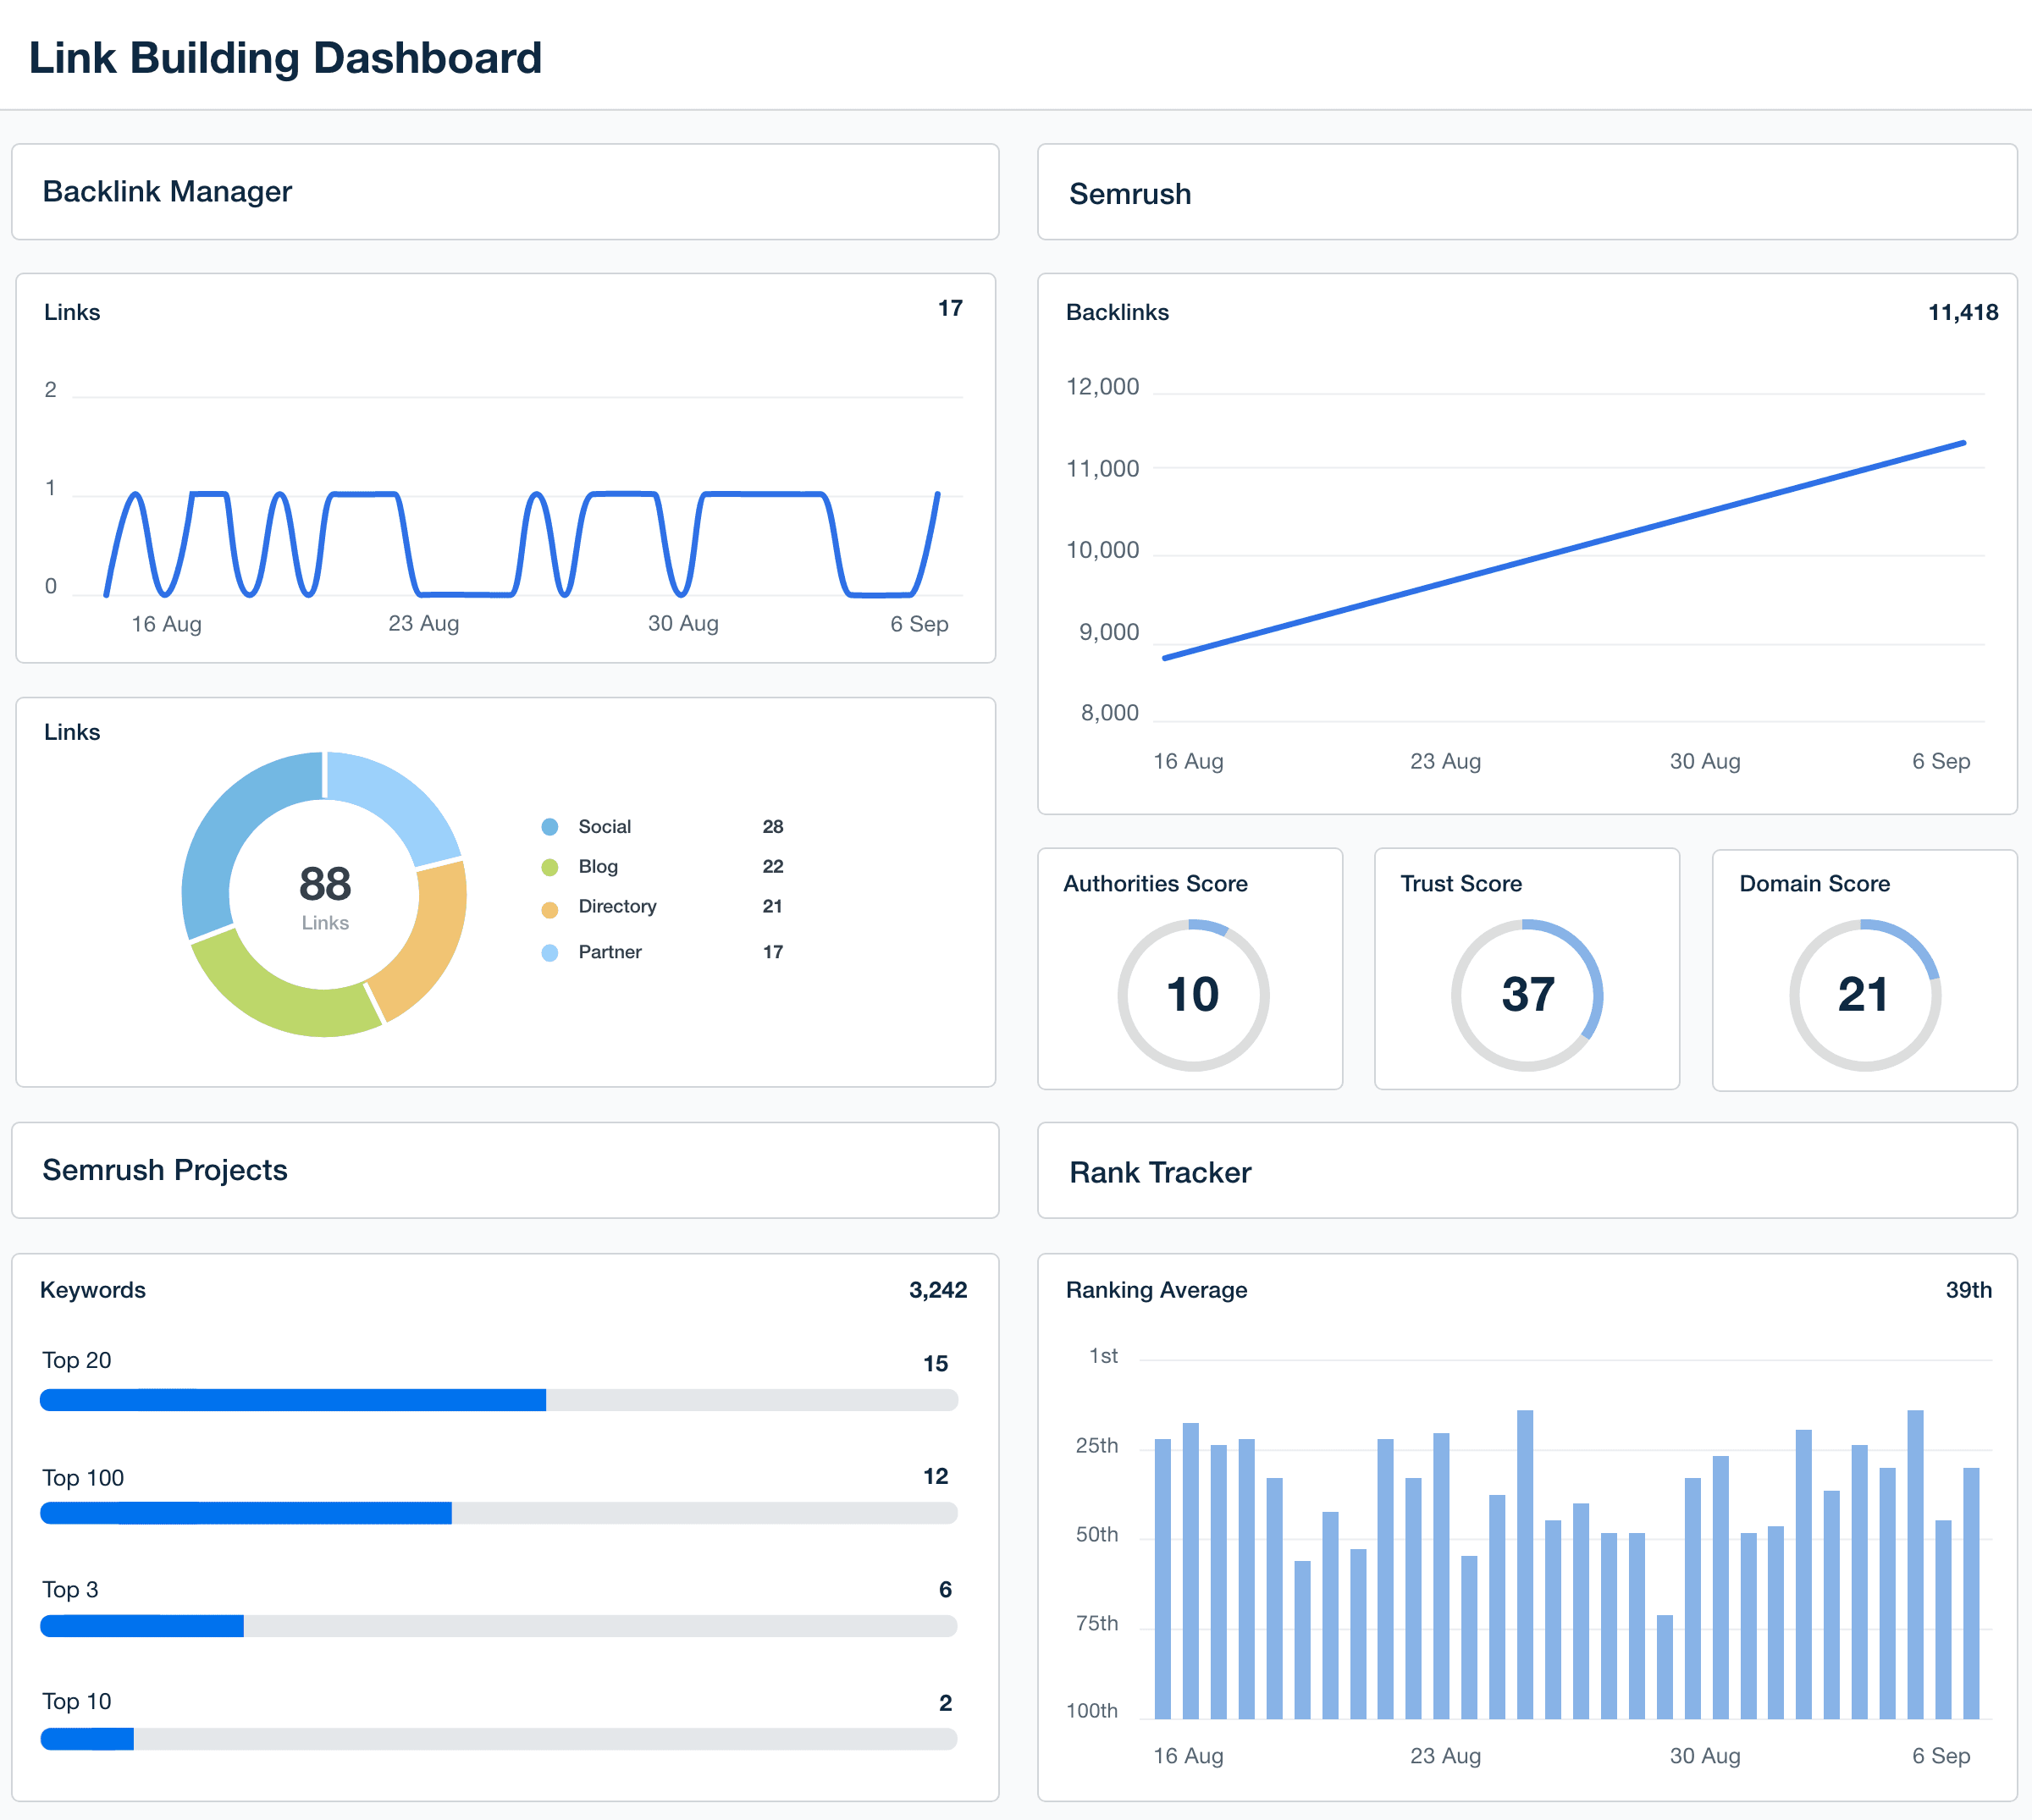
The link-building dashboard visualizes backlinks, referring domains, and domain authority trends in a single, easy-to-read layout. It’s ideal for SEO teams managing outreach campaigns. Monitor anchor text distribution, new vs. lost links, and link quality at a glance.
Client Dashboard
A client dashboard brings everything together for a unified, client-facing reporting experience. It consolidates cross-channel KPIs—SEO, PPC, social, and email—into one interactive hub. Agencies use it to enhance transparency, strengthen client relationships, and showcase performance clearly.
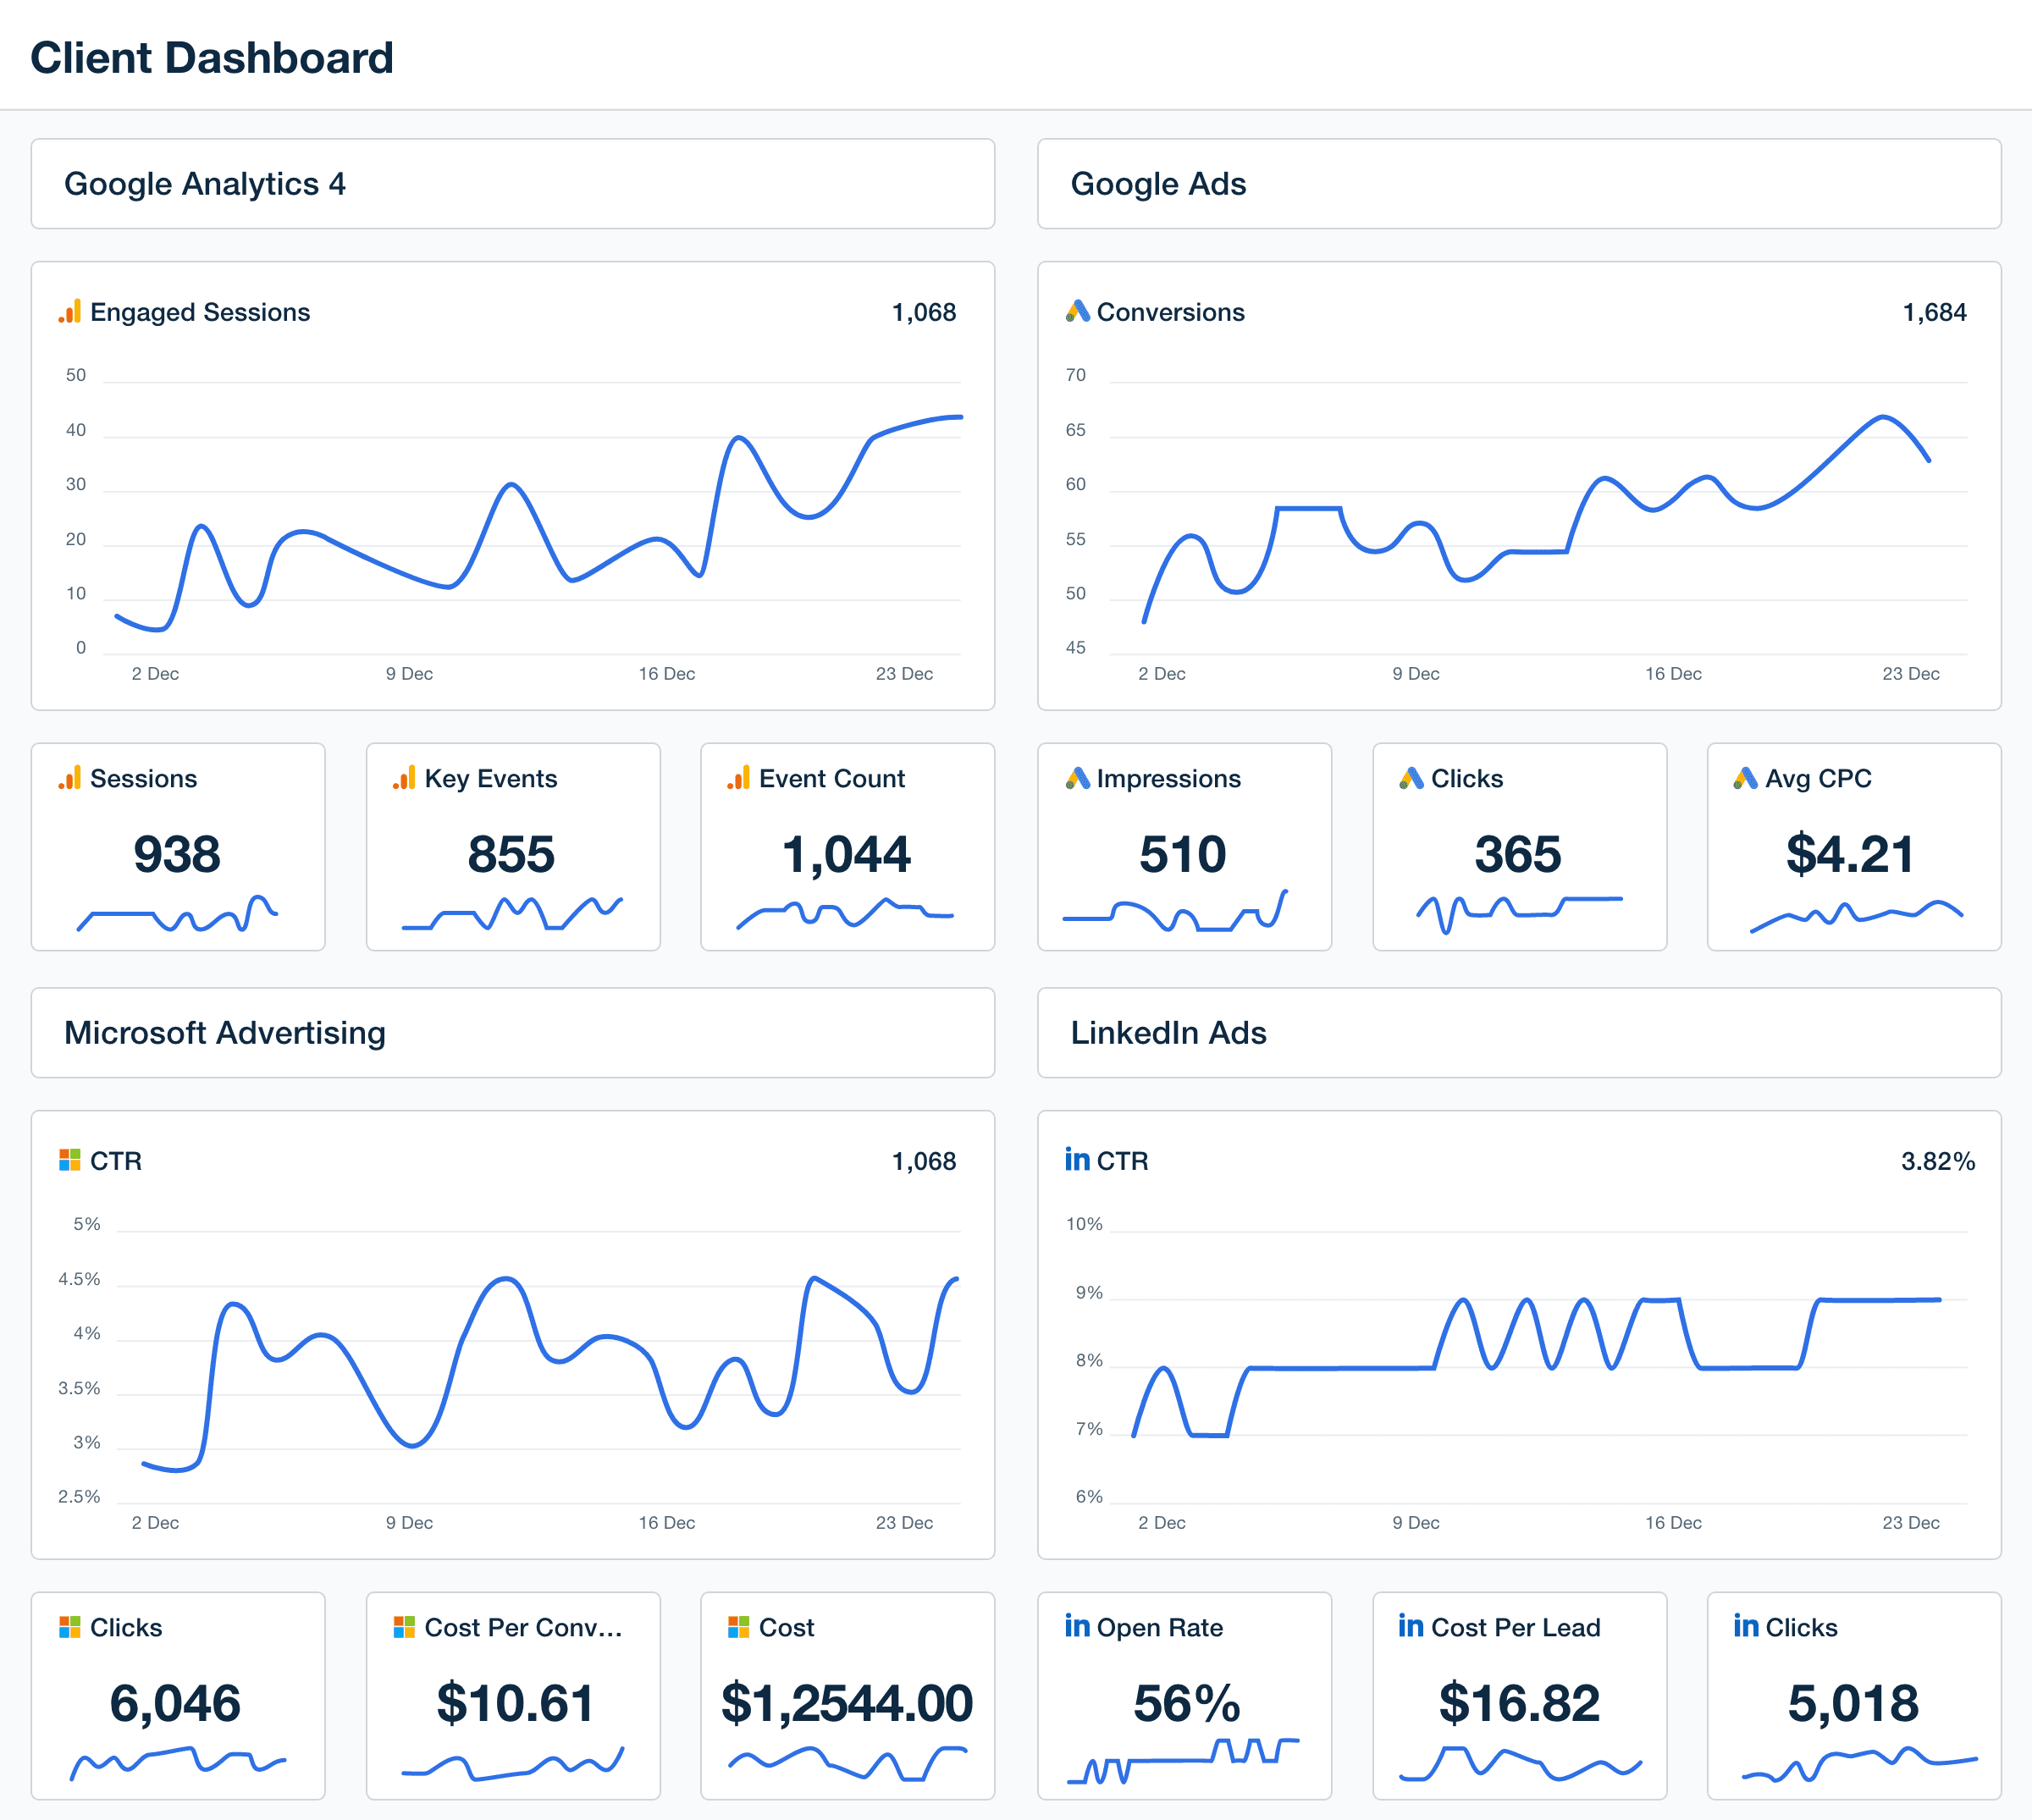
These multi-channel dashboards offer powerful tools to blend data from multiple sources, allowing agencies to gain actionable insights and make informed decisions across all marketing efforts.
But what if your agency focuses on one specific platform at a time? That’s where platform-specific dashboards come into play!
Platform-Specific Dashboard Examples
Platform-specific dashboards let agencies go deep. Each one highlights metrics unique to a platform, giving your team granular insight into campaign performance. Here’s how to build reporting dashboards that reveal each channel’s true impact.
When managing campaign performance, having the right platform-specific marketing dashboards makes all the difference. Each platform offers unique insights, so it’s key to use dashboards that can pull the right data to help you make data-driven decisions.
Here’s a quick look at some of the most popular platform-specific dashboards and how they help agencies track everything from sales data to revenue growth.
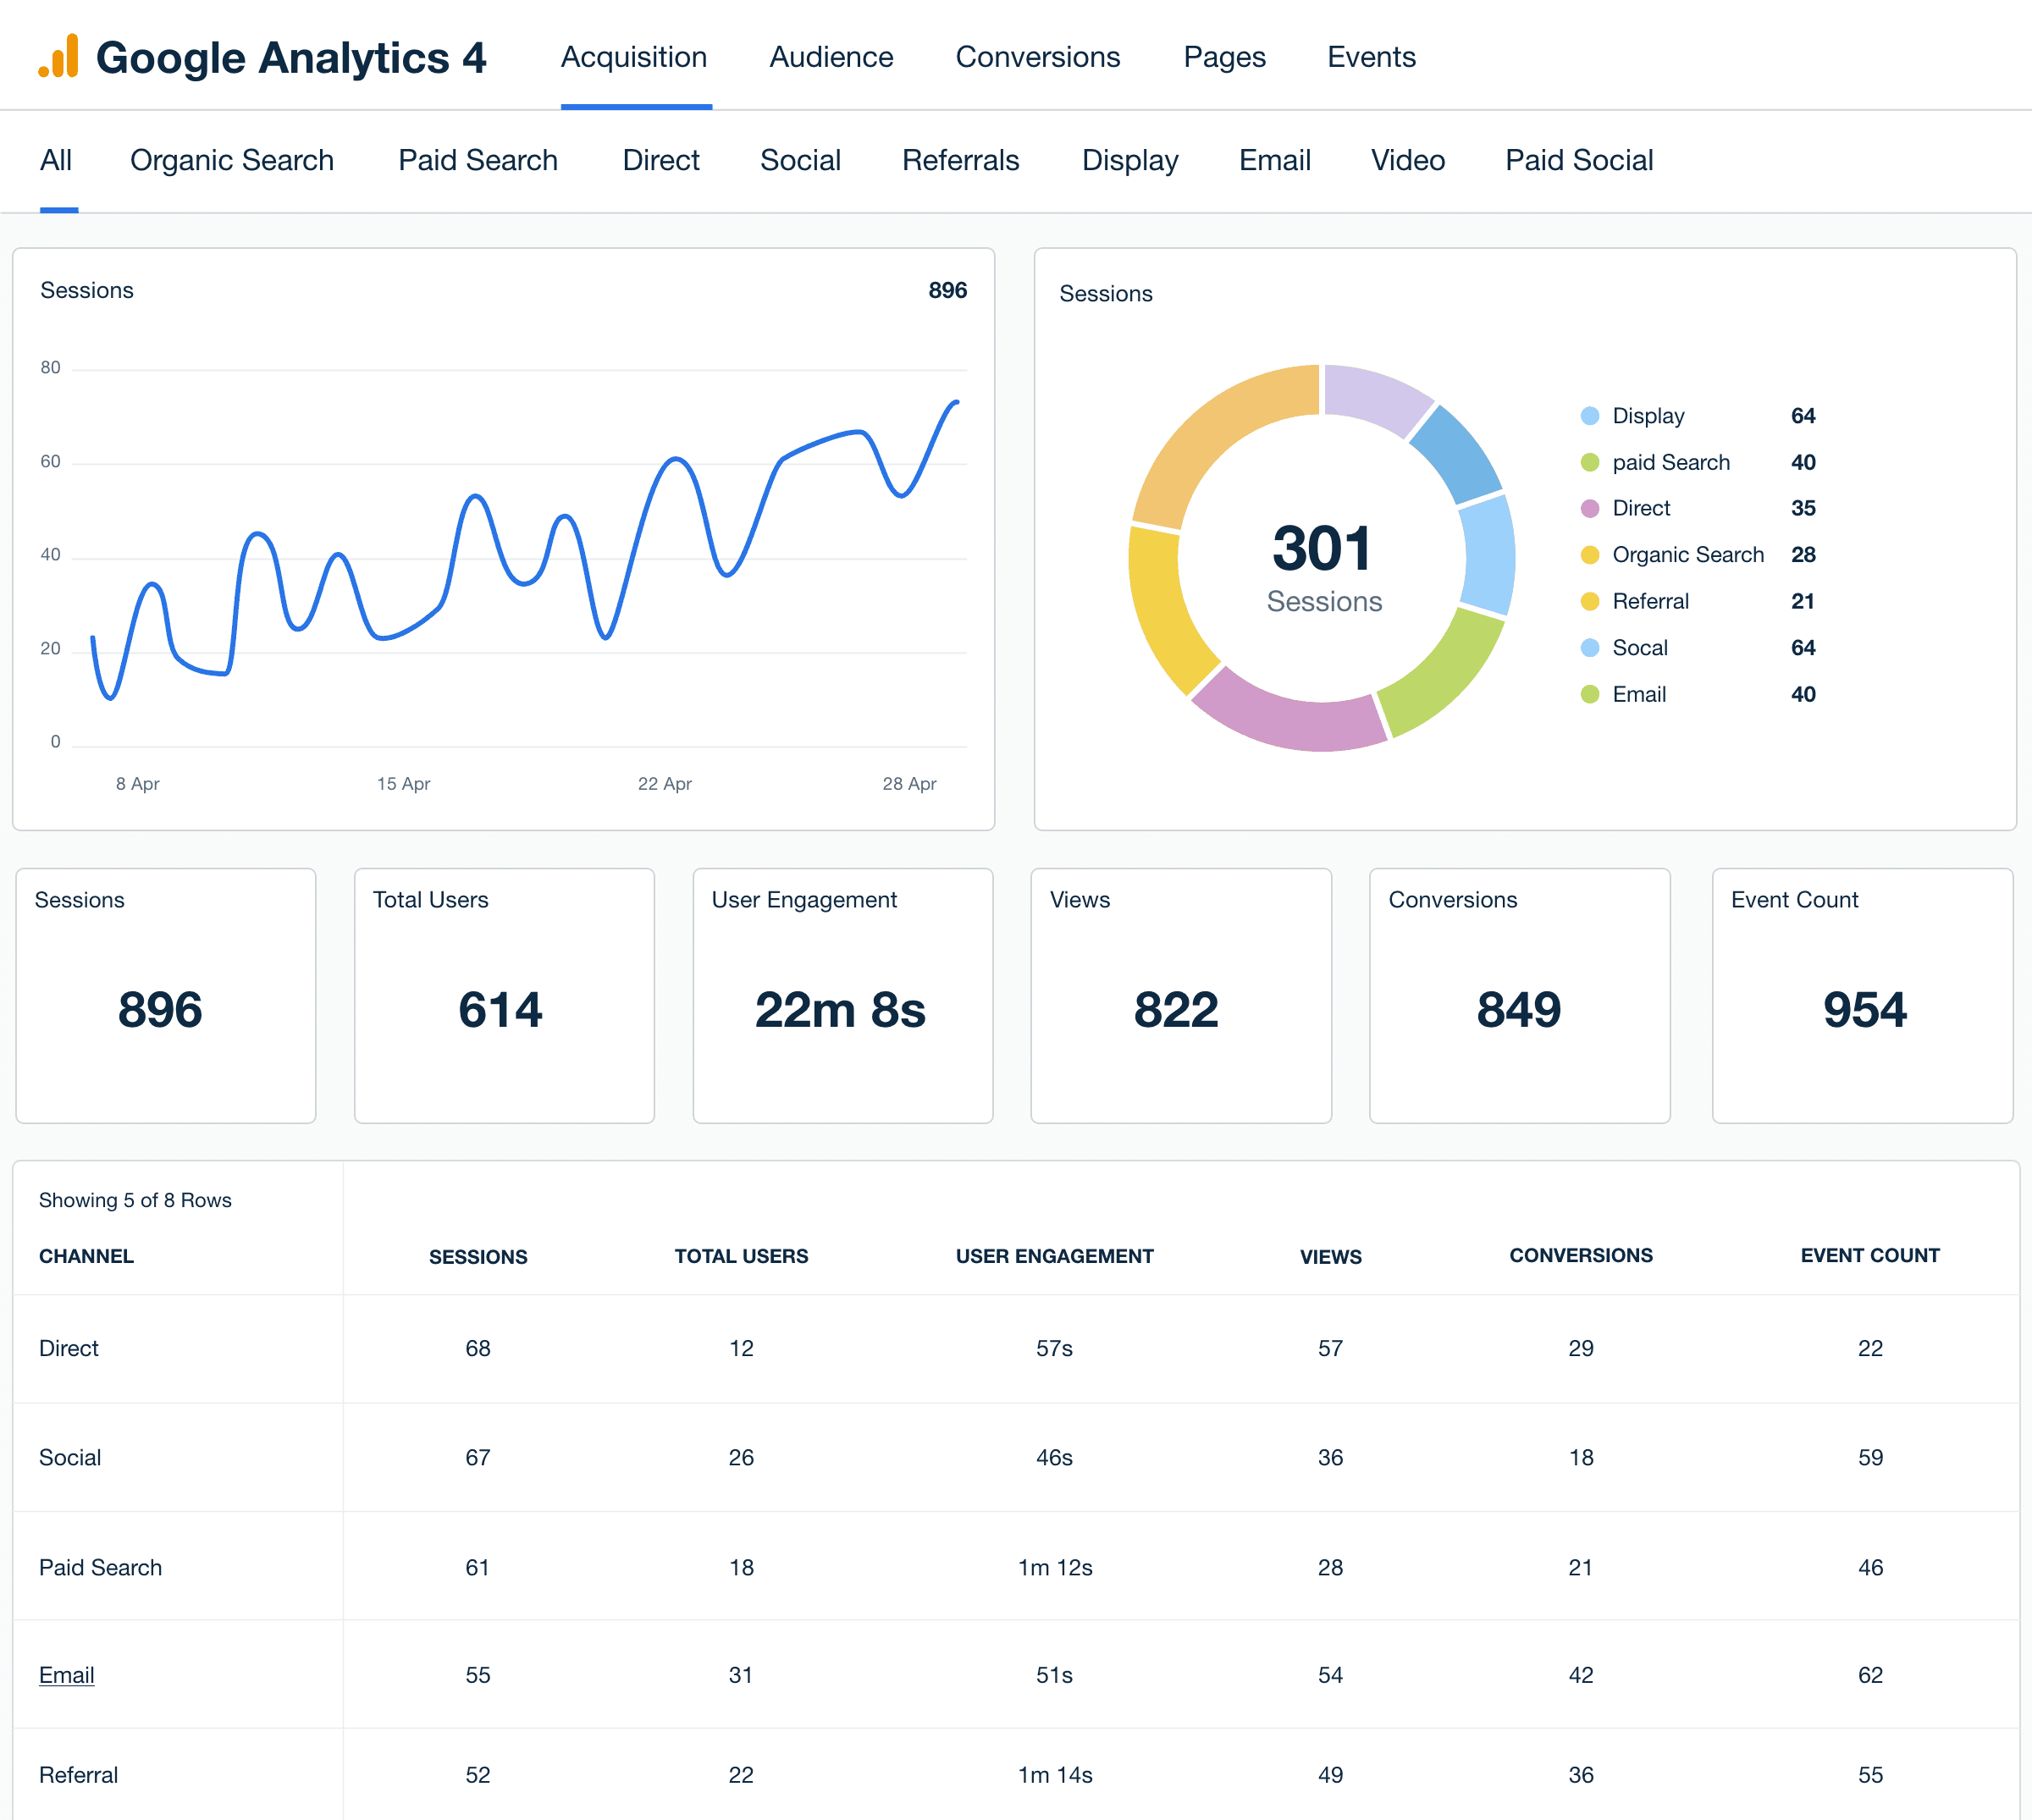
Google Analytics Dashboard
The Google Analytics dashboard offers a complete view of site traffic, engagement, and conversion performance. It visualizes how users arrive, interact, and convert, helping agencies refine pages, UX, and marketing funnels based on data-driven insight.
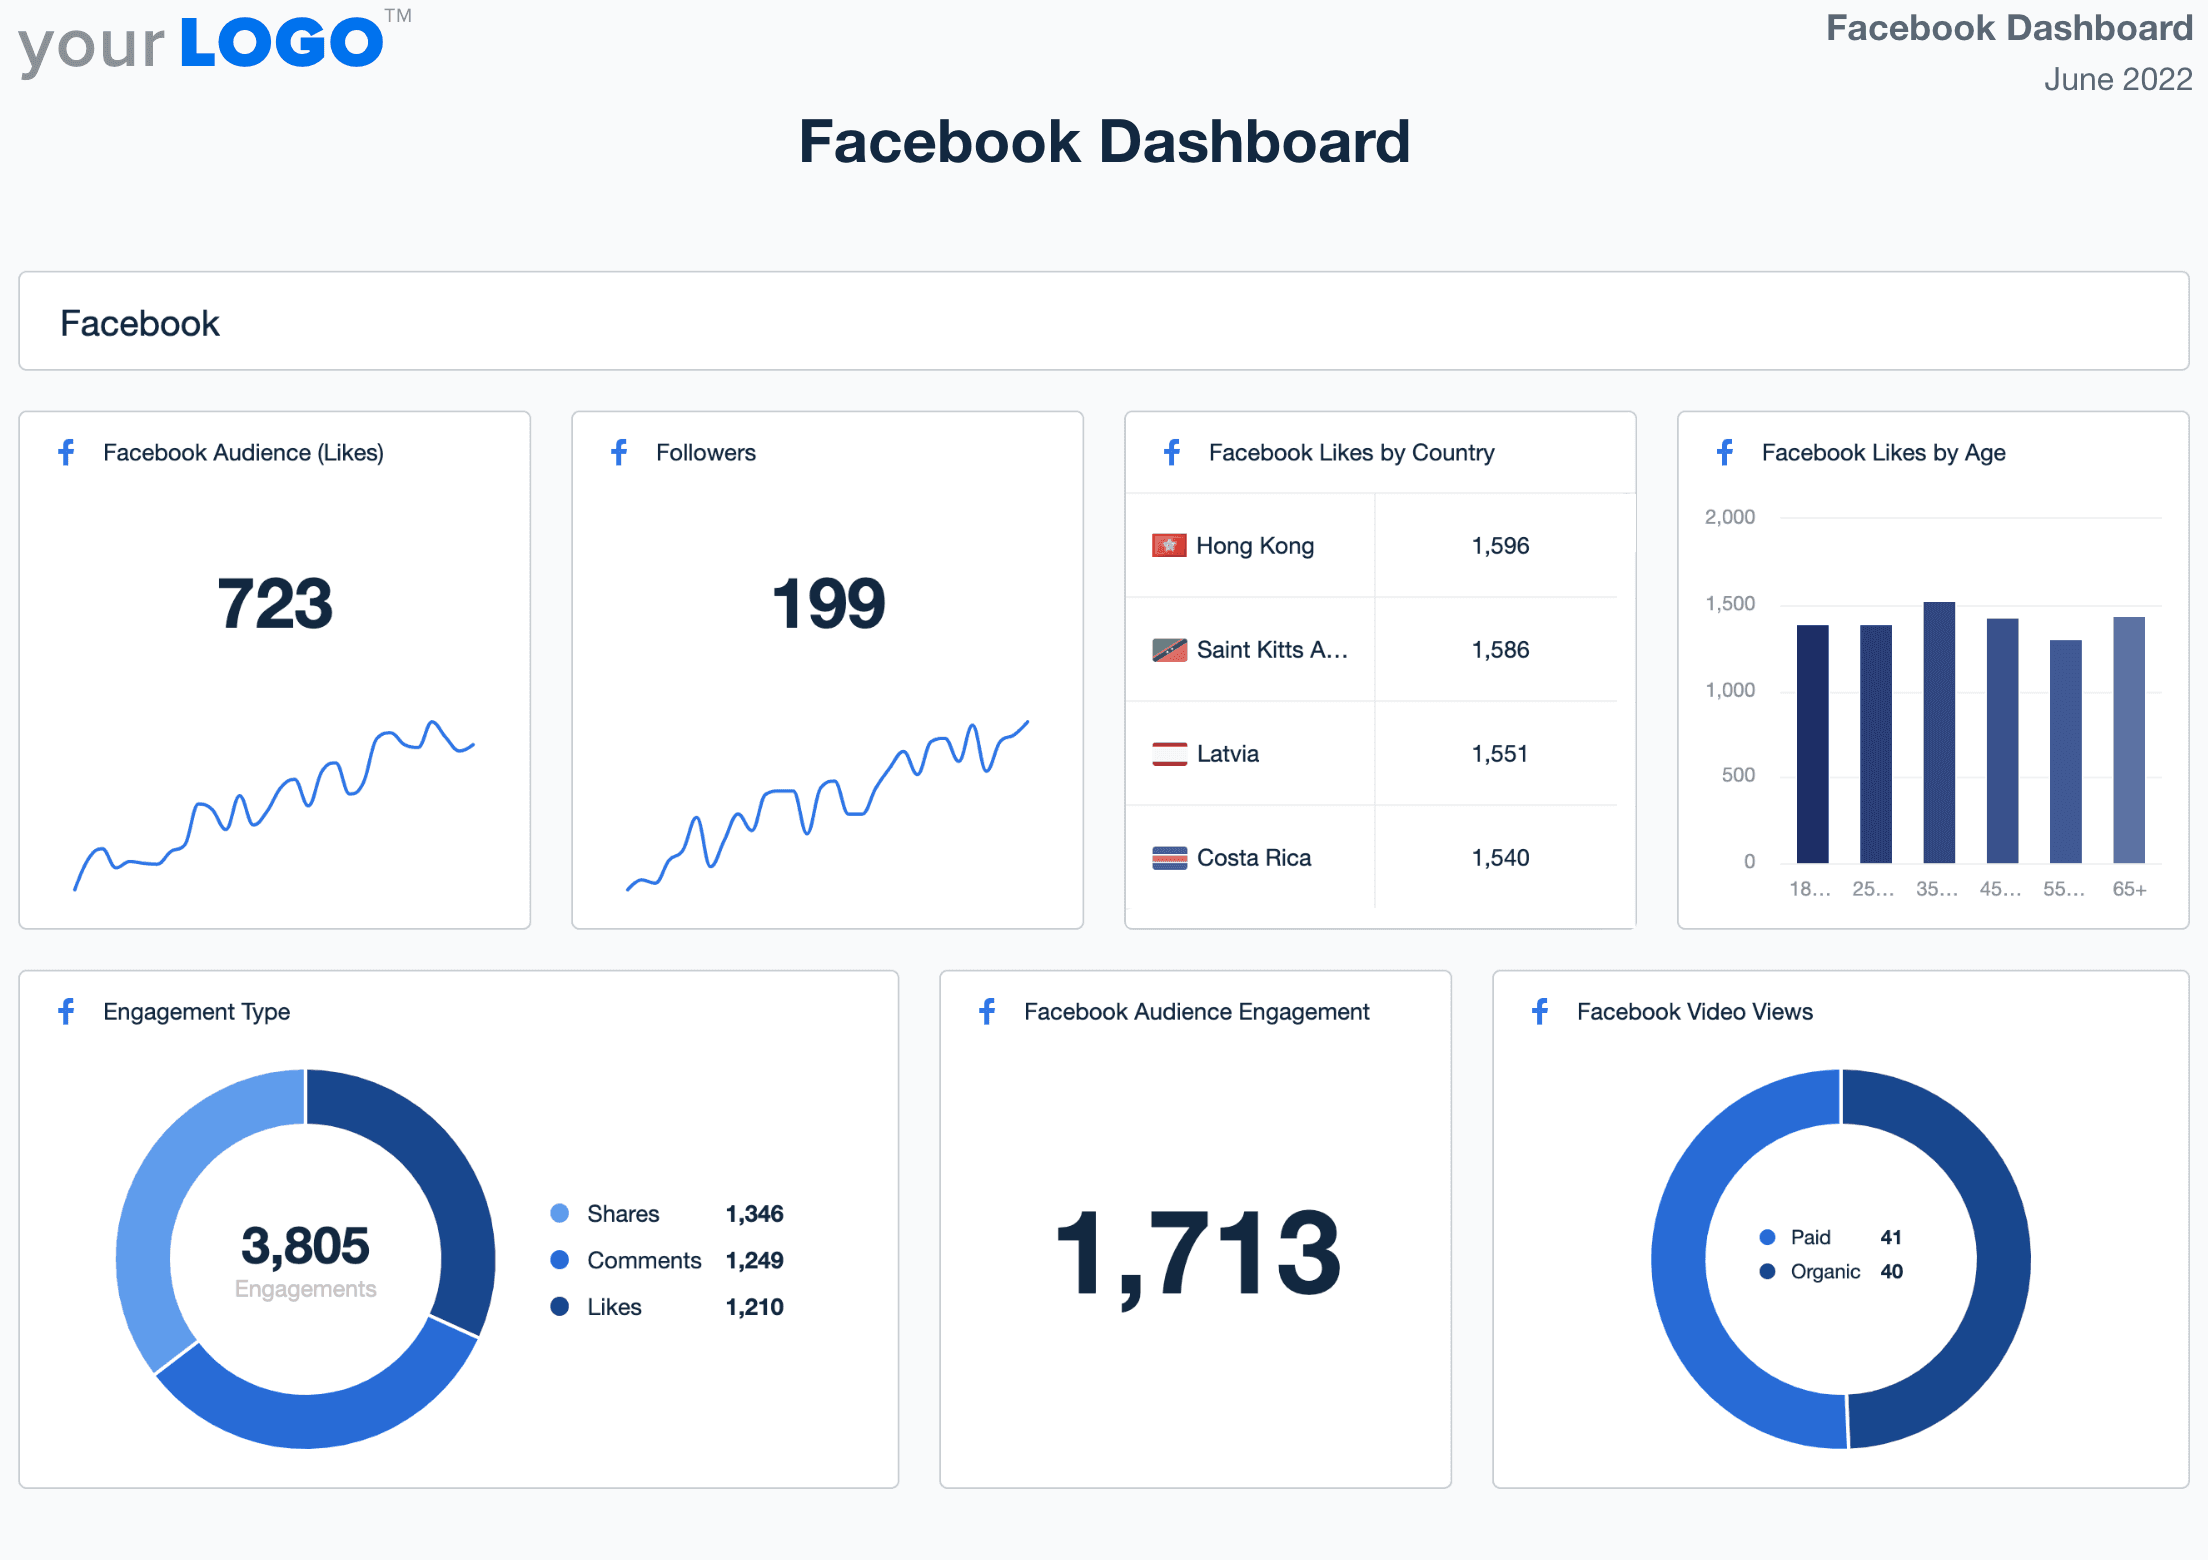
Facebook Dashboard
The Facebook dashboard provides a complete overview of your client’s Facebook page performance. Track engagement, follower growth, and post reach, making it easier to see which content works and where improvements are needed to keep the audience engaged.
With visual charts and trend lines, agencies quickly evaluate campaign resonance and improve creative strategy.
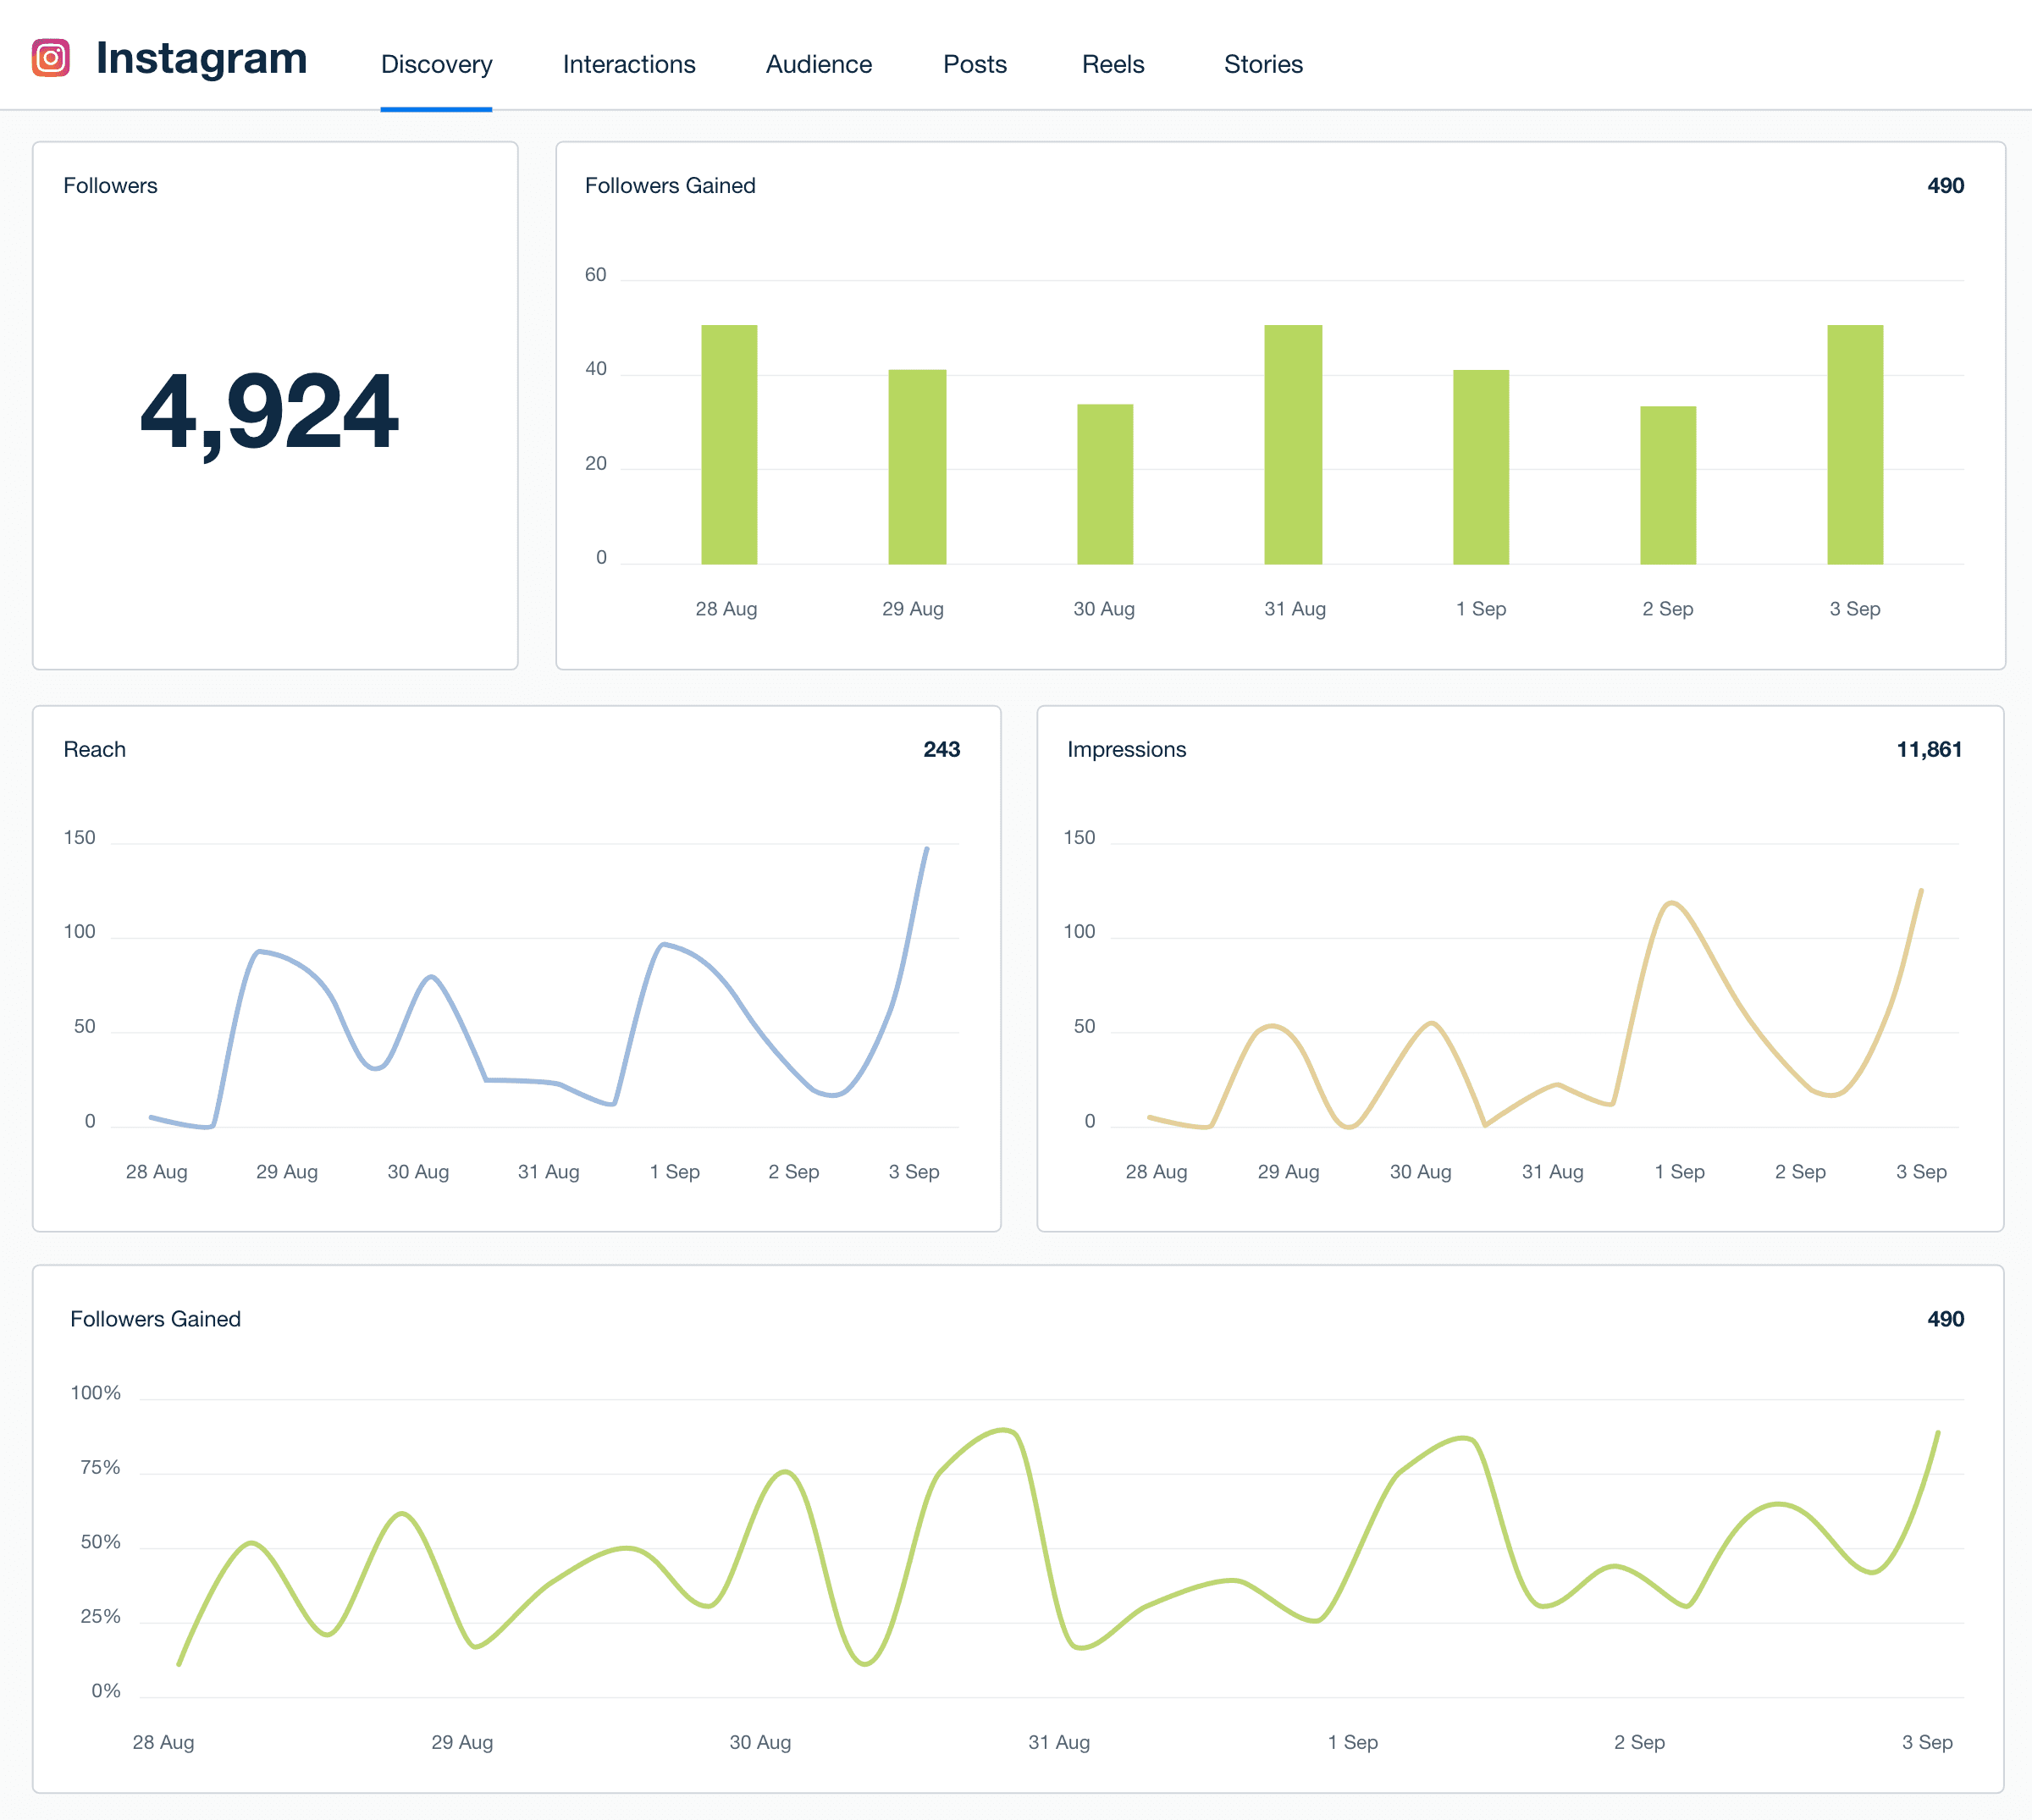
Instagram Dashboard
An Instagram dashboard helps track your client’s profile performance, including engagement rates, follower growth, and the success of Stories and posts. It’s ideal for seeing what content is resonating with the target audience and adjusting your marketing strategy in real time.
An Instagram dashboard helps agencies visually identify what’s working, perfect the balance between content types, and maintain a cohesive social aesthetic.
Facebook Ads Dashboard
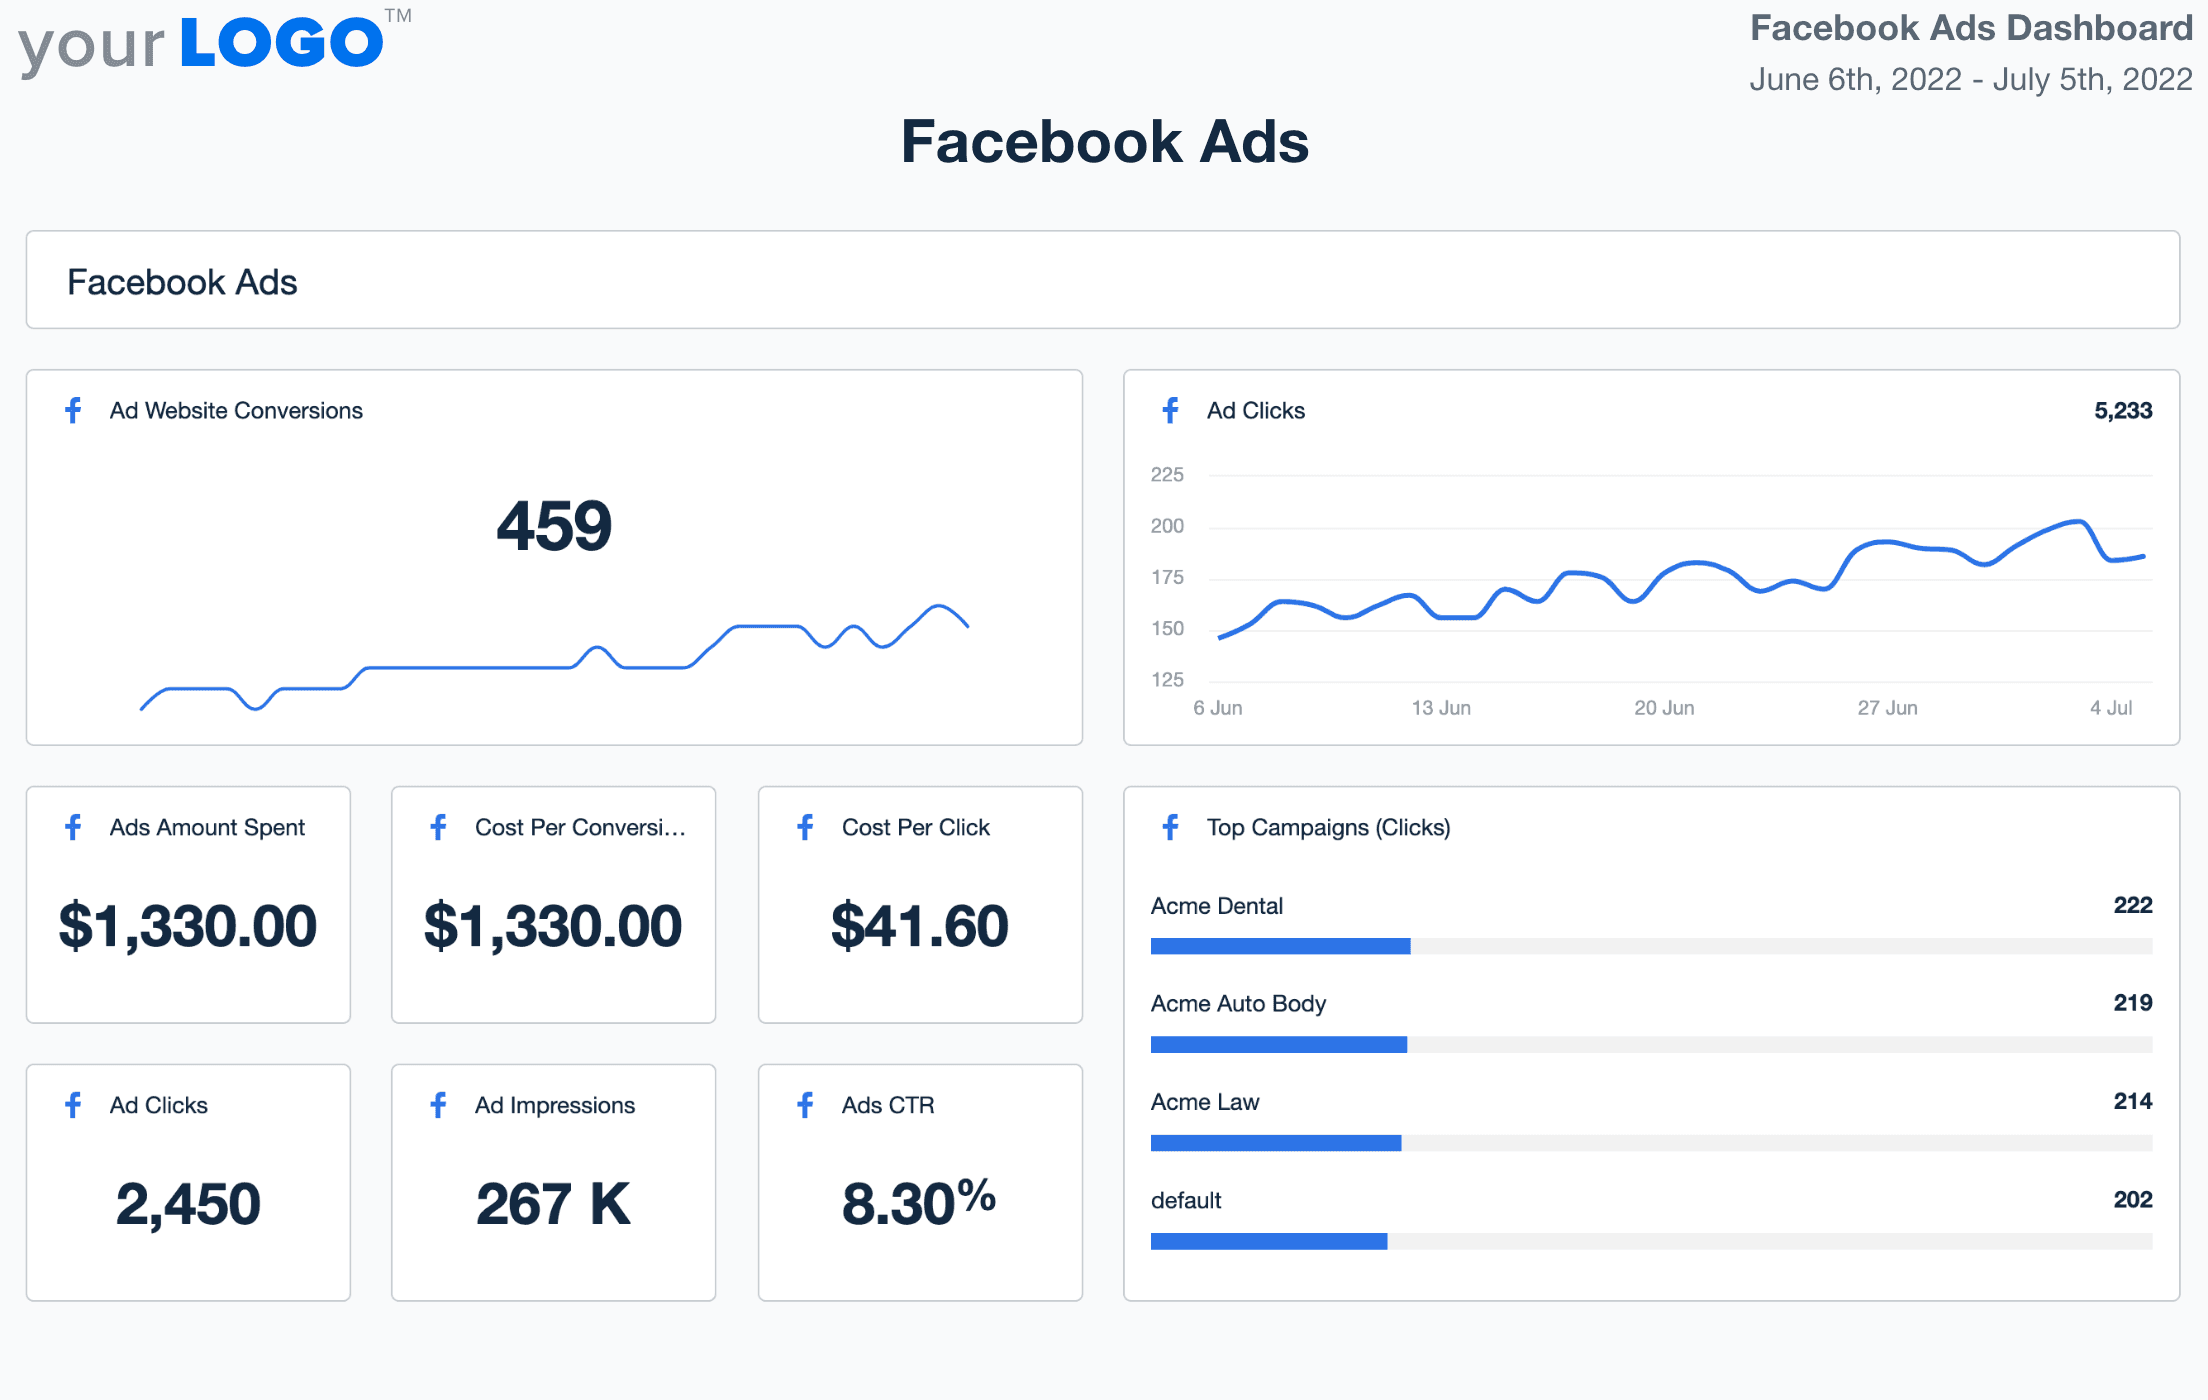
The Facebook Ads dashboard is perfect for monitoring ad performance, including impressions, click-through rates, and cost-per-click. It allows you to track ad spend and performance across campaigns, helping you optimize for better ROI.
Google Ads Dashboard
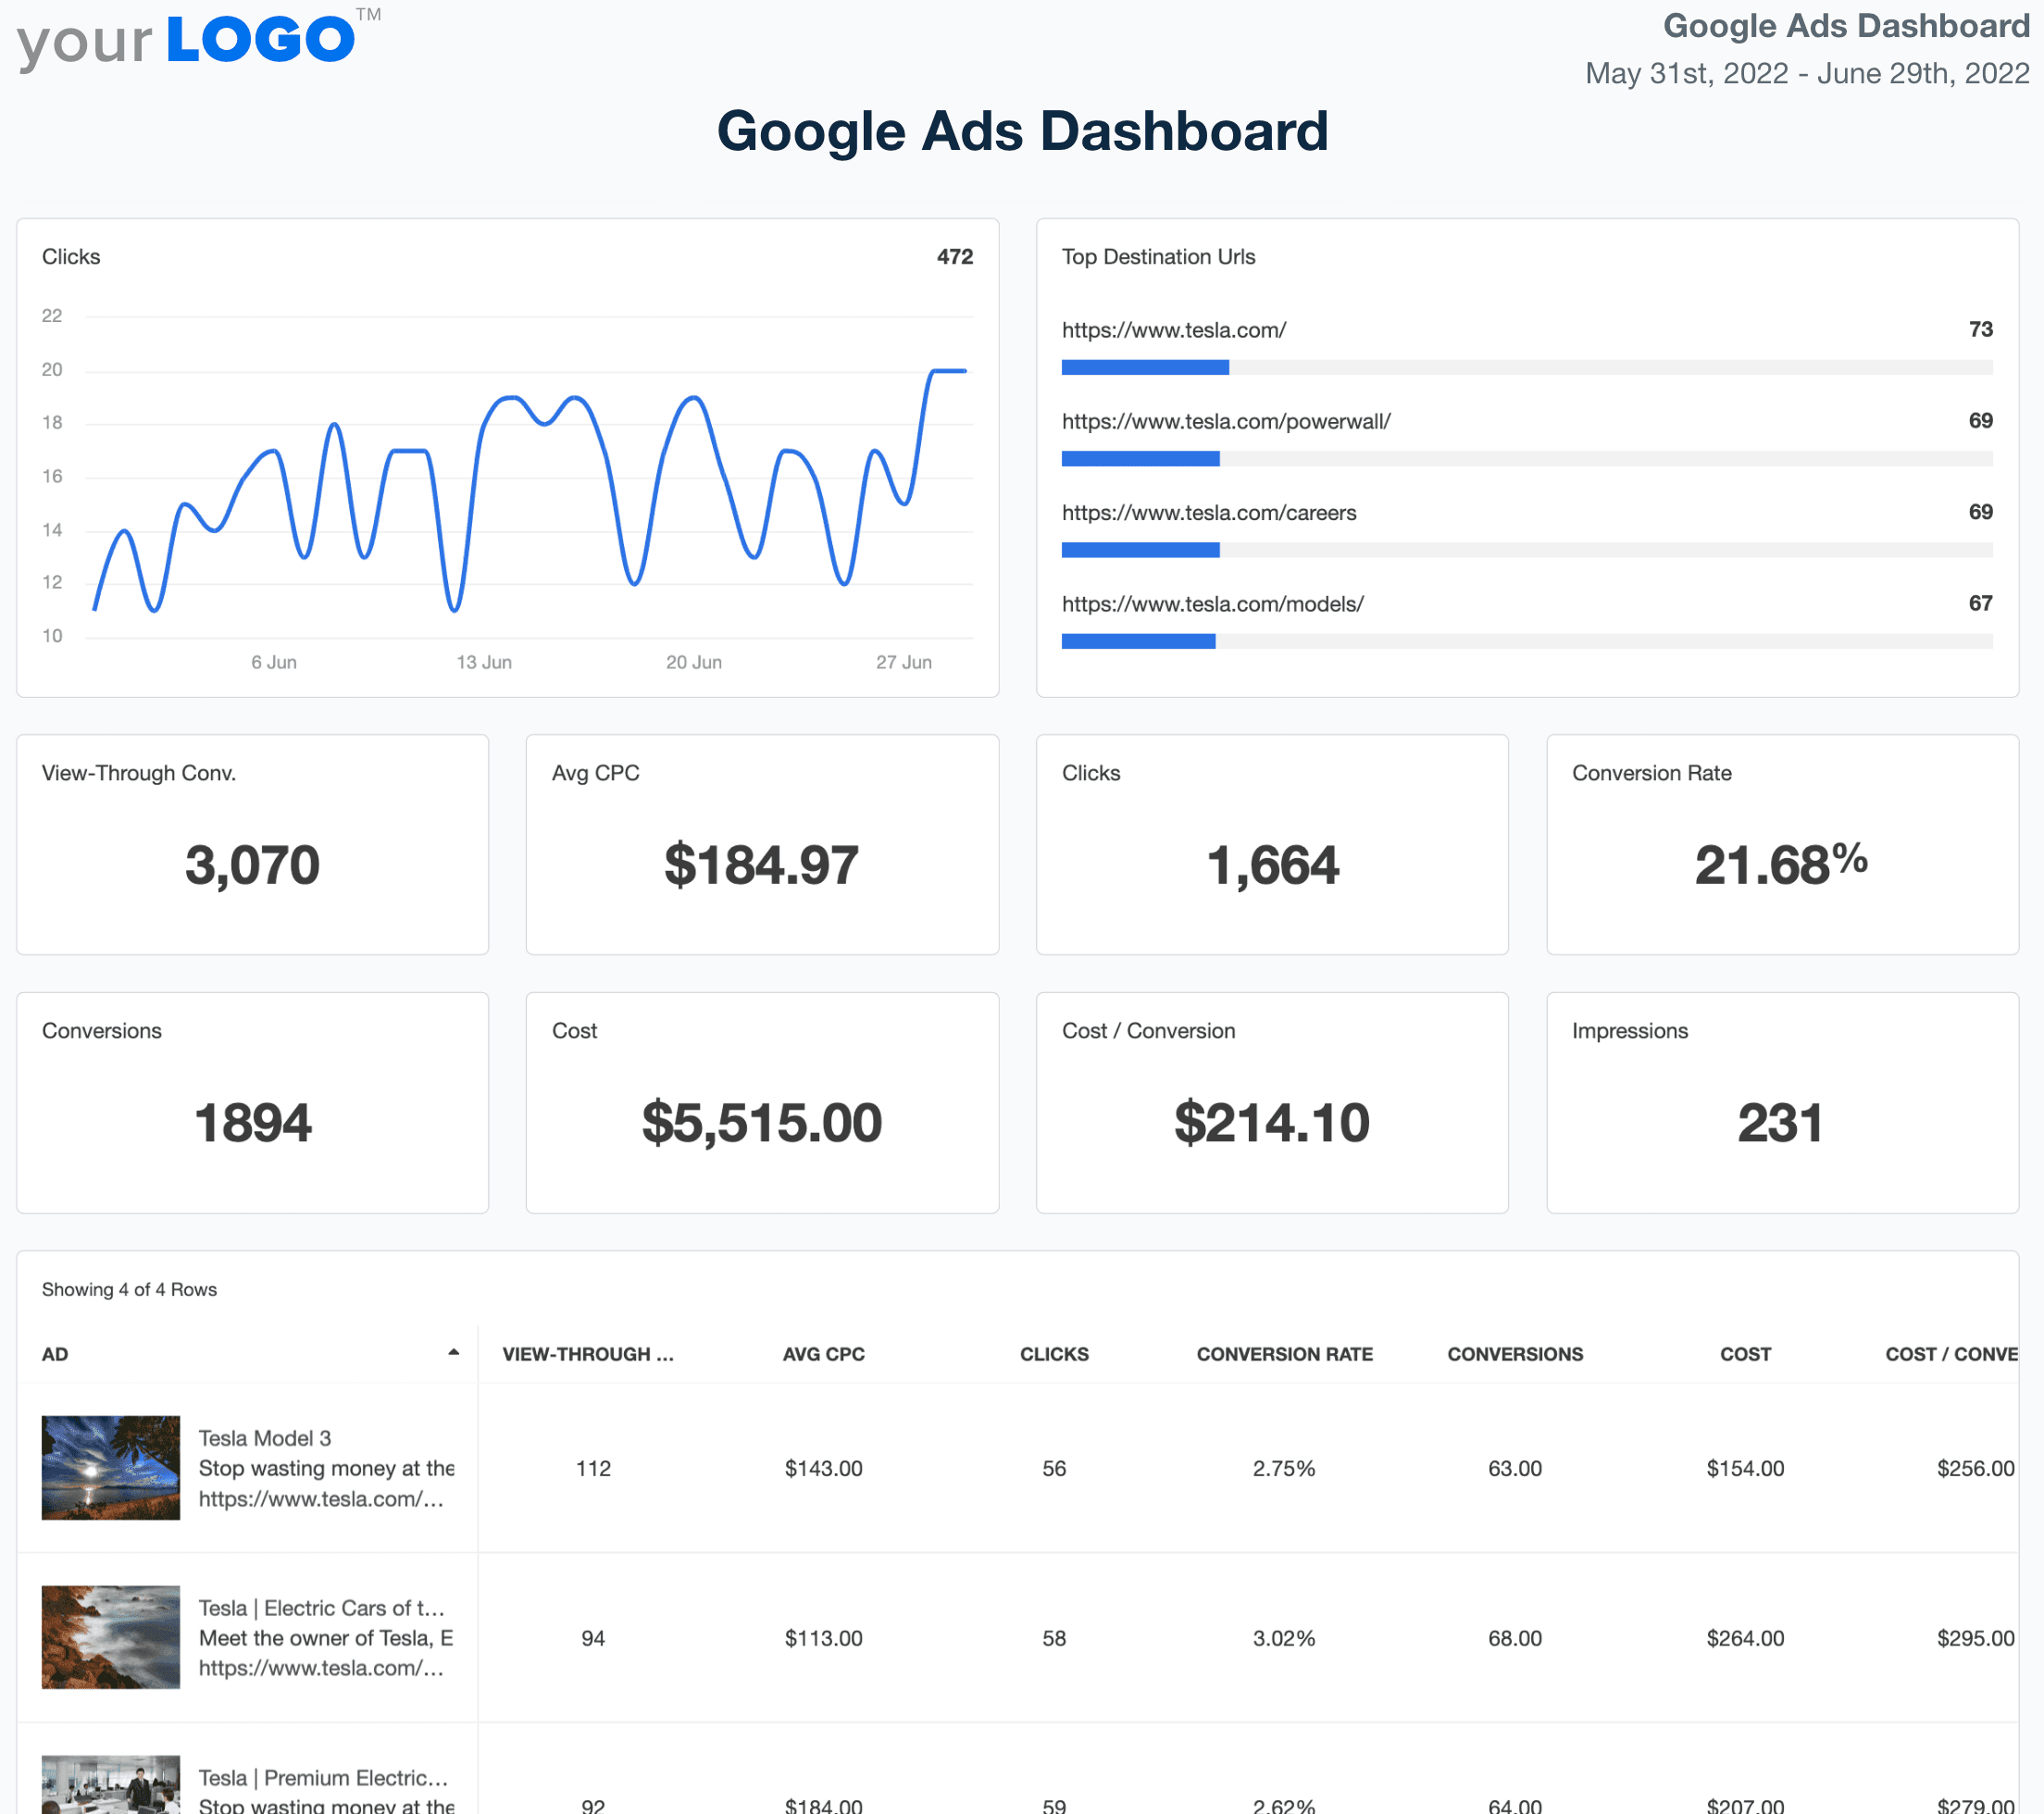
With a Google Ads dashboard, you get real-time insights into your client’s paid search campaigns. It tracks ad spend, click-through rates, and conversion metrics, helping you make quick adjustments to boost performance and get the most out of your campaigns.
Shopify Dashboard
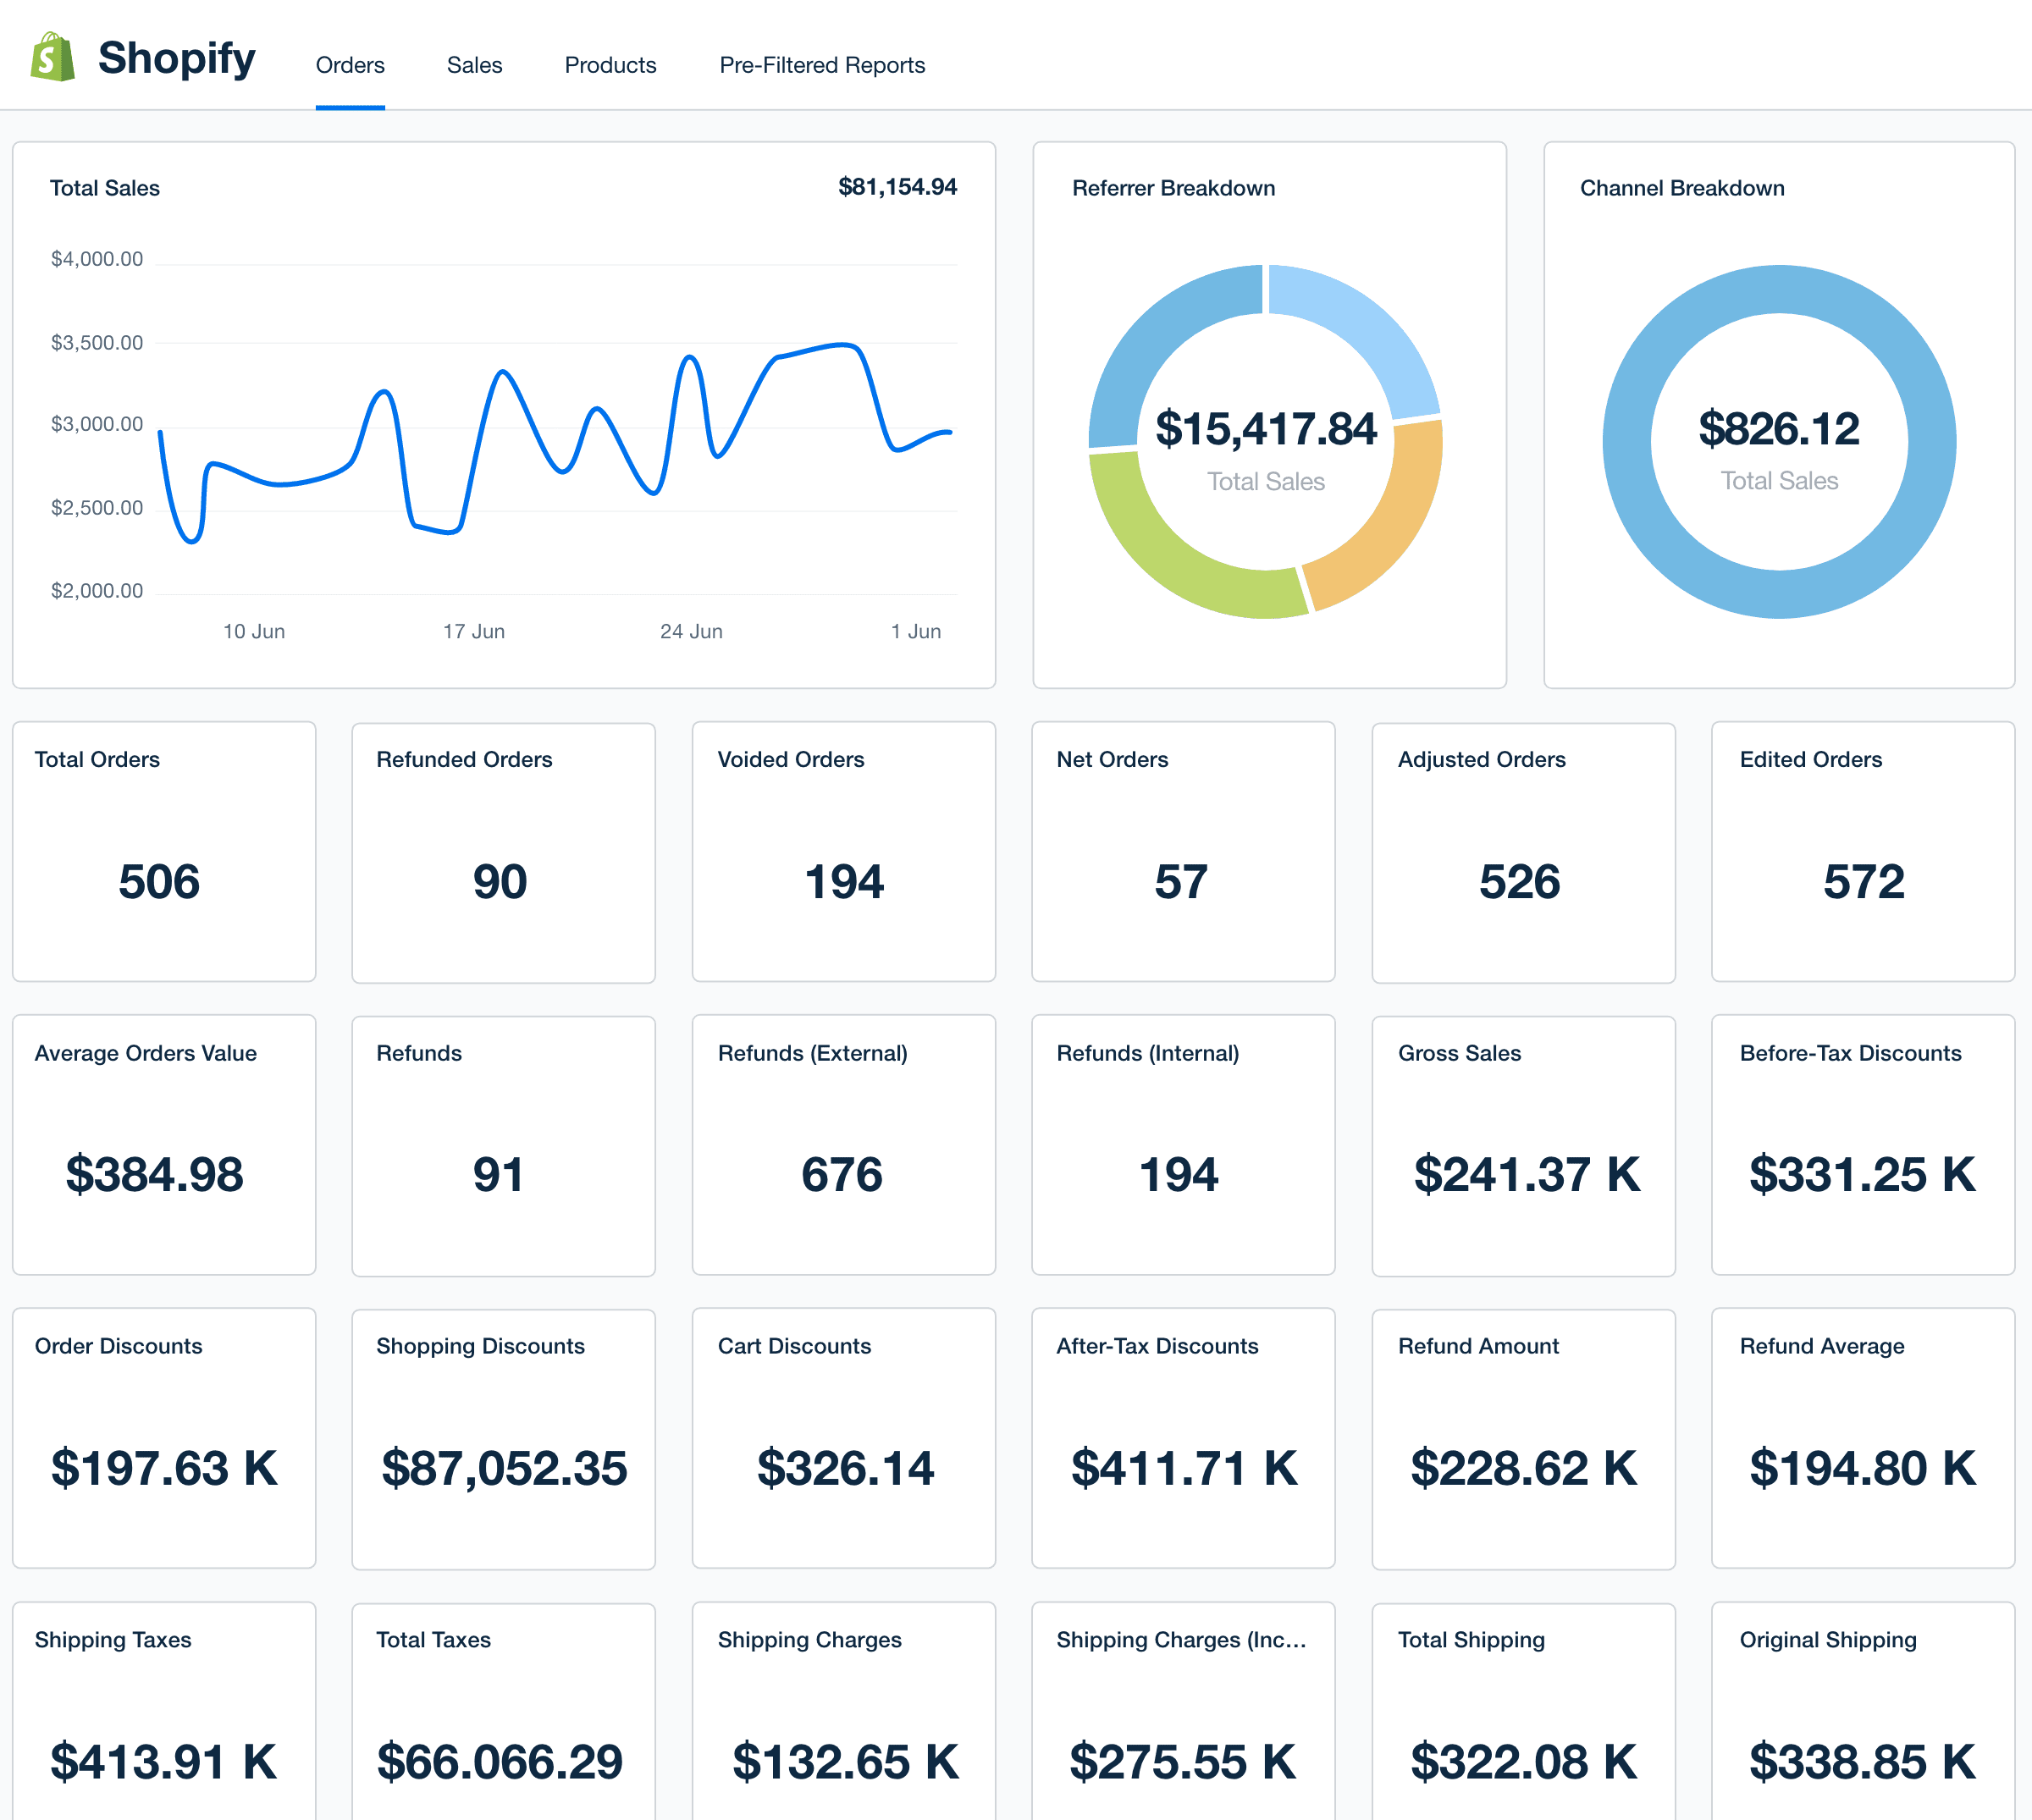
The Shopify dashboard focuses on tracking ecommerce performance. It pulls in sales data, order volume, and customer insights, making it easier to spot trends, measure financial performance, and plan for revenue growth.
HubSpot Dashboard
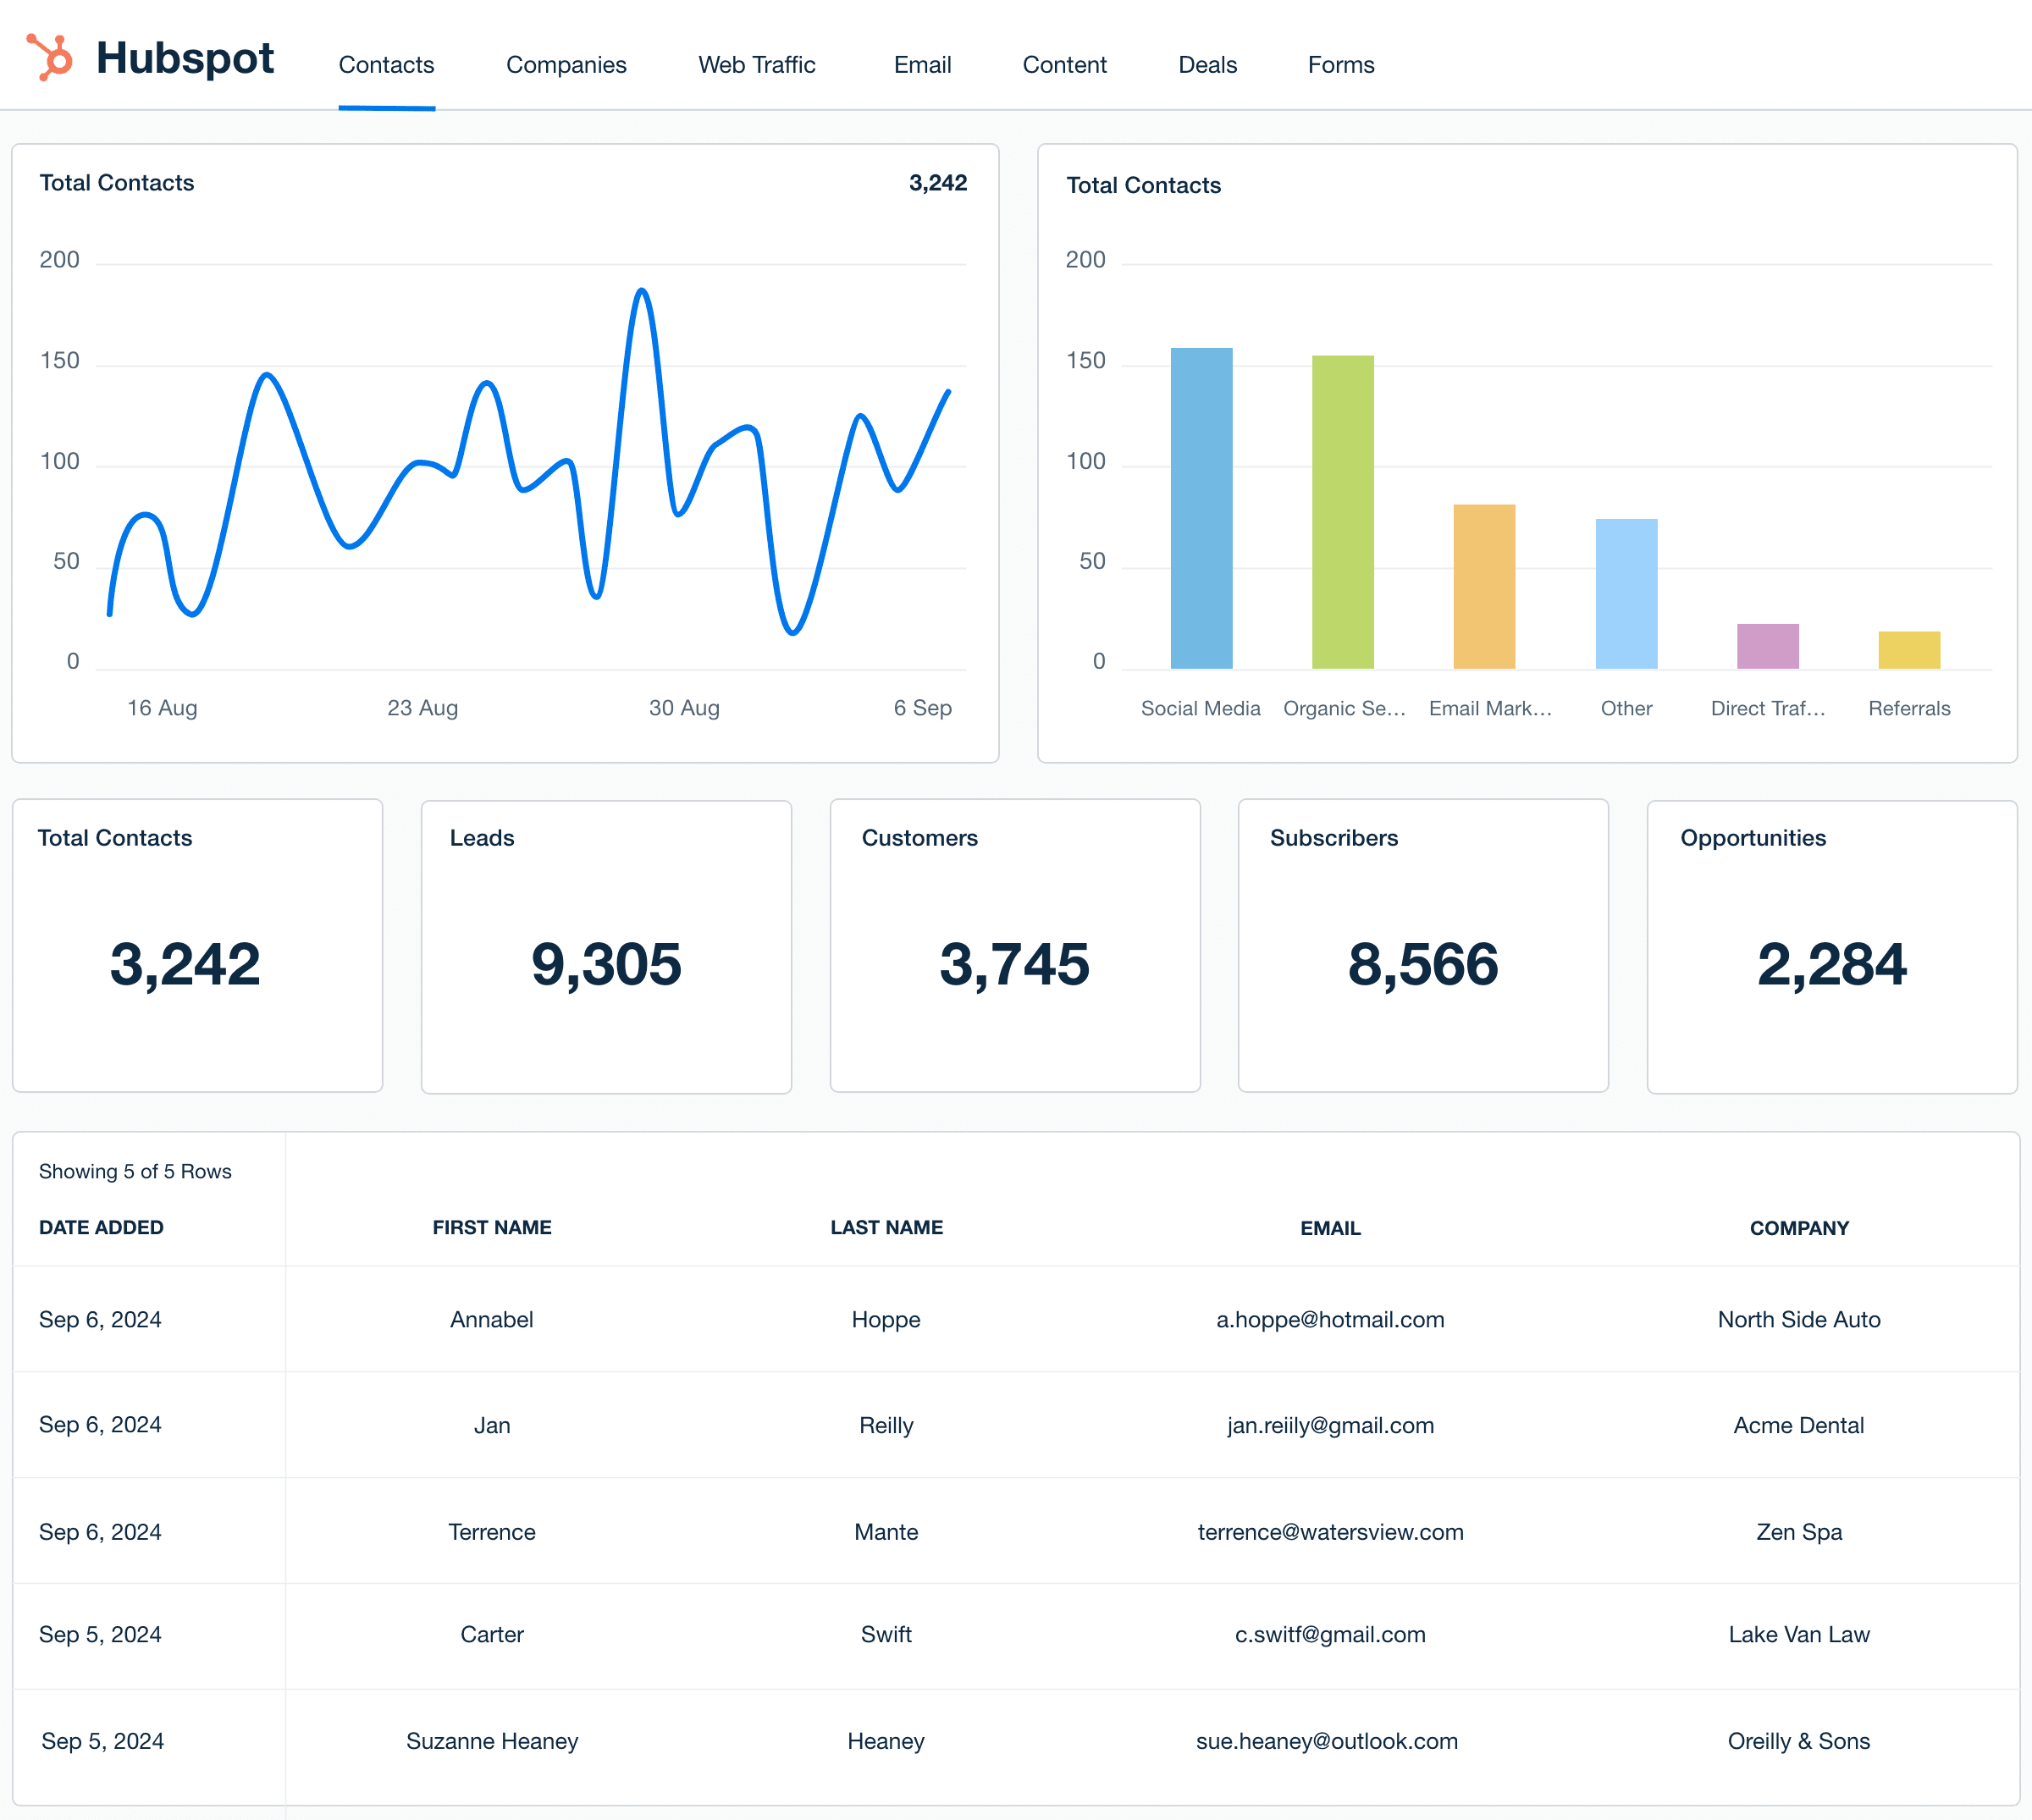
A custom HubSpot dashboard gives you a complete view of your client’s inbound marketing efforts. From tracking email marketing campaigns to monitoring website leads, it helps you manage multiple aspects of your marketing funnel all in one place.
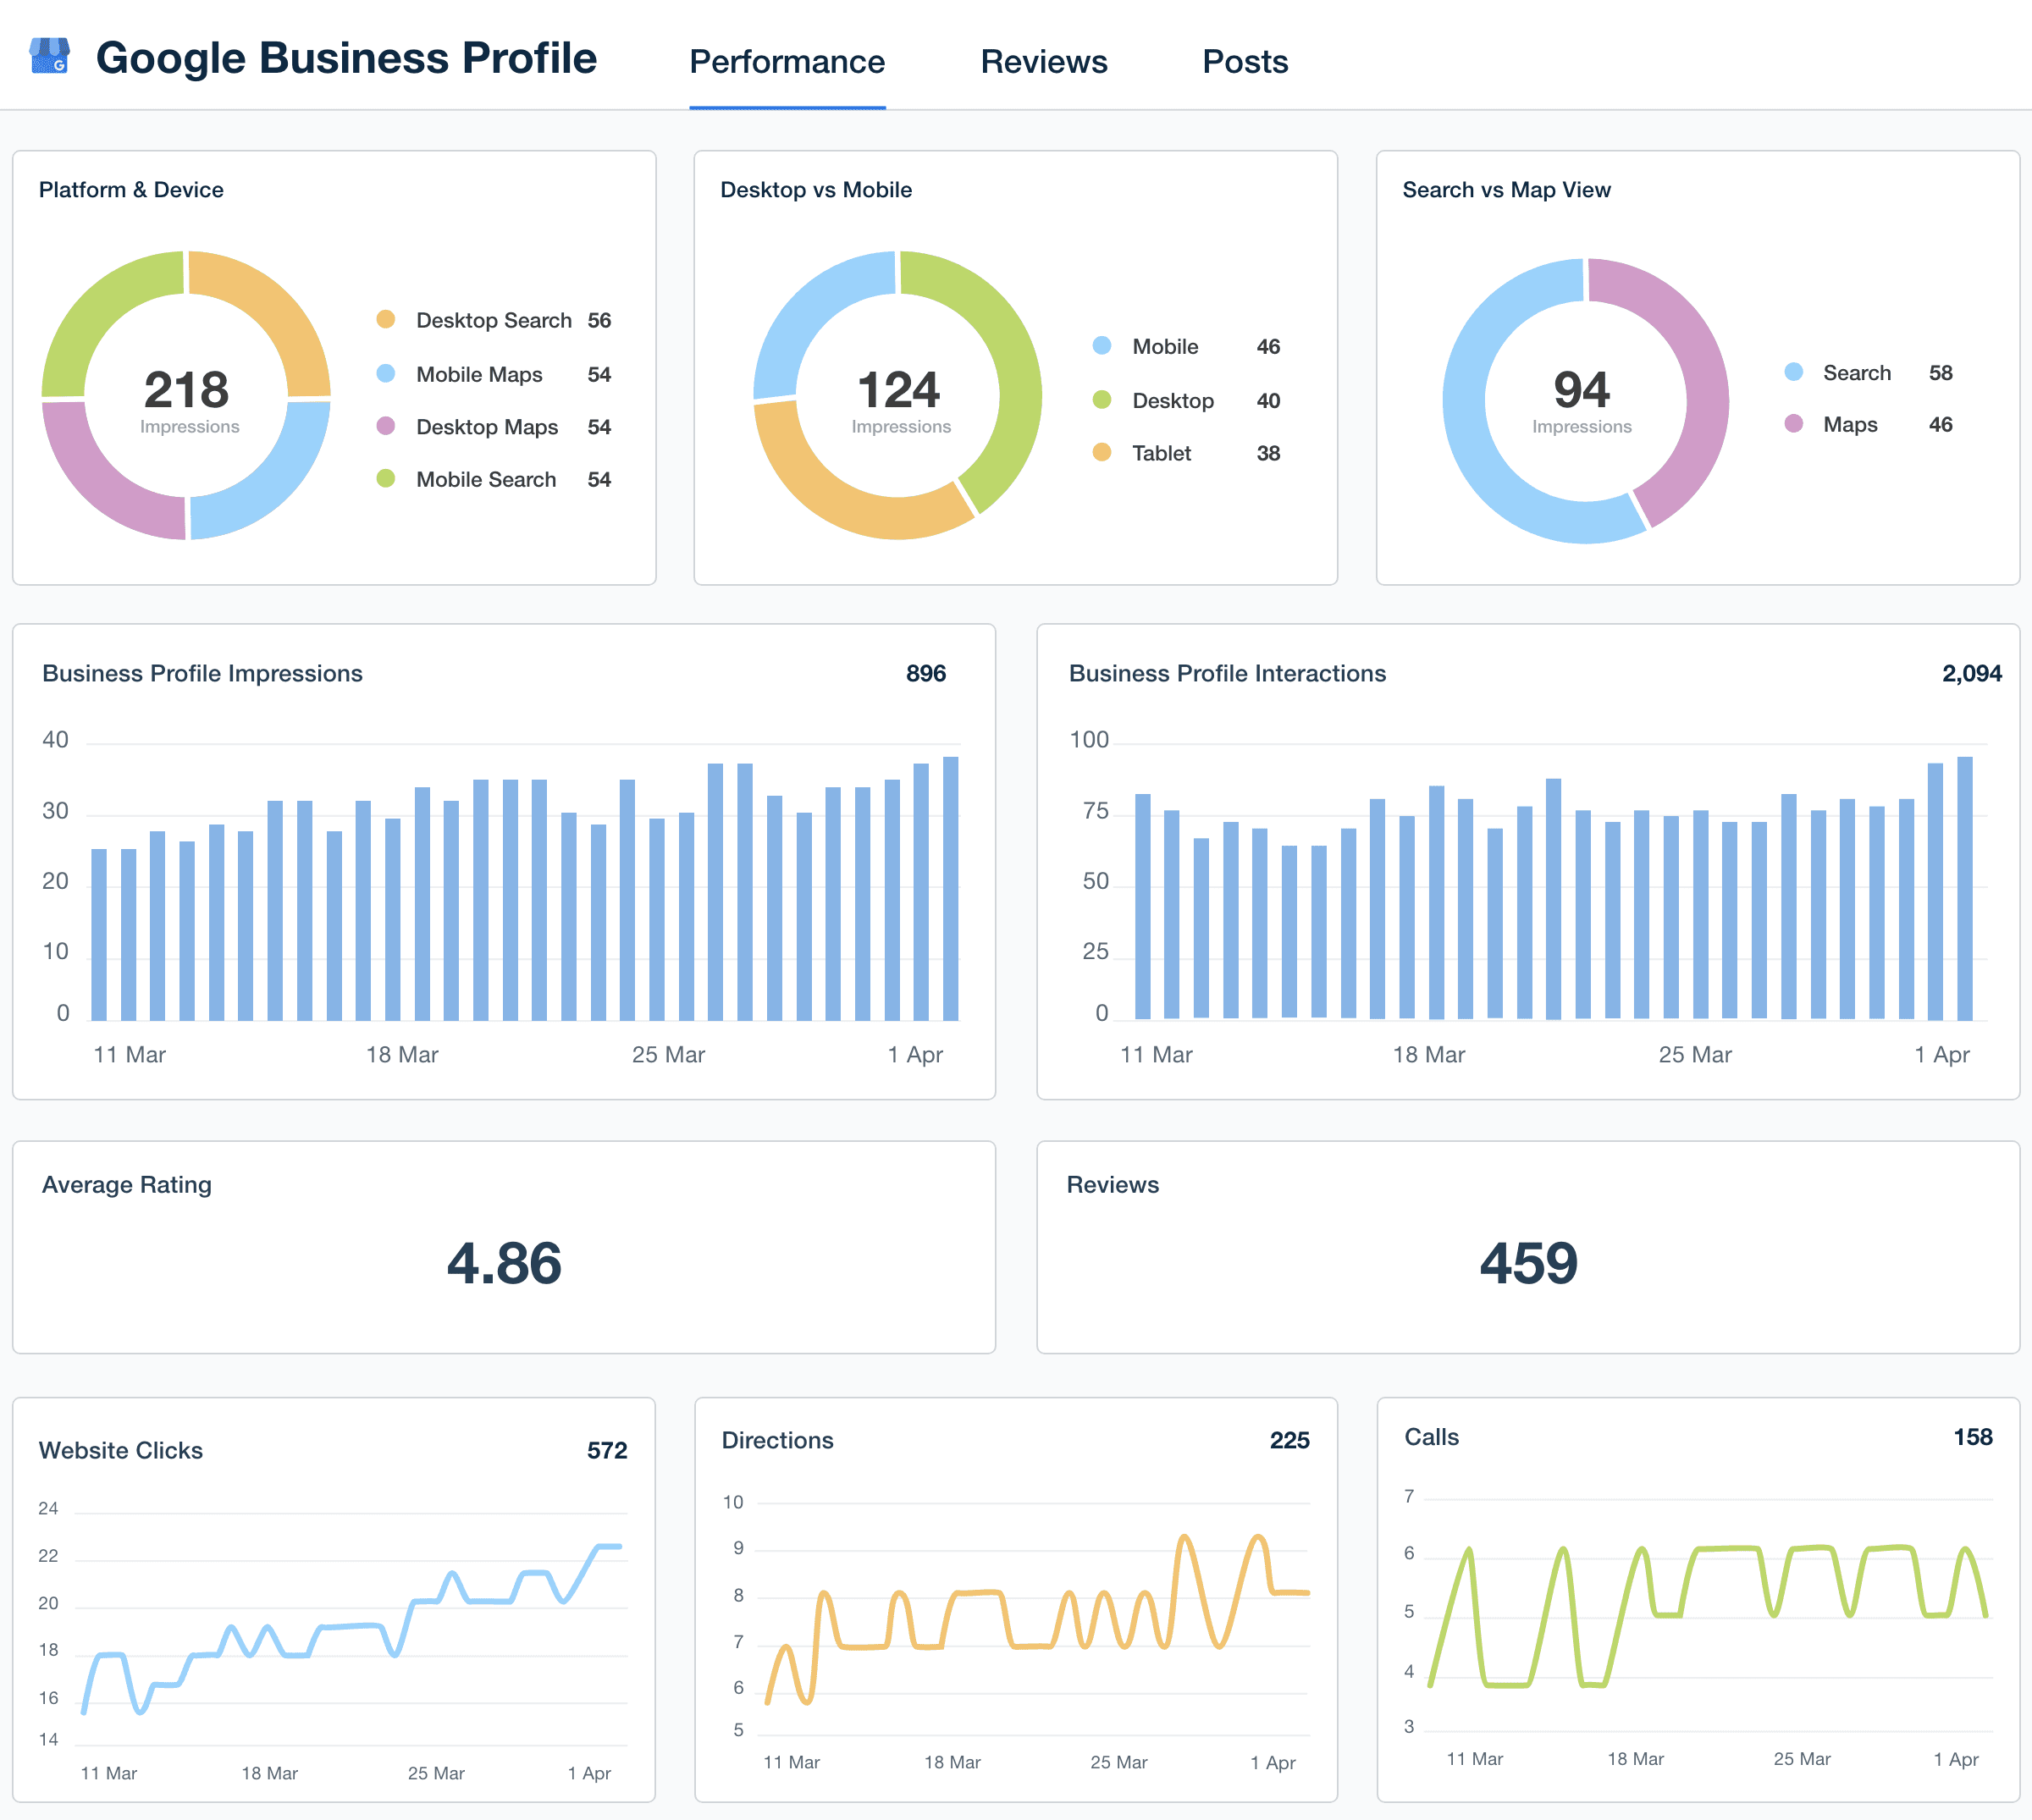
Google Business Profile Dashboard
The Google Business Profile dashboard tracks local search performance, including the number of searches, views, and actions taken by users (such as calls or directions). This dashboard helps improve local SEO efforts by showing how well your client’s profile is driving engagement.
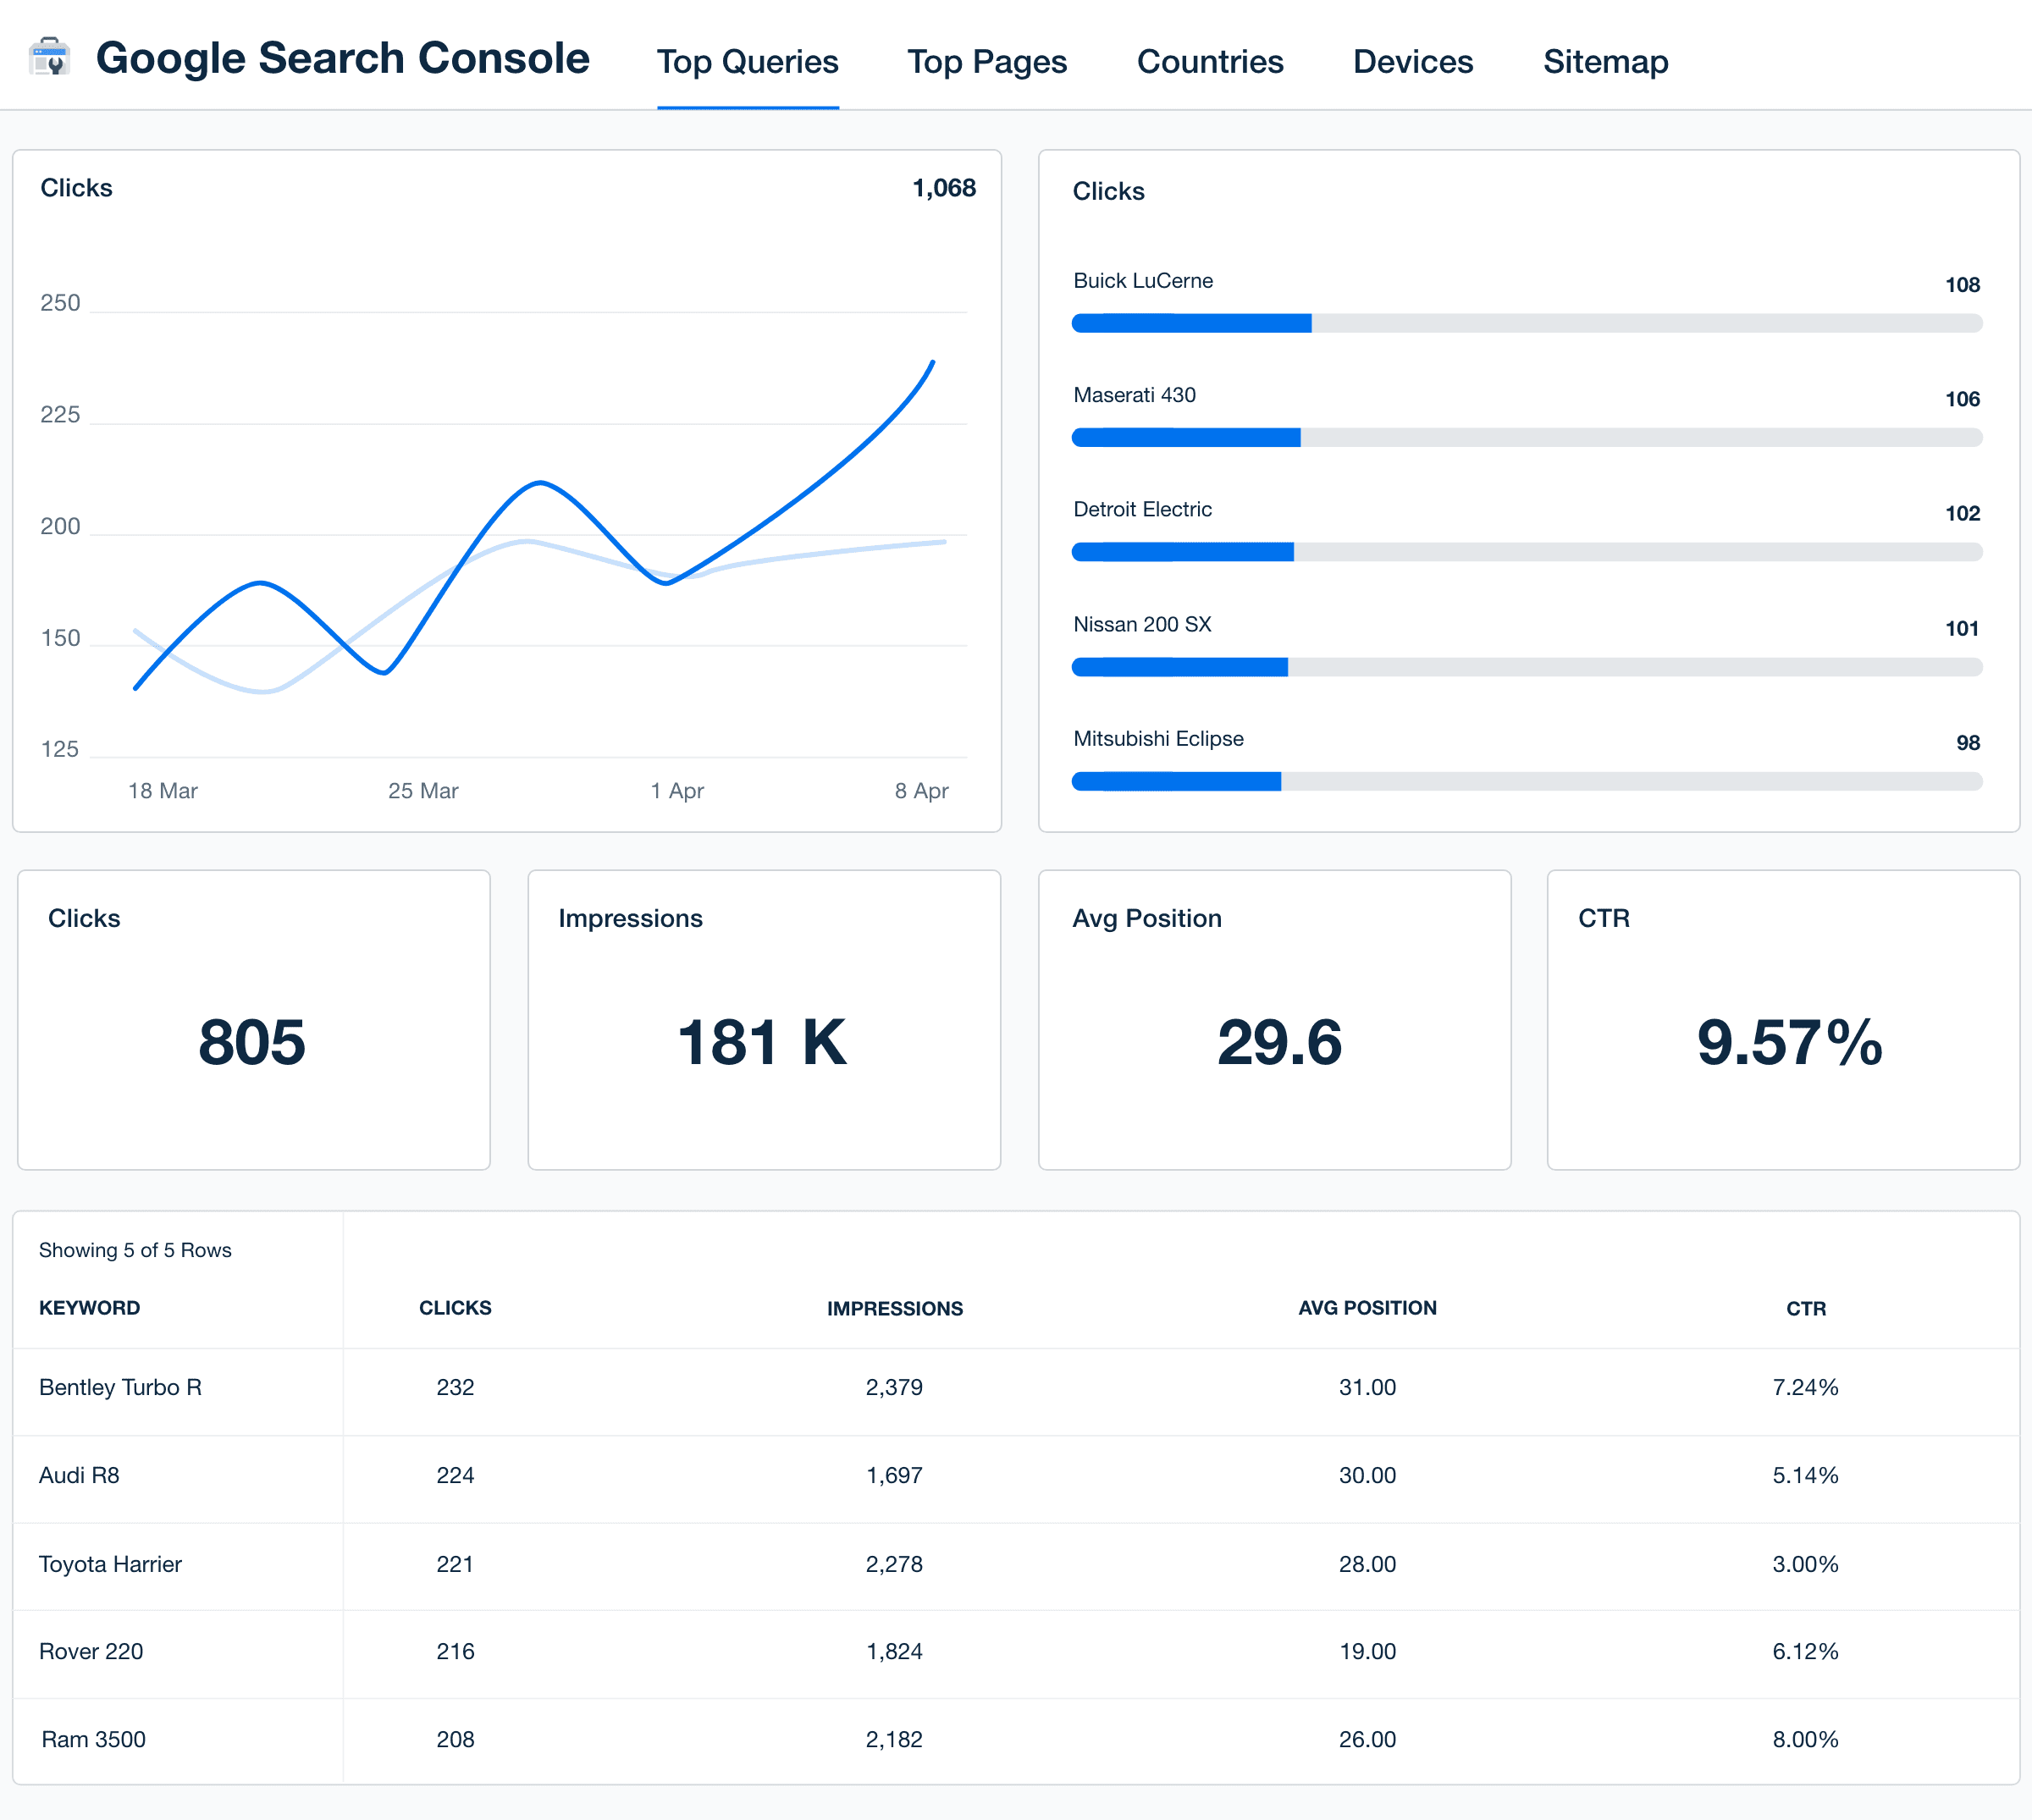
Google Search Console Dashboard
The Google Search Console dashboard focuses on website performance in search engines. It tracks keyword rankings, crawl issues, and impressions, helping you fix any issues that might hurt SEO performance and improve overall search visibility.
Keyword Ranking Dashboard
A keyword rank tracker is essential for SEO-focused clients. It tracks your client’s keyword positions in search engines, offering a clear view of which keywords are rising or falling, so you adjust strategies to improve rankings and organic search visibility.
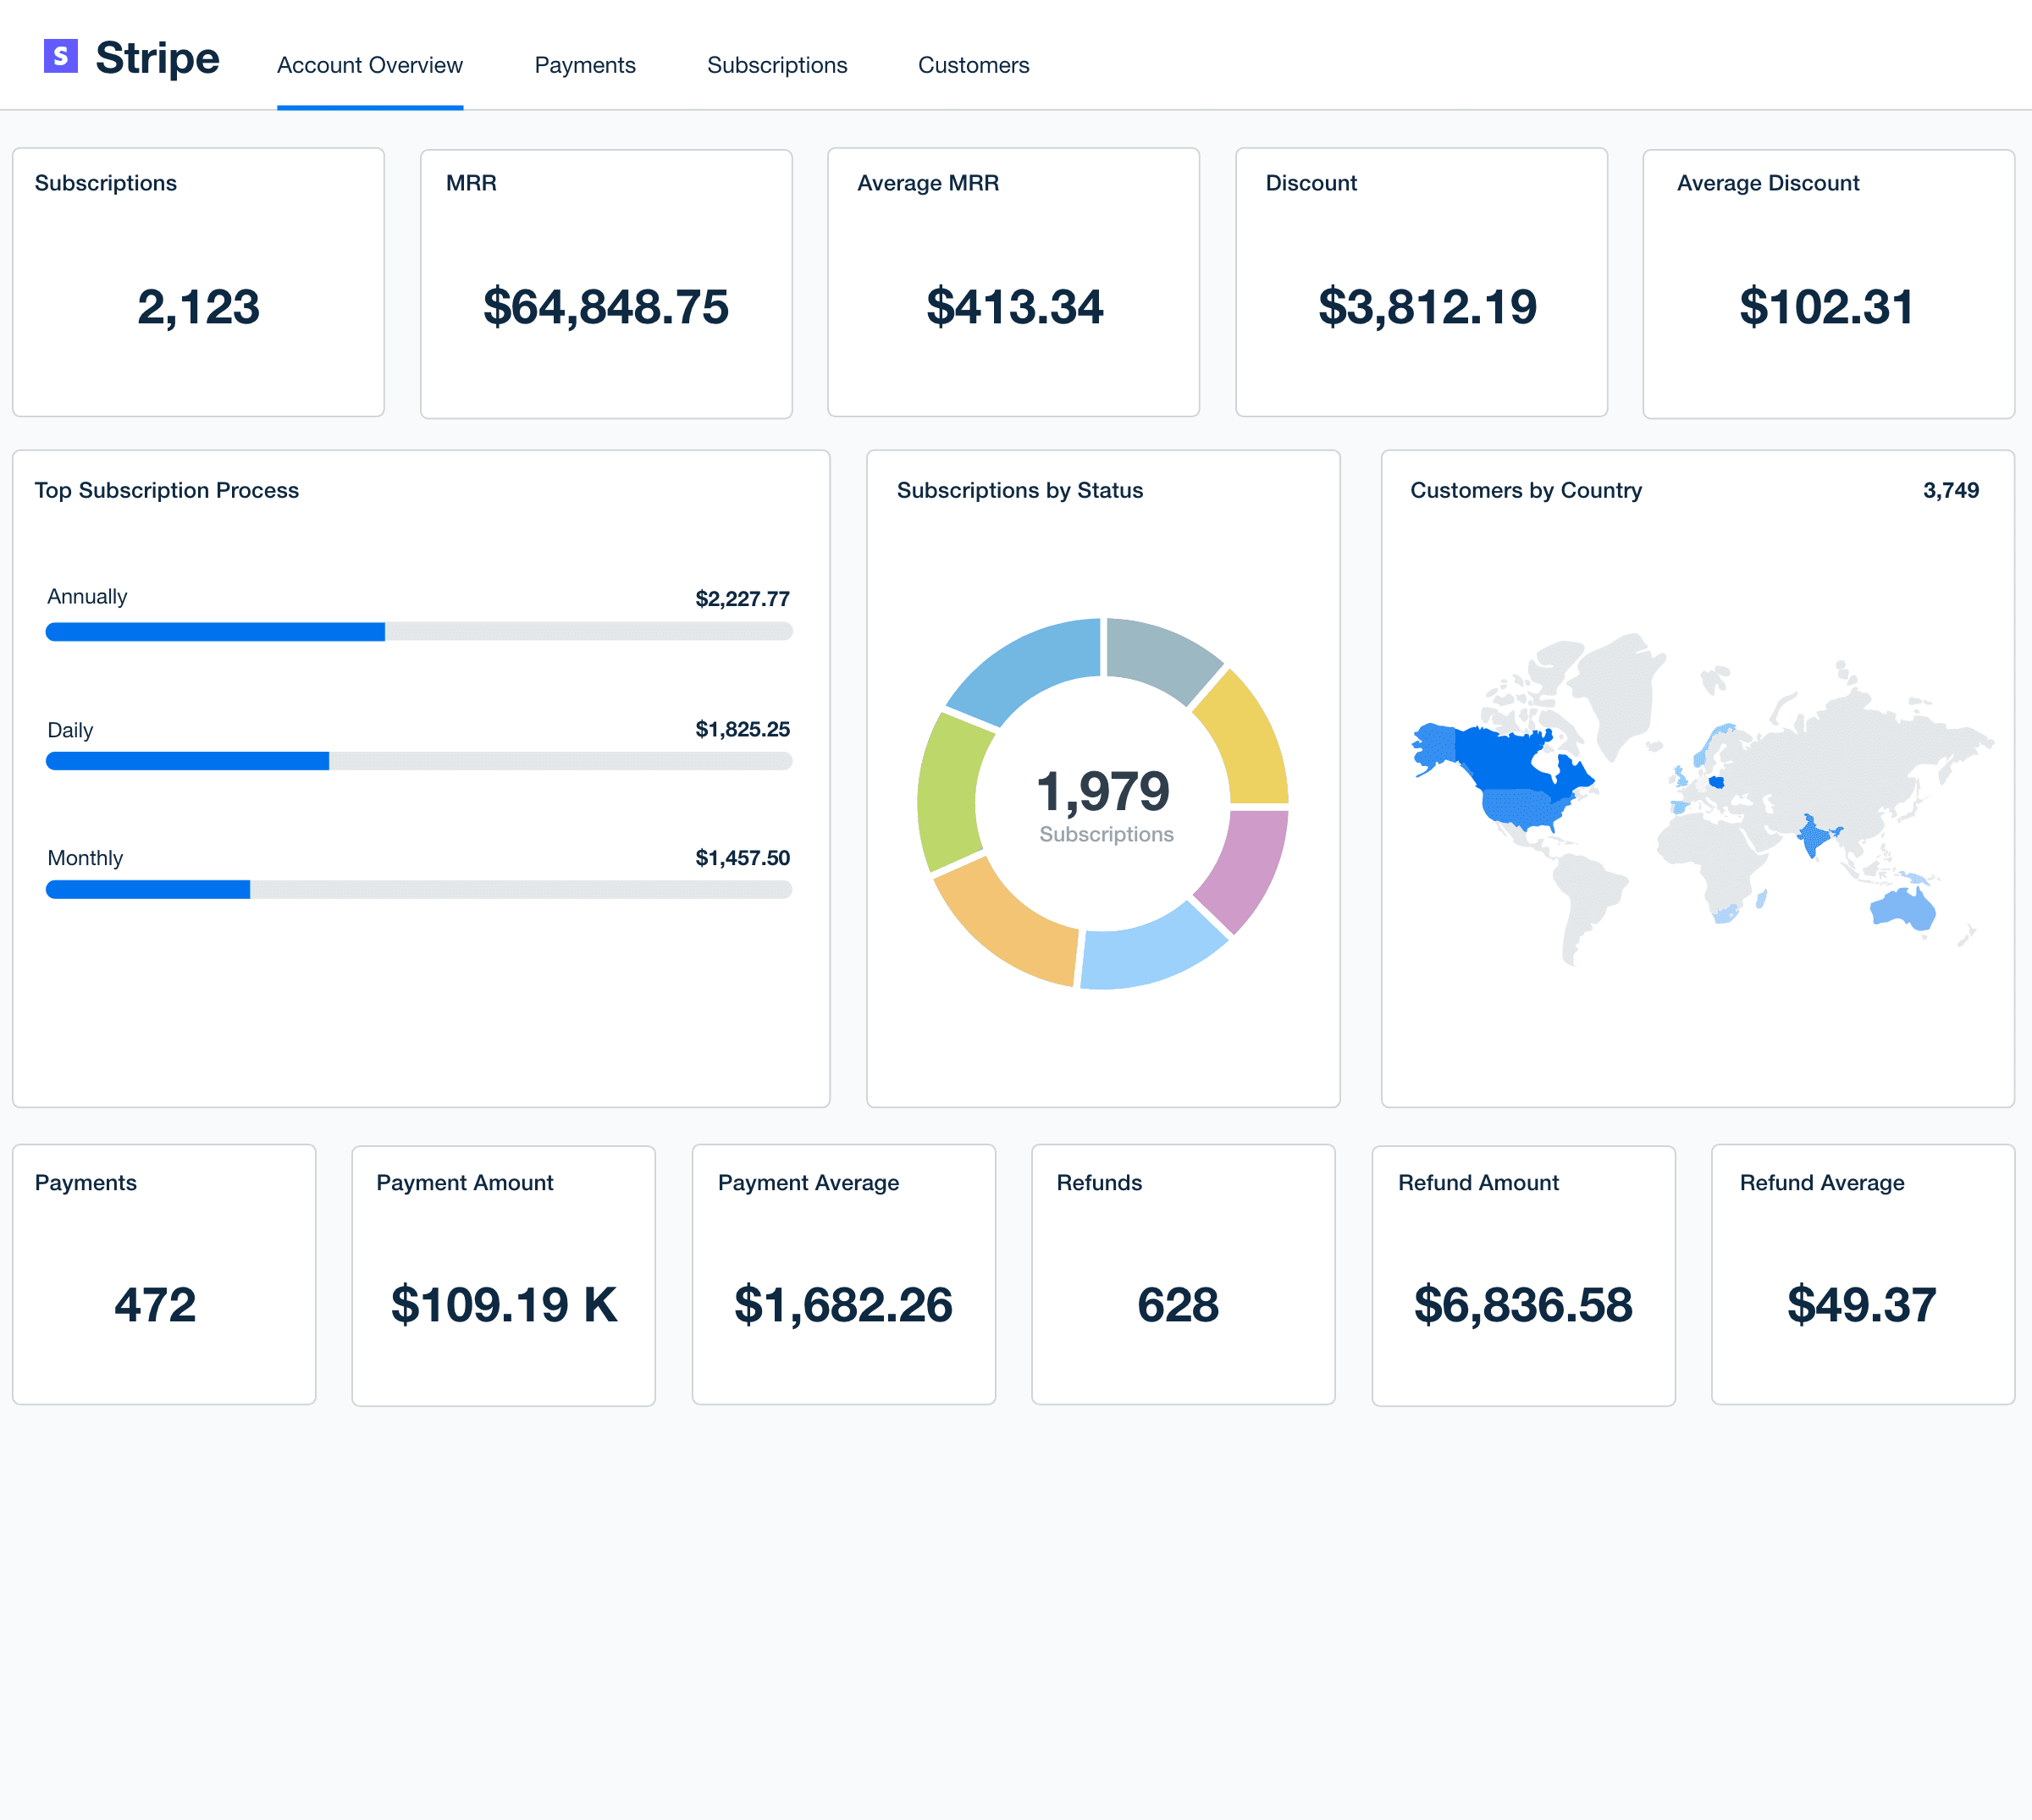
Stripe Dashboard
The Stripe dashboard tracks online payment activity, offering a quick view of your client’s financial performance and cash flow. It shows revenue, refunds, and transaction volume, helping businesses stay on top of their payment processing and overall financial health.
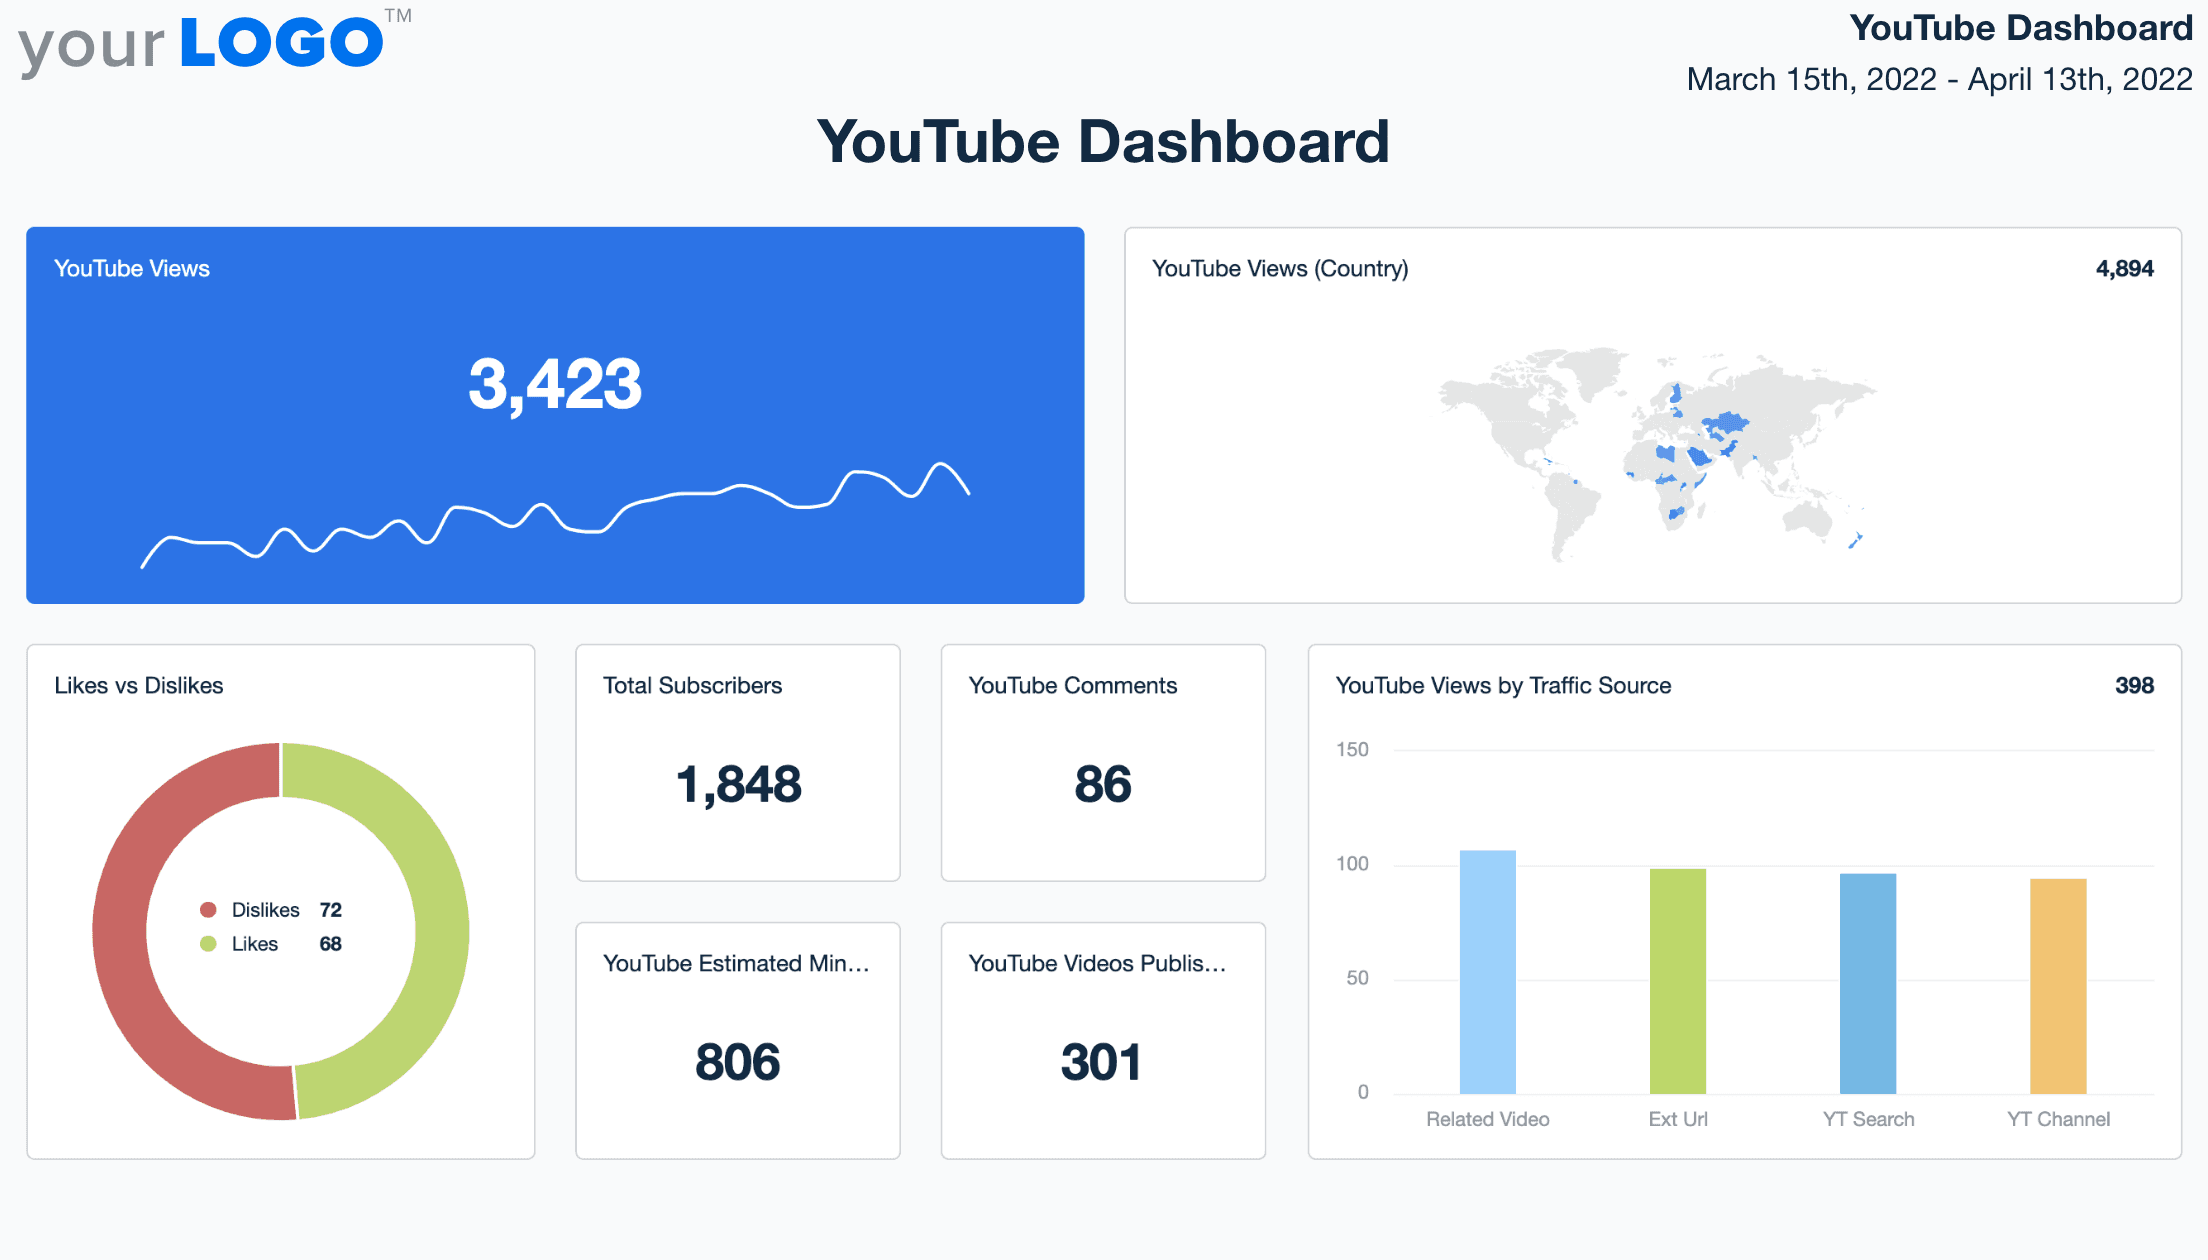
YouTube Dashboard
The YouTube dashboard helps you monitor your client’s video performance, including views, watch time, and subscriber growth. It’s a great way to track engagement and optimize video content for better reach and interaction.
These platform-specific dashboards provide focused insights, making it easier to track key metrics and drive results, whether you’re managing SEO, social media, or ecommerce performance. Each one offers the data needed to make smarter, data-driven decisions for your clients’ success.
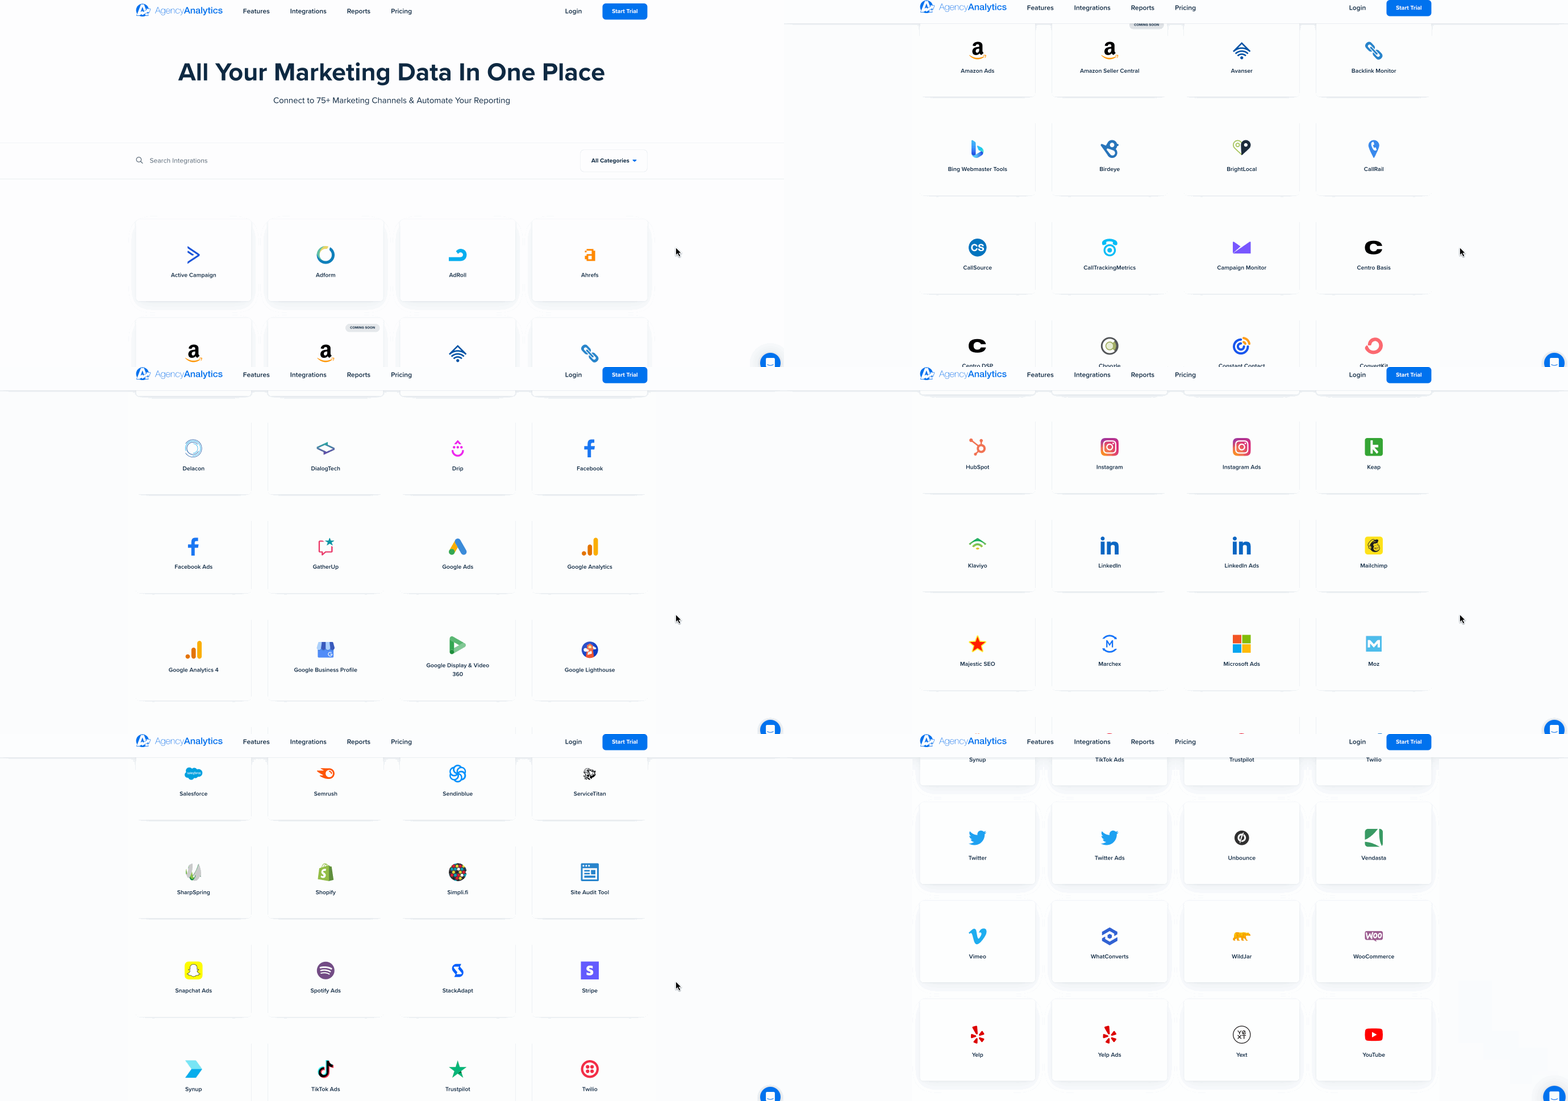
Don’t see the platform you’re looking for? Not to worry, there are over 80 platform integrations included with AgencyAnalytics. From Active Campaign to ConstantContact to HighLevel and Yext, you’ll find a prebuilt, professional dashboard template to streamline your client reporting.
Impress clients and save hours with custom, automated reporting.
Join 7,000+ agencies that create reports in under 30 minutes per client using AgencyAnalytics. Get started for free. No credit card required.
Already have an account?
Log inHow To Choose the Right Dashboard for Your Agency
Choosing the right dashboard for your agency starts with clarity—understanding your clients’ priorities, your team’s workflow, and the level of insight each campaign needs. A great dashboard strikes the balance between depth and simplicity: enough data to drive decision-making, but streamlined enough for quick reviews and meaningful conversations.
Here’s a breakdown to help you pick a dashboard that works for you and your clients.
Understanding Your Clients’ Needs and Priorities
Before choosing a dashboard template, step back and identify what your clients truly value. Are they focused on conversions, audience growth, or visibility?
Knowing this helps you align KPIs and select dashboards that visualize the metrics that matter most—helping clients see how your agency drives results that support their business goals.
Customizing Dashboards for Specific Industries or Campaign Types
Not every industry is the same, so a dashboard that works for an ecommerce business won’t necessarily fit a lead generation campaign. Customizing dashboards based on the industry or specific campaign type ensures the data is relevant and useful.
Every industry has its own success signals. Ecommerce clients may focus on cart value and product performance, while service-based businesses prioritize leads or call volume. Tailoring dashboards by campaign type ensures data stays relevant and actionable.
Custom dashboard templates allow agencies to filter by platform, adjust metrics, and match visual design to client needs—all while keeping the reporting experience consistent and on-brand.
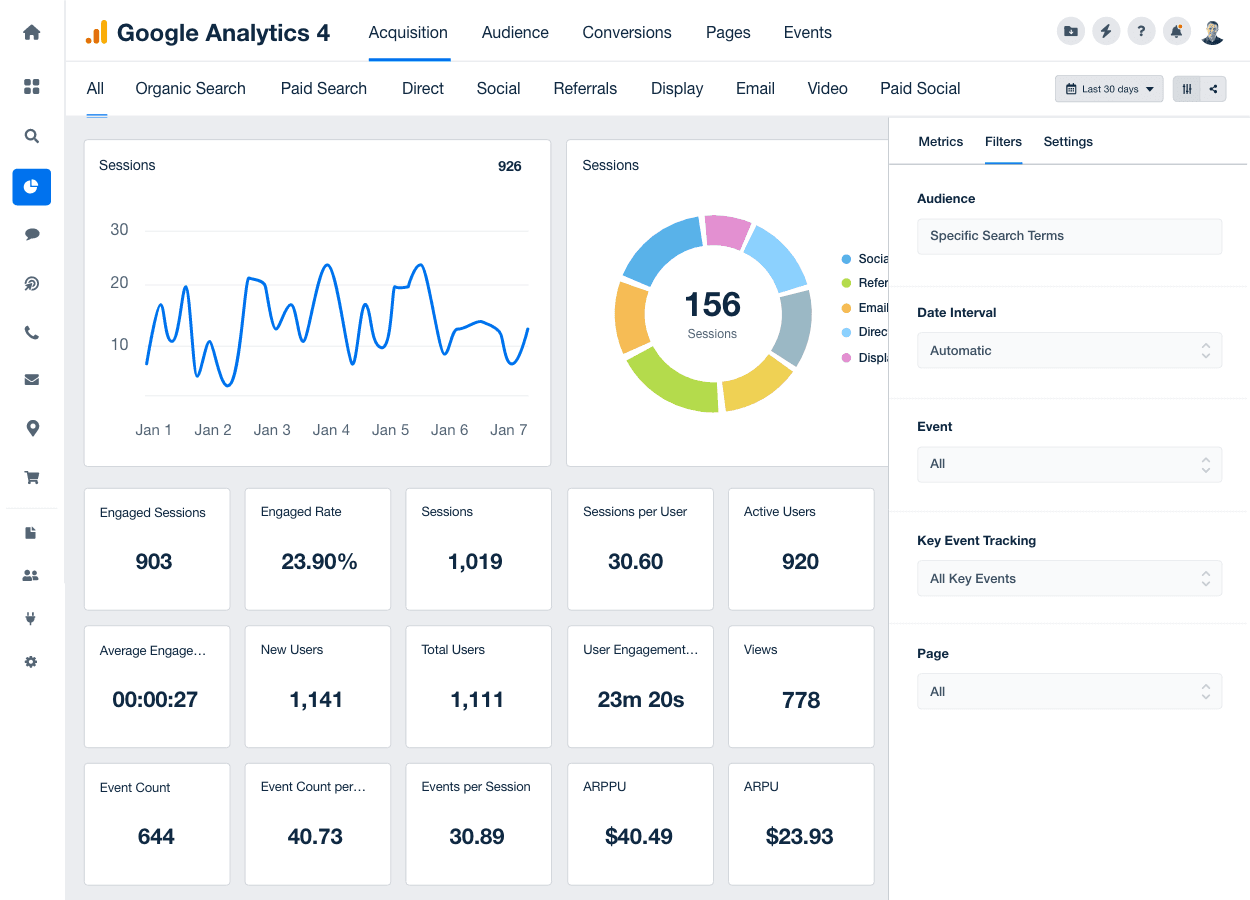
The ability to filter metrics, adjust layouts, and select data sources gives your clients a business performance view that’s actually meaningful to them.
Balancing Between Detailed Insights and Simplicity in Reporting
Dashboards should simplify, not overwhelm. Avoid information overload by focusing on a core set of KPIs that give a complete yet clear picture. Most agencies find success showing 3–5 key metrics per campaign—enough to demonstrate progress while keeping the dashboard easy to interpret. This approach keeps clients engaged and conversations focused on strategy.
You want a single dashboard that offers enough detail to be helpful, but not so much that it becomes overwhelming.
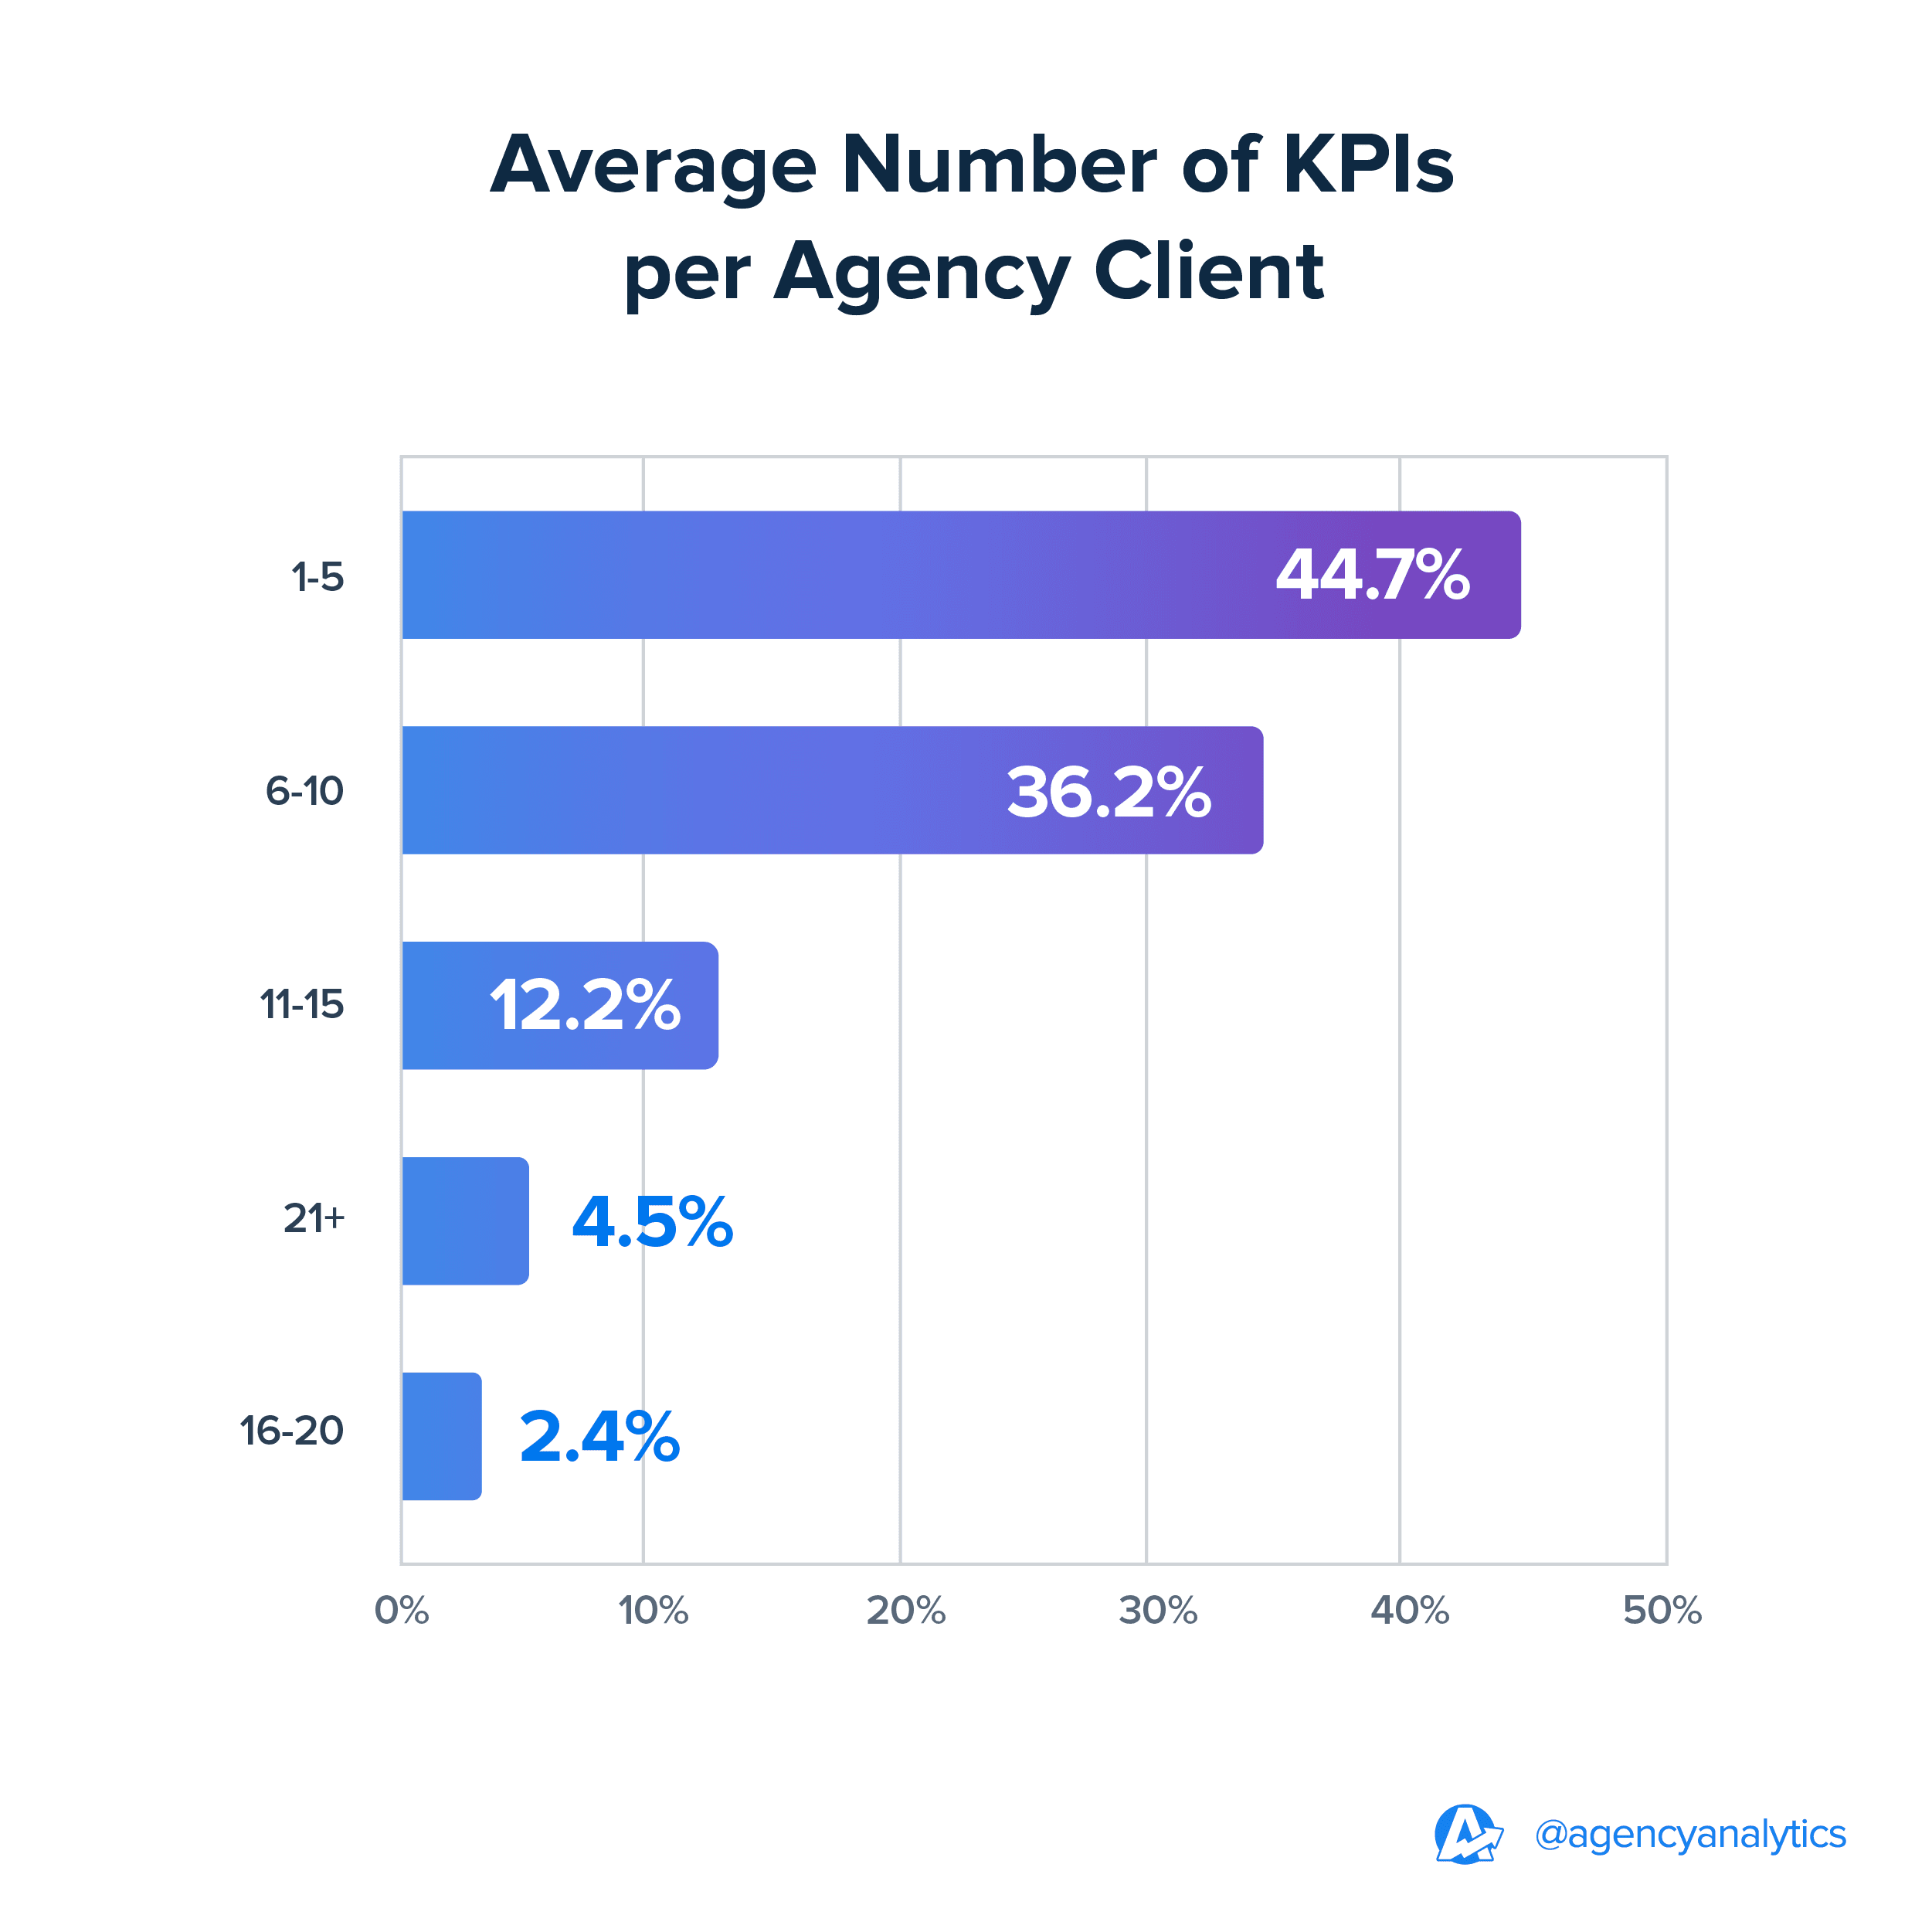
According to the 2024 Marketing Agency Management Benchmarks Report, most agencies focus on providing 1 to 5 KPIs per client.
The key is finding a balance where you get detailed insights, but everything is still easy to understand. Highlight the most important metrics, and allow clients to dig deeper only when they need to.
Create client-ready reports in minutes using customizable dashboard reporting software designed for busy agencies.
Considerations for Scaling Dashboards as Your Client Base Grows
As your agency expands, you’ll need a platform that grows with you. Look for platforms that make it easy to add new clients, integrate more data sources, and handle growing reporting needs.
The right dashboard helps you deliver clear, actionable reports tailored to your client strategies. By customizing them for specific industries, balancing simplicity with depth, and planning for future growth, you’ll set your agency up for success in tracking performance and keeping clients happy.
When done right, dashboards evolve from individual reports into a living system of analytics—fueling smarter strategy, improved collaboration, and greater efficiency across teams.
Impress clients and save hours with custom, automated reporting.
Join 7,000+ agencies that create reports in under 30 minutes per client using AgencyAnalytics. Get started for free. No credit card required.
Already have an account?
Log inFrequently Asked Questions About Dashboards and Client Reporting
Learn how to use these dashboard examples to turn your data into clear, actionable insights that impress clients and drive strategy.
A great client dashboard organizes complex data into visual insights that clients can interpret in seconds. It uses data visualizations like bar charts, trend lines, and color-coded KPIs to show progress at a glance. Beyond numbers, it connects results to business goals—helping clients understand how each campaign drives measurable outcomes.
The best dashboard examples also feature interactive widgets, filters, and branding options that make data storytelling simple, professional, and client-focused.
Dashboards simplify analysis by turning fragmented information into one cohesive, data-driven picture. When all metrics—traffic, ad spend, conversions, and engagement—are unified, agencies gain a bird’s-eye view of performance.
This holistic perspective helps identify opportunities, fix inefficiencies, and make faster decisions. With customizable layouts and automatic updates, dashboards become a living part of your agency’s strategy, empowering data-driven decision making across every campaign.
An analytics dashboard is typically designed for internal visibility—it helps agency teams track performance, productivity, and ROI across multiple clients.
A client reporting dashboard, on the other hand, translates that data into visual summaries clients understand instantly. It’s less about operational detail and more about demonstrating value.
AgencyAnalytics bridges both needs by offering dashboards that provide the internal depth teams need and the clarity clients expect.
Dashboard examples and templates streamline setup by giving agencies pre-built structures for popular use cases—SEO, PPC, social media, and ecommerce. Instead of creating reports from scratch, teams simply select a template, connect data sources, and customize visuals.
This approach saves hours of manual work per client, ensuring data consistency and faster delivery. With editable templates, you get flexibility and speed, turning client reporting into a scalable, repeatable process that supports growth.
Data visualization turns raw data into stories that make sense. Using clean design principles and consistent color palettes, dashboards translate complex metrics into intuitive visuals that encourage exploration and understanding.
Charts, graphs, and comparison widgets help agencies show progress over time and highlight key wins. Effective visual storytelling ensures that both agencies and clients see performance clearly—and take action confidently.

Written by
Paul Stainton is a digital marketing leader with extensive experience creating brand value through digital transformation, eCommerce strategies, brand strategy, and go-to-market execution.
Read more posts by Paul StaintonSee how 7,000+ marketing agencies help clients win
Free 14-day trial. No credit card required.


