Table of Contents
QUICK SUMMARY:
A data dashboard visualizes complex information, making it accessible and actionable. It highlights key performance metrics, supporting quick decision-making and effective client communication. This guide covers the importance of data dashboards, essential metrics and KPIs, and presentation techniques. It also includes examples and templates for various data types, ensuring clarity and ease in creating customized dashboards.
Data dashboards are a critical tool in any agency’s arsenal. Not only do they help you make sense of all the data, but they do so in a way that’s clear and easy for your clients to understand while highlighting the most important numbers to their business.
In this article, we’ll go over why your agency should use data dashboards, how data dashboards work, what metrics and KPIs to include, how to present data, and so much more.
We’ve also included data analytics dashboard examples for all types of data along with over a dozen dashboard templates that will make creating and configuring your own dashboards a breeze.
What Is a Data Dashboard?
When you hear the word "dashboard," what do you picture? If your first thought is your car’s dashboard, you’re not that far off from what data dashboards do.
After all, a vehicle dashboard provides a comprehensive overview of the data that matters most to the driver, such as speed, RPM, mileage, fuel level, and engine temperature. Some of the indicators and gauges in your dashboard might compel you to fill up for gas or schedule your next service appointment, while others, like your “Check Engine” light, might feel like it only exists to frustrate and stress you out with its vagueness.
Modern data dashboards act in much the same way, except unlike the “Check Engine” light, they’re supposed to make your life easier, not harder. They enable users to provide a clear and concise view of their clients' current marketing performance. Although, perhaps, a low score from an SEO site checkup is possibly the closest thing to a “Check Website” light.
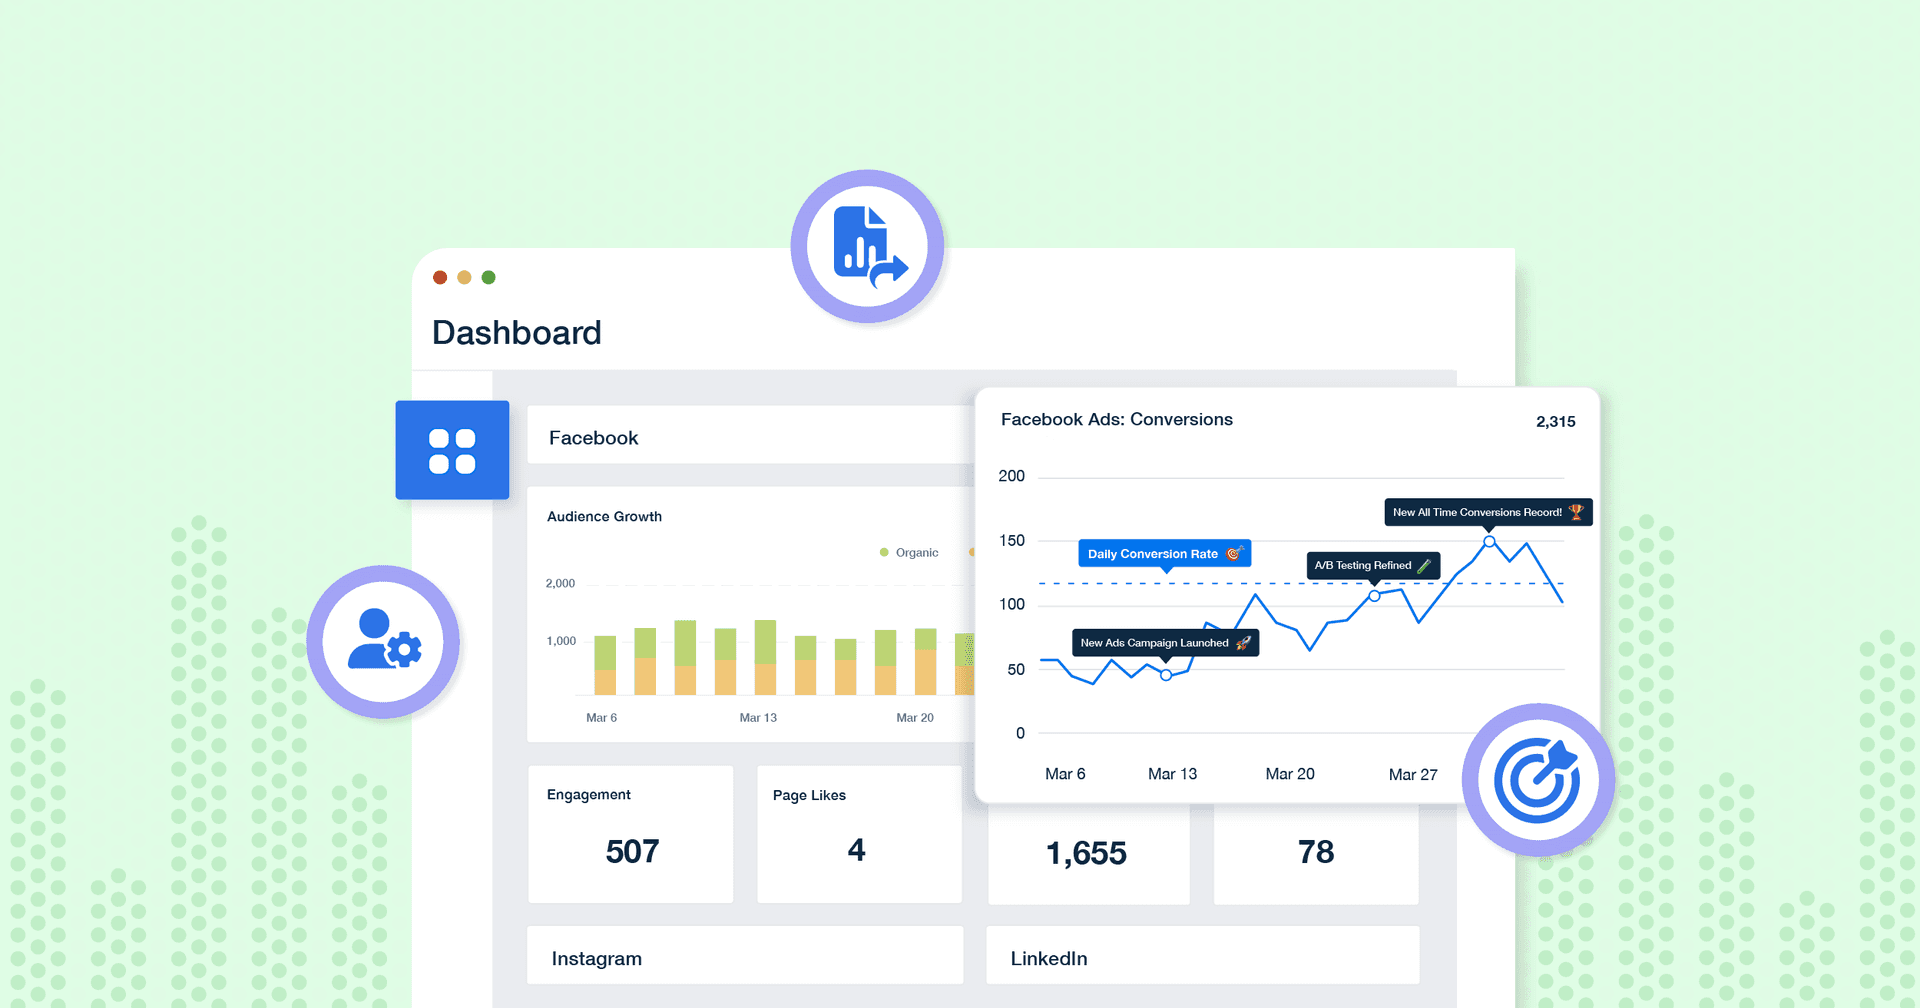
Basically, a data dashboard is a tool that manages your client’s information and displays complex data in a clear and visually appealing way so you and your clients can easily understand everything that’s important at-a-glance.
So, ditch the spreadsheets—automated dashboard reporting software delivers real-time insights your clients will love.
The Difference Between Data and Marketing Dashboards
Since your dashboards are customizable, there are no hard definitions of what a data dashboard is versus a marketing dashboard, but there are still some generalizations that we can make.
At the end of the day, both dashboards display data, but the way that they differ is in what data is displayed and the audience the dashboards are made for. Data dashboards are often a lot more technical and are usually built for people like data analysts, data scientists, and others who work heavily in data, whether it’s processing research or anything else.
Marketing dashboards are–as the name suggests–aimed towards marketers, so the types of data that you see in a marketing dashboard would focus on the most important marketing metrics and KPIs.
That’s not to say there isn’t any overlap between a data dashboard and a marketing dashboard, but in general, a data dashboard is often more in-depth with more technical metrics than what you might see in a marketing dashboard.
Why Should You Use a Live Dashboard?
A data dashboard can help you monitor everything, from the overall state of your business to the performance of a specific pay-per-click ad. One of the best things about creating custom dashboards is that they allow you to pick and choose the most relevant data points for both your marketing efforts and your clients.
The ability to share access to the live dashboards with clients allows them to dive deeper into the analytics without needing us to dig up specific metrics on their behalf. This has reduced the number of requests/calls we receive from clients throughout the month.
- Bryan Lozano, Vice President of Operations, Ad-Apt
All businesses, regardless of what they do, produce data, which means that all of your clients can benefit from having personalized operational dashboards built specifically for them that highlights their mission-critical KPIs and other important metrics. Luckily, it’s quite easy to do that and we’ll show you how to design your own dashboard.
Crafting a data dashboard is like setting the stage for a performance where discrete and continuous data are the star performers. Discrete data–being countable and integer-like–sets the rhythm with stable metrics like site visits or total sales. On the other hand, continuous data brings in the melody with its fluid, fluctuating details like percentages and time-based data. The interplay of discrete vs. continuous data gives your dashboard an unparalleled depth, making it a comprehensive and lively data orchestra.
All Your Data in One Place
A data dashboard can also save you so much time by bringing your client’s data all together in one convenient place. Compare that to the headache of manually searching through dozens of documents and spreadsheets to compile the relevant metrics, performance indicators, and OKRs (aka Objectives and Key Results).
If your team is managing a client’s social media, that could mean logging into all of your client’s social media accounts and copying and pasting the metrics and key performance indicators (KPIs) from each platform into a single document or spreadsheet.
Now, multiply that by 20, 30, or 300 clients. Why not save yourself time and trouble by letting a KPI dashboard do the grunt work for you automatically?
That way, you focus on more important things like data analysis and providing context to the data.
Get Data in Real-time
When comparing dashboards to reports, in many ways, it's about live vs. static data. Instead of waiting until the end of the month to compile all the raw data, run the numbers, and crank out a client report, modern dashboards empower you and your clients to make data-driven decisions at the speed of their business.
With transparency being our main philosophy, it has been important for us to have an easy-to-access reporting platform that would put everything in one place for both us and the client. We also wanted something that would be able to track tasks, so the client could see our activity in real-time, giving them peace of mind.
- Claire Aldridge, Digital Marketing Specialist, Victory Digital
Businesses need agility and flexibility to stay ahead, respond to changes in the marketplace, and continually adjust the course. Agencies are well aware of how fast things can change online– especially when it comes SEO trends or which KPIs are the most important for each social media platform. Things can blow up in the blink of an eye because sometimes all it takes is a single review, post, or even share, and before you know it, it’s gone viral.
Having a data analytics dashboard that updates in real-time means you’ll have a continuous source of the latest information, which helps you identify situations the moment things stand out in the data, so your agency can respond and either capitalize on it or fix it immediately.
Track, Analyze, and Visualize Client Data
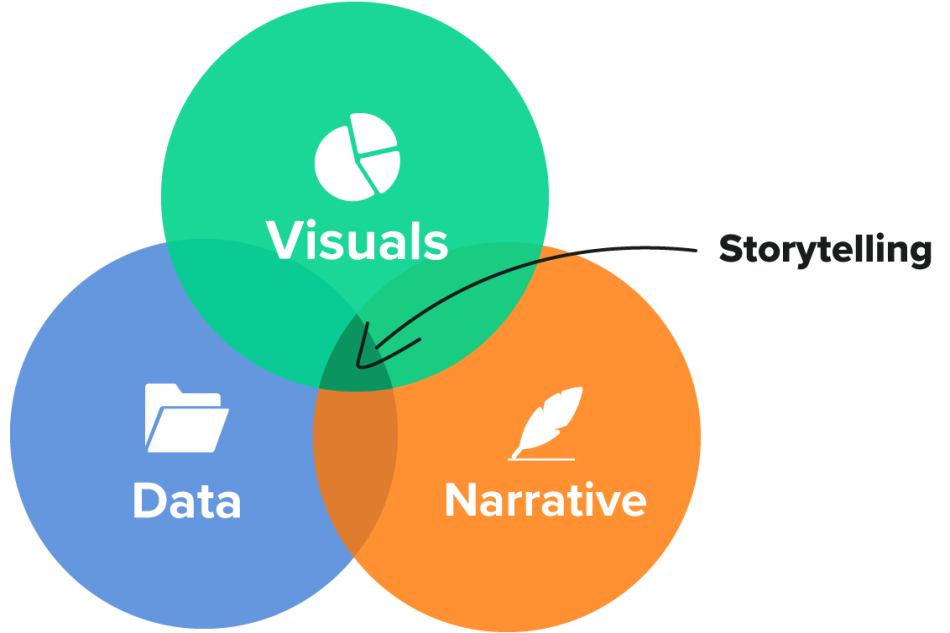
Data dashboards not only help agencies track, visualize, and analyze data; they also play a key role in data storytelling, which adds much-needed context to the data.
We have a dashboard that we review during our weekly client meetings. This allows us to visually show how various marketing efforts are working. Additionally, we set up monthly automated reports that go out to stakeholders at the start of each month, keeping our agency top of mind for the entire C-Suite.
- Tim Akers, Founder, Akers Digital
This has the added benefit of enabling leadership to adapt and make quick decisions – which is essential in this competitive and fast-paced world of digital marketing.
Forecasting and Strategy
Not only do most data dashboards organize data to provide a snapshot of how your clients and campaigns are doing at a specific point in time, but many dashboards also provide historical data reports that make it easy to identify trends and what worked in the past, which are key elements when planning for the future as well.
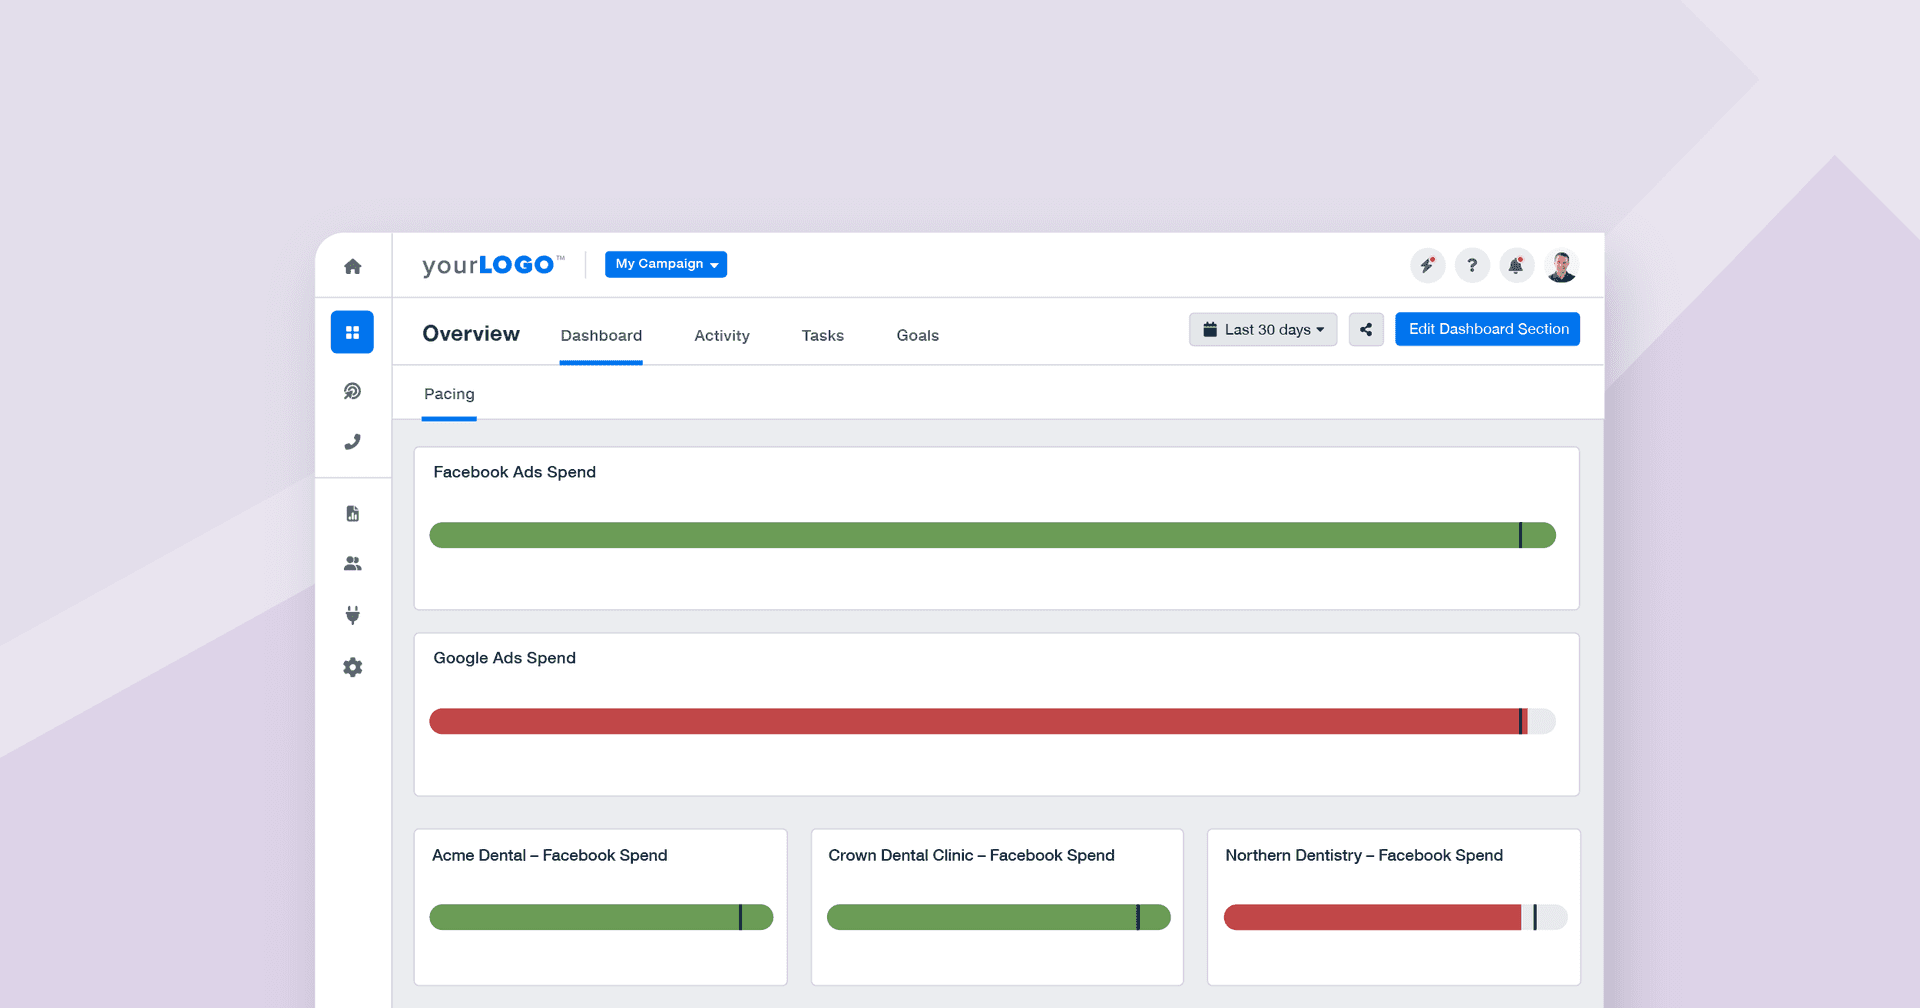
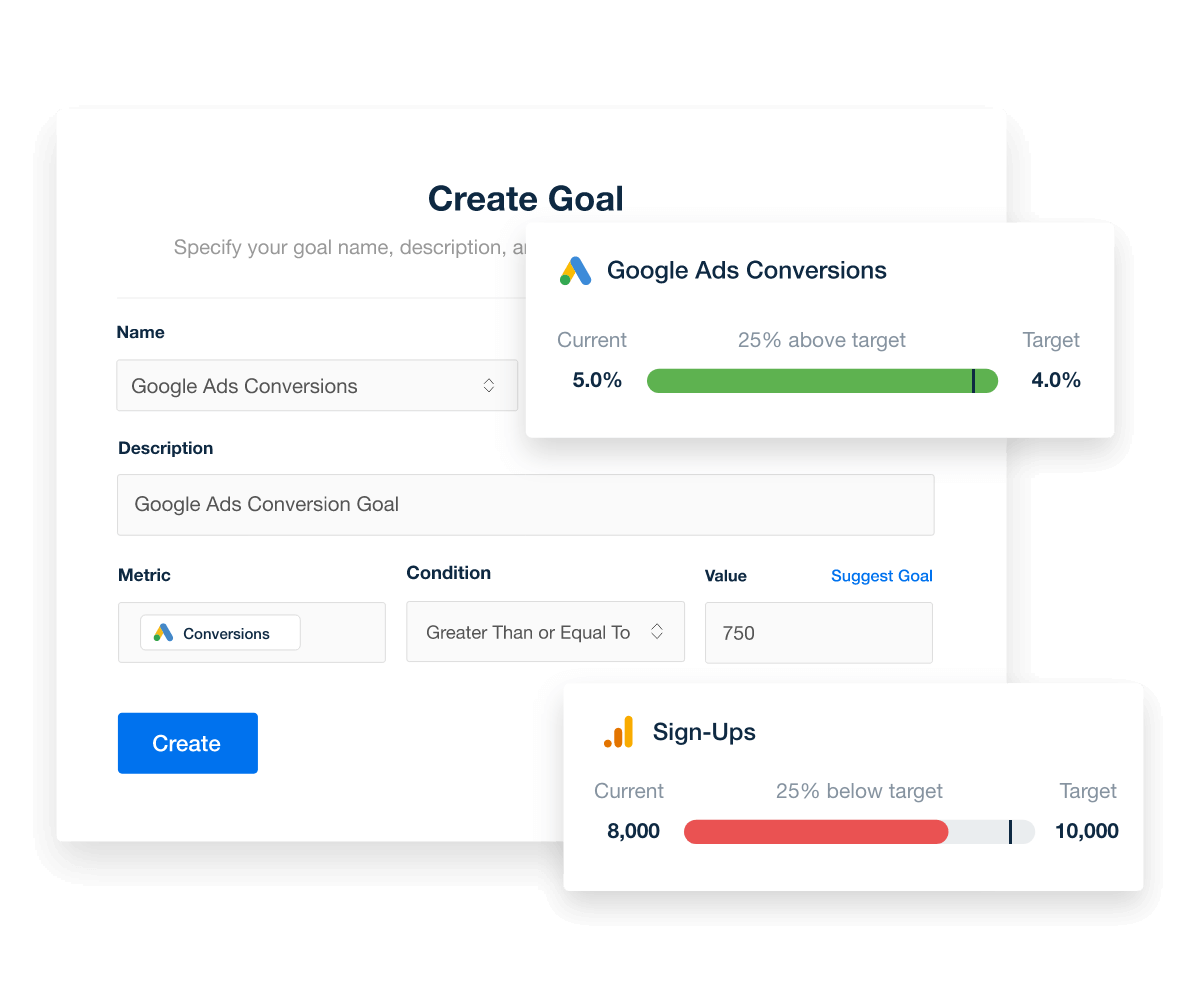
Incorporating goal and budget tracking into your analytical dashboards allows you to track against your clients’ KPIs, such as spend and organic traffic. Ensure your campaigns are pacing towards reaching your clients’ promised goals with AgencyAnalytics’ goals widget incorporated into your data dashboards:
How Do Dashboards Work?
A dashboard is an information management tool that collects and aggregates information from various data sources and easily integrate with tons of different platforms and tools. It ranges from social media dashboards (that connect to everything from Facebook, Instagram, Tiktok, and more), web analytics dashboards that integrate with platforms like Google Analytics 4, and ecommerce platforms, just to name a few.
To get the most out of your data dashboards, consider the following best practices:
Make sure you have an overall strategy in place. Clearly articulate your client's goals and objectives, and ensure the data dashboard provides the actionable insights needed to reach them.
Start with a few basic metrics that will give you insight into key performance indicators, so you accurately measure progress against your goals, based on what's most important to your clients. Is it follower growth on Instagram, conversion rate on Google ads, the latest SEO site checkup score, or all three?
Continually refine your dashboard by adding new metrics and relevant data collection from multiple sources to your specific objectives.
Leverage automation tools to ensure data accuracy and make sure you're always looking at accurate information in real time.
The great thing is that we have automated all of our client’s monthly reports within AgencyAnalytics to import data directly from the platform’s dashboard integrations! The initial setup of the dashboards and the reports might take upwards of an hour per client, but having those reports automatically sent out monthly is an absolute dream.
- Jessica Weiss, Director of Marketing & Strategic Partnerships, One Firefly
Types of Dashboards
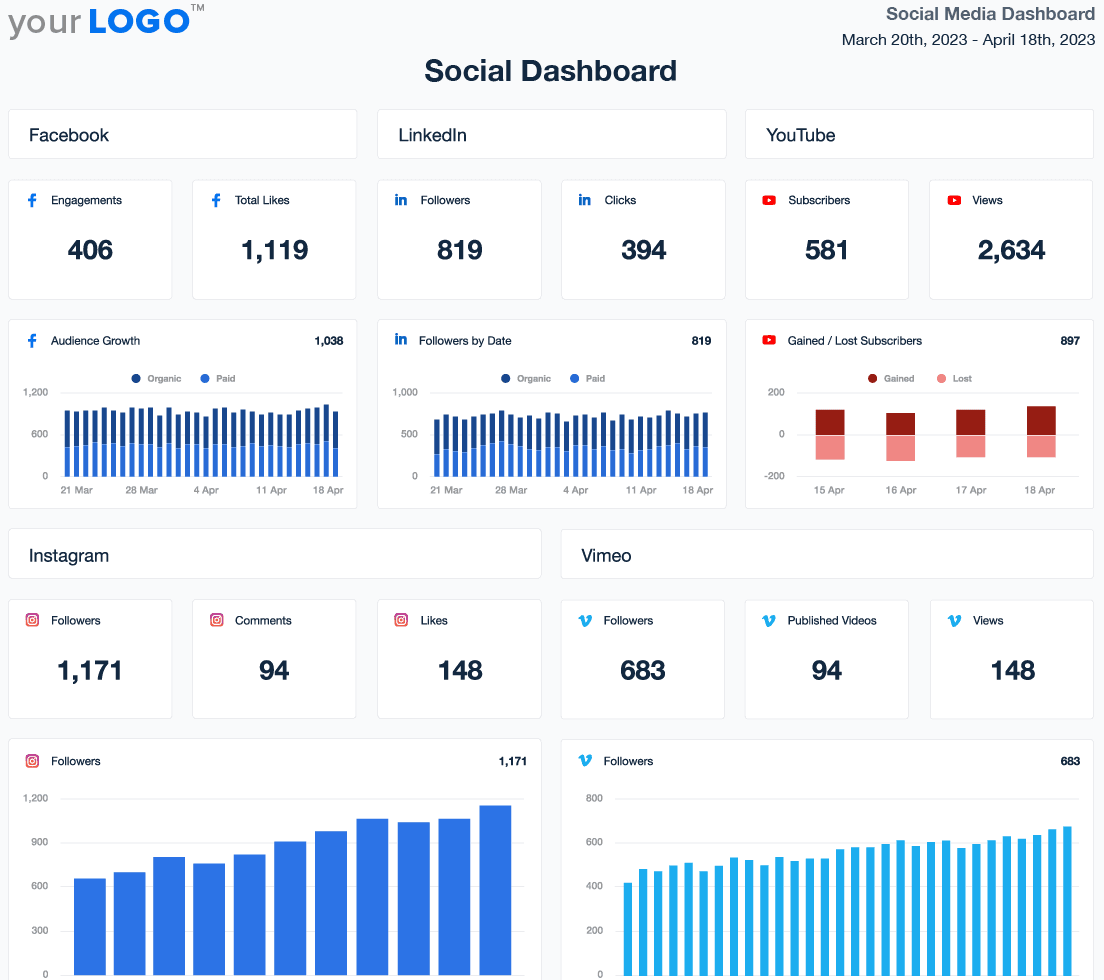
Depending on your needs, you could have an all-in-one digital marketing dashboard that tracks overall campaign performance across multiple channels and displays everything from ad spend, keyword rankings, conversion rate, and more.
Or you could go with more specific dashboards focused on particular aspects, such as an SEO dashboard, PPC dashboard, automated KPI dashboards, or even dashboards focused on call-tracking!
The point is that you can easily create a dashboard for any type of valuable data you want! Since dashboards are so customizable, you can choose exactly what you want to see. This allows agencies to prioritize the most important metrics in an informational hierarchy tailored to any industry, department, campaign, or client.
When it comes to dashboards, your only limit is your imagination.
5 Steps for Designing Your Data Dashboard
Here are a few of the most important things to keep in mind when designing a custom data dashboard:
1. Identify The Data Points
One of the best ways to design your data dashboard is to first identify all the important data that it needs to display so go through and look to your client’s metrics, KPIs, and OKRs (or whatever terms you use to talk about your numbers) and include them in there.
I know how much our clients want an easy-to-digest, visual format of just the most important information. But I was spending hours gathering data and manually creating these. That only lasted a few months before I found AgencyAnalytics and cut the time down enormously while also adding the extra benefits of data dashboards.
- Lane Anderson, Founder & CEO, London Road Marketing
Then, look at the metrics and see which ones are related, and try grouping them together. This will make organizing your client’s dashboard easier and make things simpler because you’ll be able to group your metrics into different categories that fit together.
For example, if you’re creating a top-level dashboard for one of your client’s campaigns, you might want to have all your client’s conversion metrics in one section of the dashboard, with another section dedicated to your acquisition metrics and then another section focused on user metrics, budget pacing, and so on.
2. Create an Informational Hierarchy
Once you’ve identified the key metrics and organized them into groups, the next step is to start putting them into order. Ask yourself what are the absolute most important metrics and categories, and organize them from top to bottom.
Clients want to see the end goal - what's converting, what's working, and where there is consistent growth. If something is not working, we want to understand why and make recommendations to fix it.
- Valerie Jennings, CEO, Jennings Social Media & MarTech
Structuring your data this way creates an informational hierarchy that lets you know which metrics, KPIs, and OKRs should be featured at the top of the dashboard and in which order the rest should be presented in terms of importance.
3. Visualize the Data
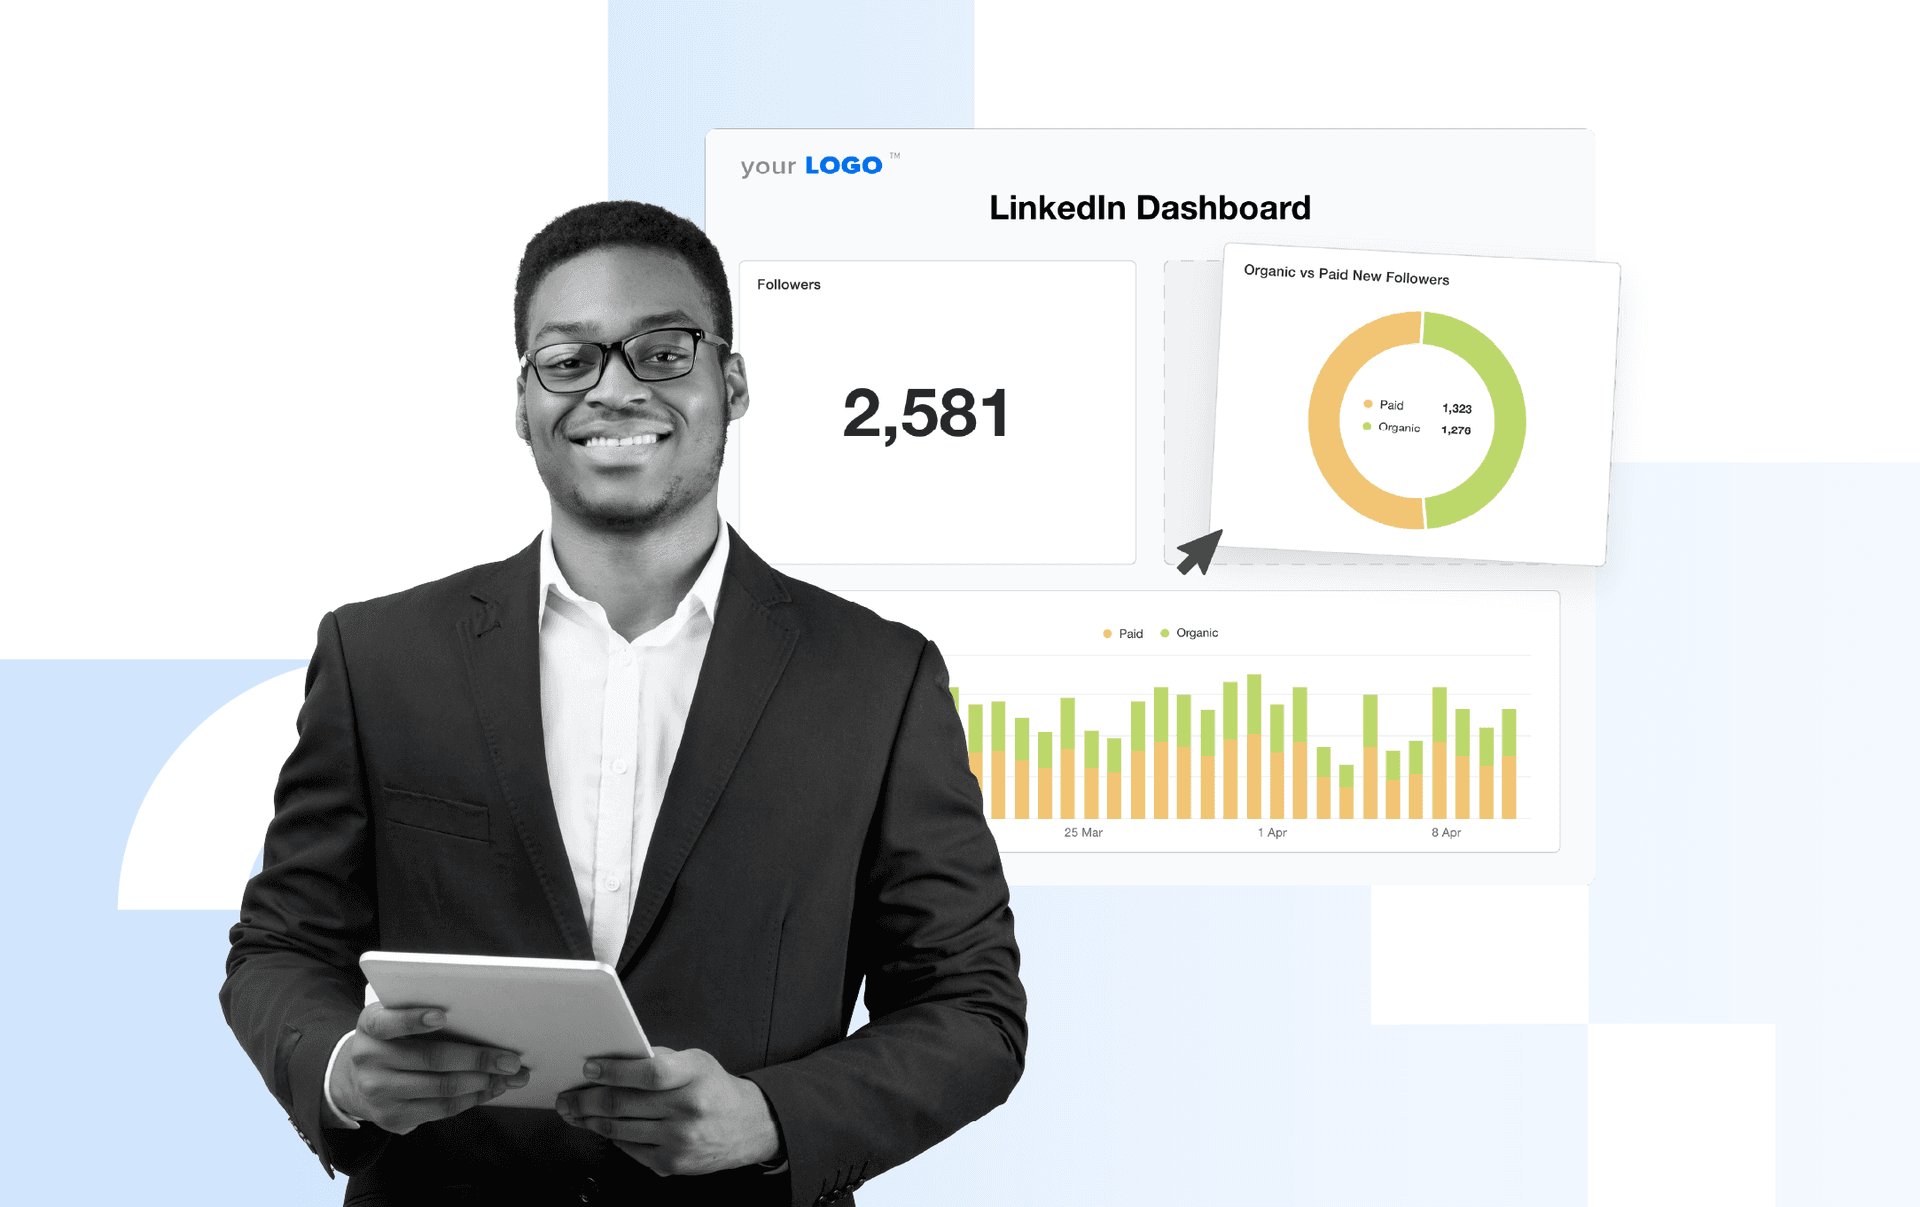
Many dashboard tools offer automated data visualizations as well, making it easy to choose from a plethora of different chart and graph options. It’s usually a good idea to visualize top-level data in some way because it’s visually appealing and gives important information at-a-glance.
There are so many different ways to visualize your dashboard data, but here are a few of the most popular in marketing:
Line charts
Column/Bar charts
Map charts
Pie charts
Sparkline charts
Pick the most intuitive and easy-to-understand data visualization because the whole point of a data dashboard is so you can quickly see all the important numbers. Some metrics might be OK to just show as a simple percentage change, while other metrics you might want to be tracked over a period of time to identify any trends and would be more suited for a line graph.
Over the years, the need for visual aids continue to be the main talking point. Trends, graphs, and columns are always helpful in understanding ebbs and flows within marketing campaigns. - Christopher Marrano, Founder/CEO, Blue Water Marketing
When visualizing your client’s data, make sure your tables, charts, and graphs are intuitive and clear. That means using labels, headings, and titles that make organizing and presenting data in the best way possible to provide meaningful insights.
For example, that means making sure your X and Y axes are labeled properly and if your charts are color-coded, make sure the colors contrast effectively (ie. don’t make a pie chart where all the slices are different shades of green!).
4. Establish a Timeframe
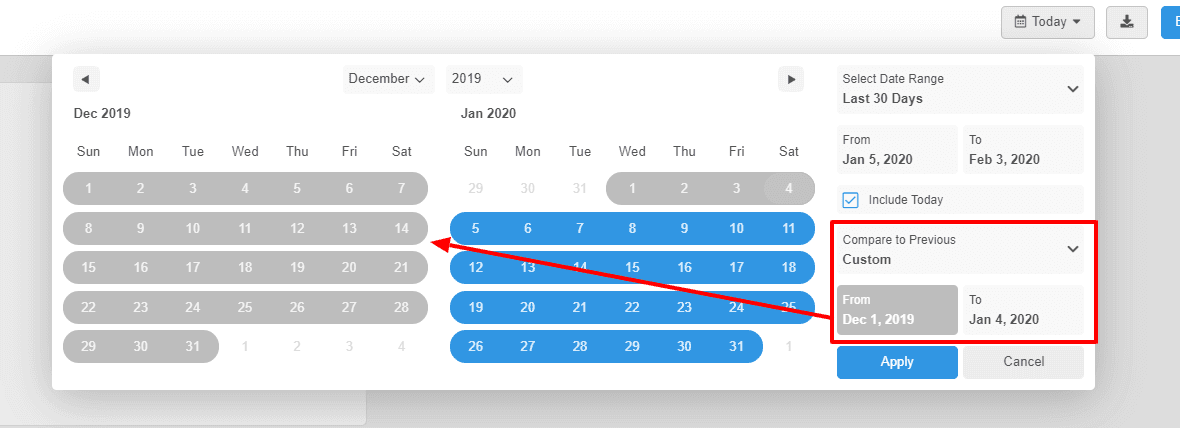
Another important aspect in designing your data dashboards is establishing a timeframe. Sometimes, you might want a dashboard to display info in real time that constantly updates. Other times, you might be interested in showing your clients the results for the last week, month, quarter, or even year. It all depends on what you’re trying to display its purpose.
5. Keep Your Audience in Mind!
As the agency, you’re the experts, and so your client’s marketing knowledge probably isn’t as in-depth as yours. Make sure that the data dashboard will make sense to your client because you don’t want your presentation to become a crash course in marketing metrics and KPIs!
Really incorporate dashboards and reports into meetings. Review the dashboards on all weekly meetings and review the monthly reports at the start of the month with the client. This helps answer any questions the client might have and also gives your client the tools to better talk through reports with others.
- Tim Akers, Founder, Akers Digital
When in doubt, it’s best to keep things short and sweet and make sure to cut the vanity metrics if they don’t fit the context!
How To Create a Data Dashboard With AgencyAnalytics
There are plenty of easy-to-use dashboard templates available online with one-click integrations that you can have up and running within minutes, but AgencyAnalytics' reporting and dashboard software has one of the most comprehensive collections with over 80 platforms and more than a dozen custom dashboard templates to choose from.
Most of our clients are running many services with us across advertising, SEO, and email. It was complicated to combine all of the data before AgencyAnalytics. With AgencyAnalytics, it's much easier to condense the results of our efforts into one dashboard or one report. It paints a better picture of the entire marketing funnel for our clients.
- Graham Lumley, Director of Marketing, Blackhawk Digital Marketing
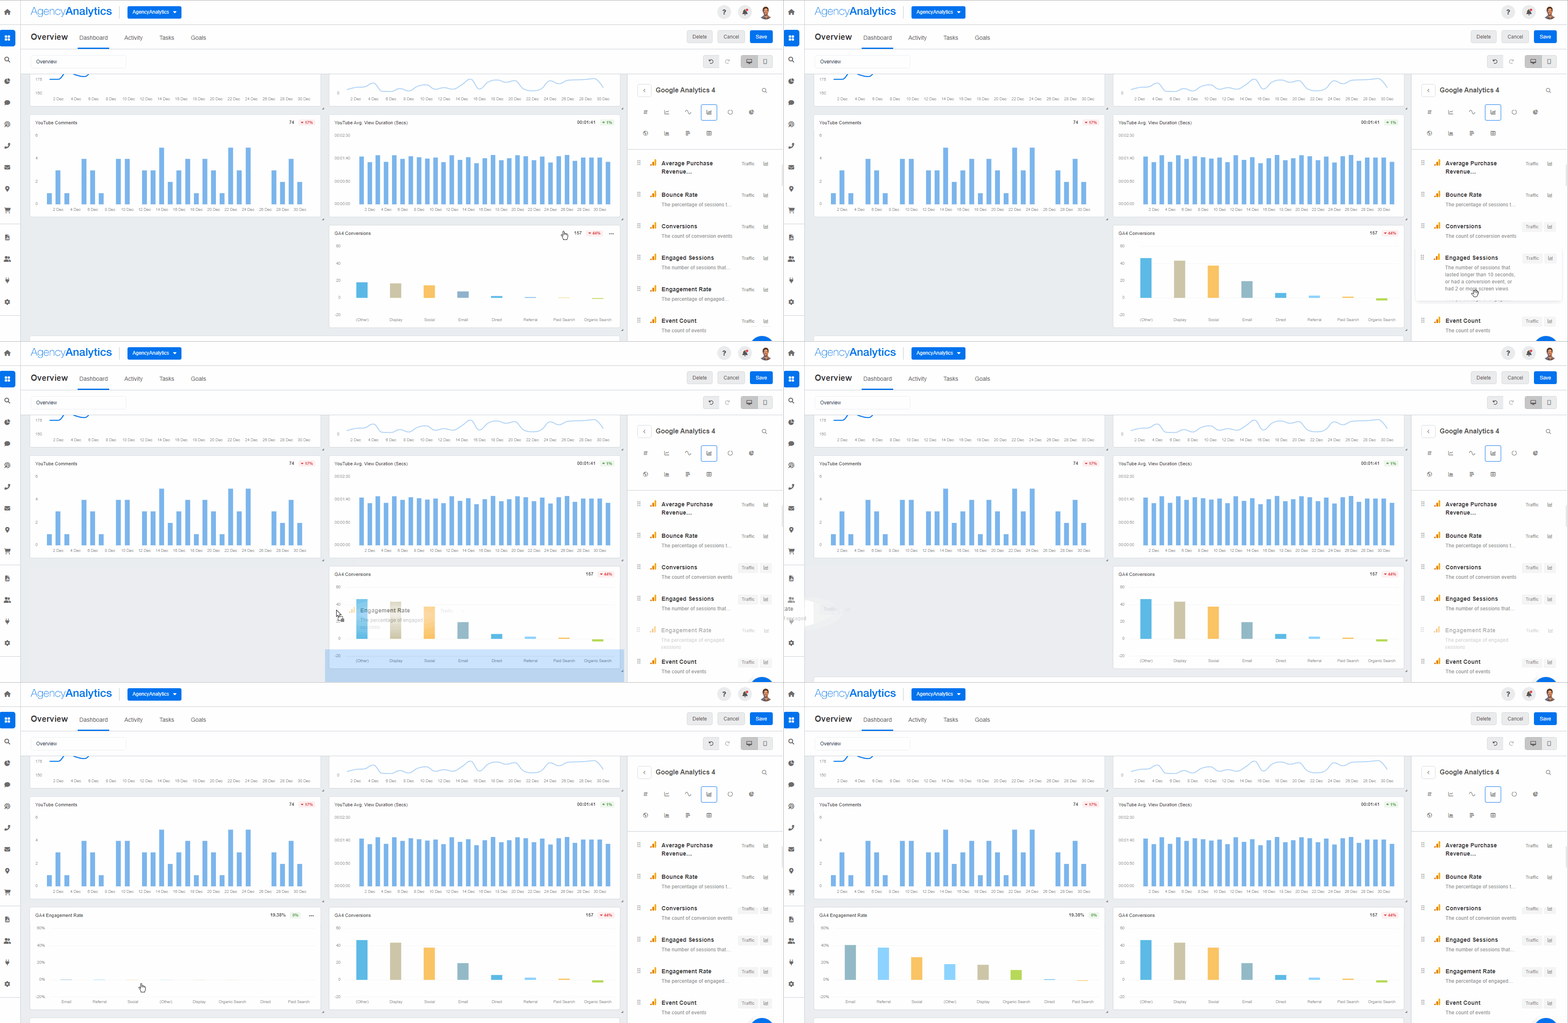
You can also use AgencyAnalytic’s white labeled dashboard builder with custom widgets that connect to over 80 data sources that let you set the date range and bring your clients’ data to life.

Written by
Michael is a Vancouver-based writer with over a decades’ experience in digital marketing. He specializes in distilling complex topics into relatable and engaging content.
Read more posts by Michael OkadaSee how 7,000+ marketing agencies help clients win
Free 14-day trial. No credit card required.


