Dashboard Reporting Software

Up-to-date Insights
Give clients 24/7 access to their most important performance metrics.
All-in-one Dashboards
See cross-channel marketing data instantly—all on one dashboard.
Drag, Drop, Done
Design dashboards that match client priorities and reporting styles.
Trust & Transparency
Transparent reporting that keeps clients informed and strengthens retention.
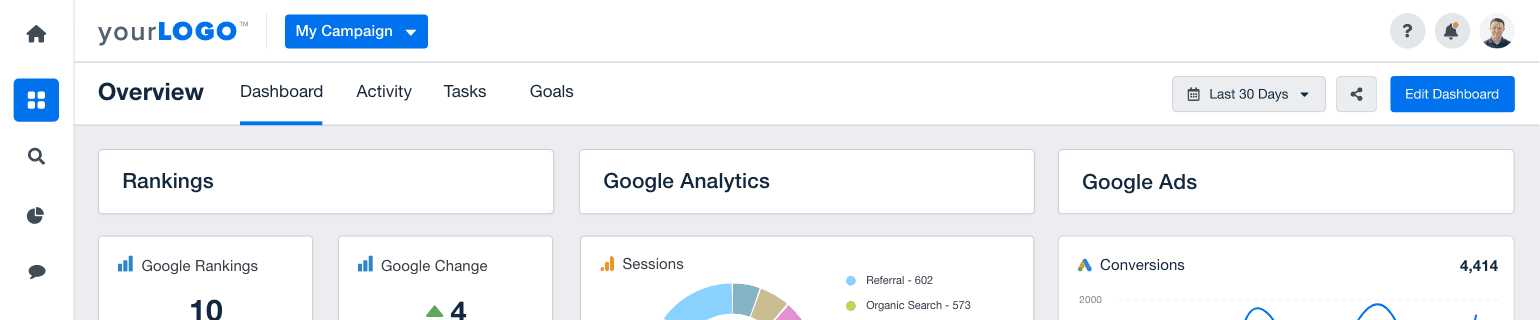
Build Dashboards That Match Client’s Needs
Create personalized dashboards that highlight the most important KPIs for each client. Whether you're tracking SEO, PPC, or multi-channel campaigns, it’s easy to show what matters most—so clients get clear, meaningful insights without digging through data.
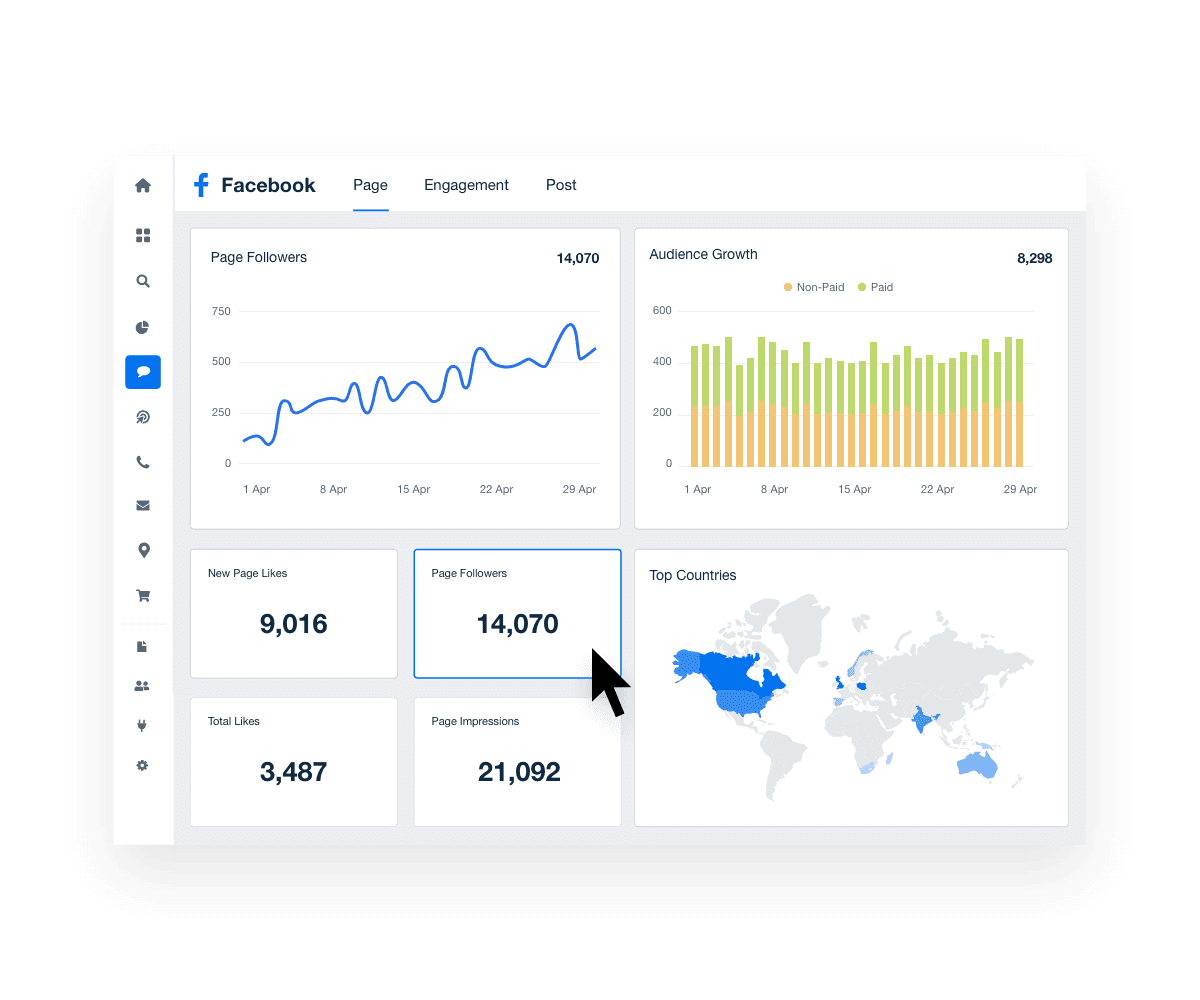
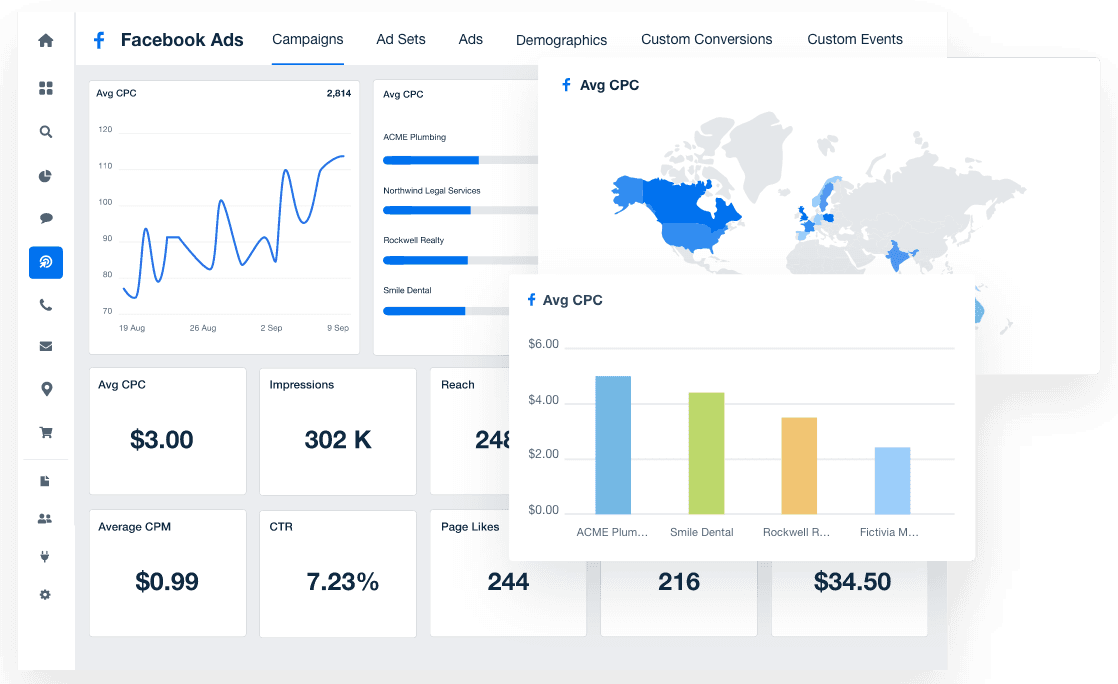
See Every Campaign Metric in One Place
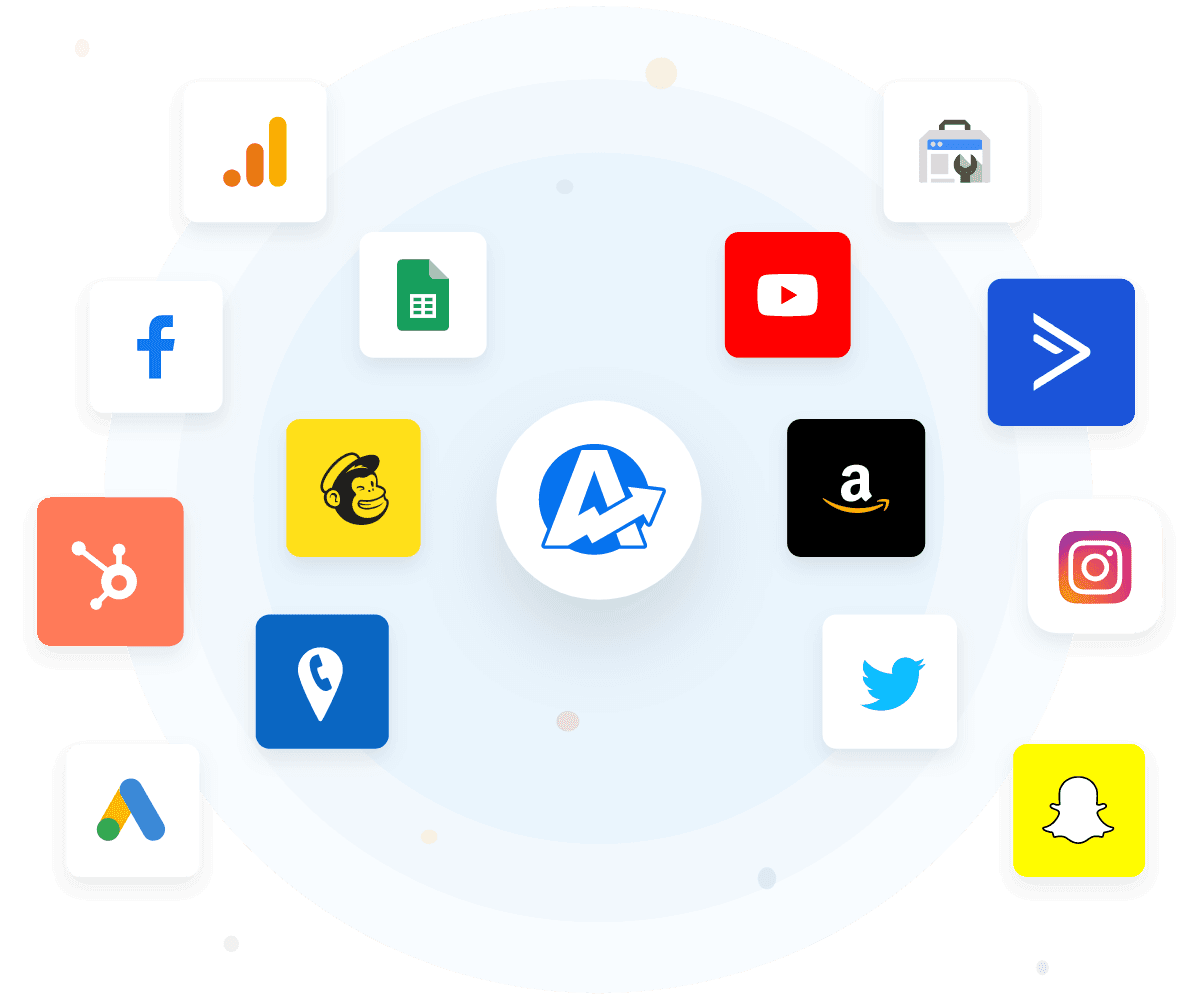
No more jumping between tools. With 80+ integrations, your clients' marketing data flows into one real-time dashboard.
The dashboard software offers seamless data integration with core data sources like Google Analytics, Facebook, and more. From data exploration to in-depth analysis, automatically pull data across channels, aggregate raw data, and transform it into valuable insights—all from one analytics platform built for marketing agencies.
Easily Design No-Code Reporting Dashboards
Use our drag-and-drop editor to create stunning dashboards in minutes. Drop in widgets, rearrange sections, and showcase performance without touching a line of code—perfect for fast-moving teams that want to look polished without delays.

Joshua George, Founder
ClickSlice
Create Custom Dashboards & Reports In Minutes
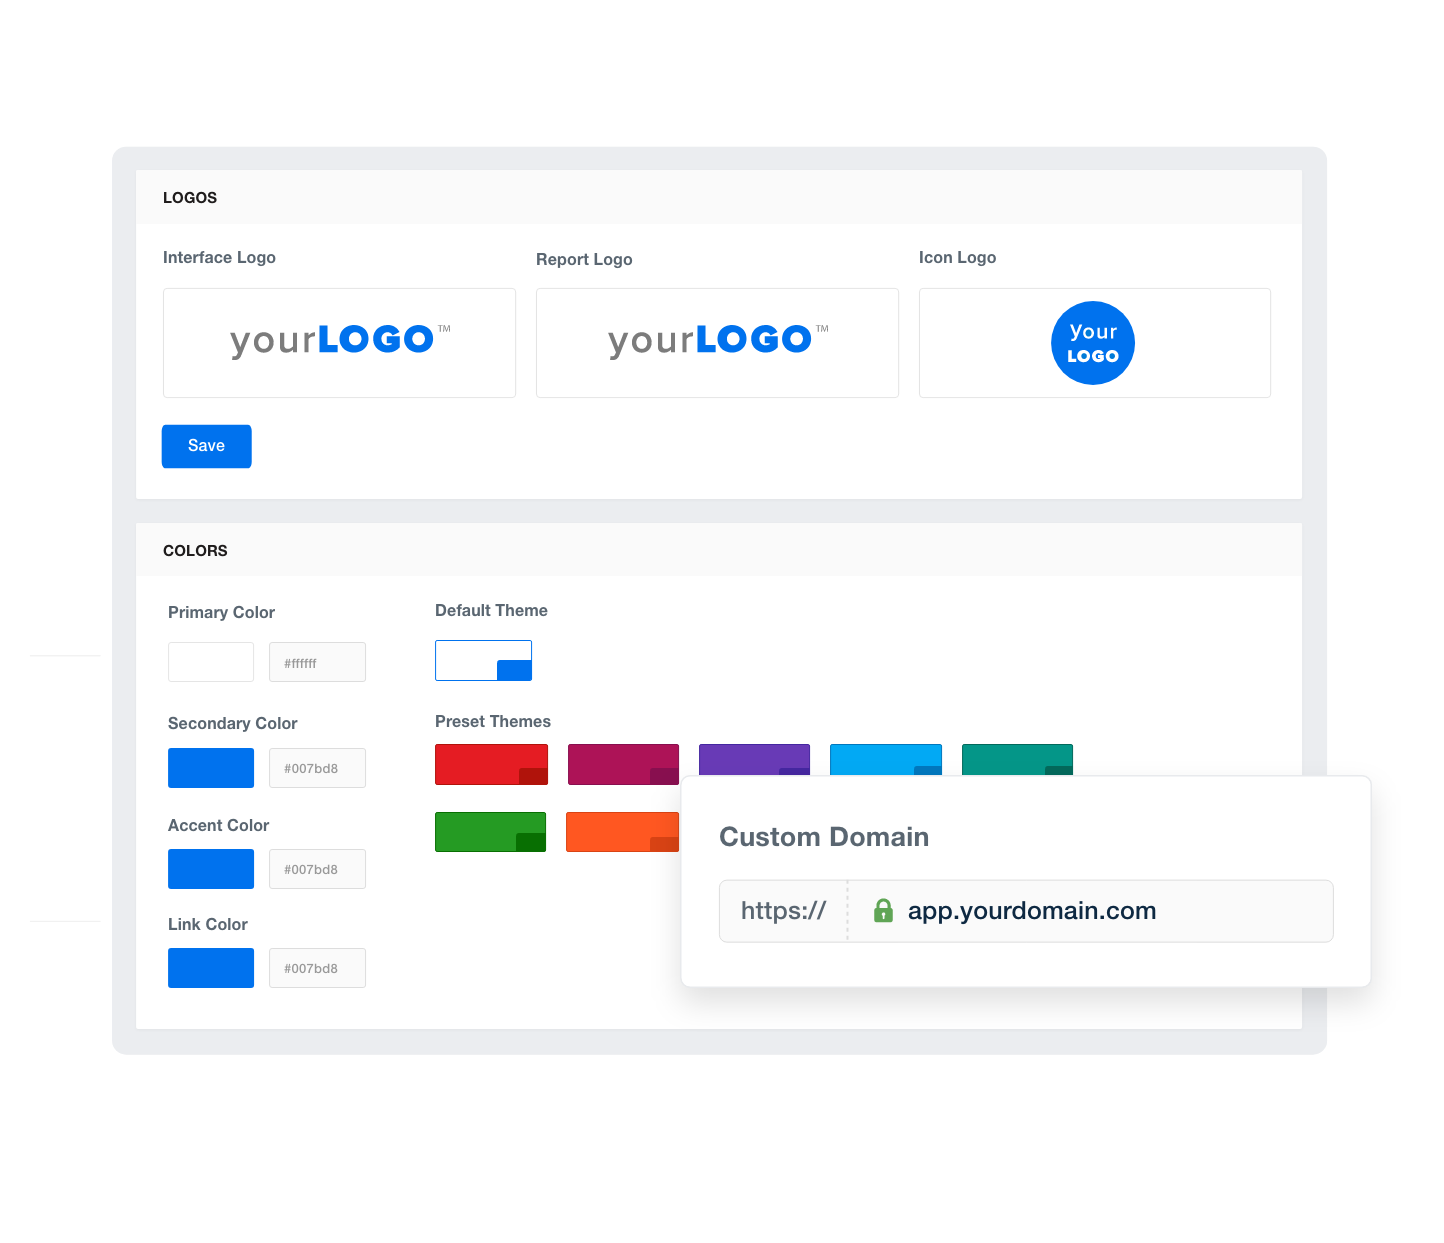
Put Your Agency’s Brand Front and Center
Add your logo, brand colors, and custom domain to every dashboard. With white-labeled dashboards, your agency stays top of mind—giving clients a seamless, professional experience that reinforces your value at every touchpoint.
Deliver Always-On Access to Key Metrics
No more waiting for monthly updates. Give clients real-time access to their dashboards, so they can see performance anytime. It builds confidence, reduces questions, and turns your agency into a proactive partner—not just a service provider.
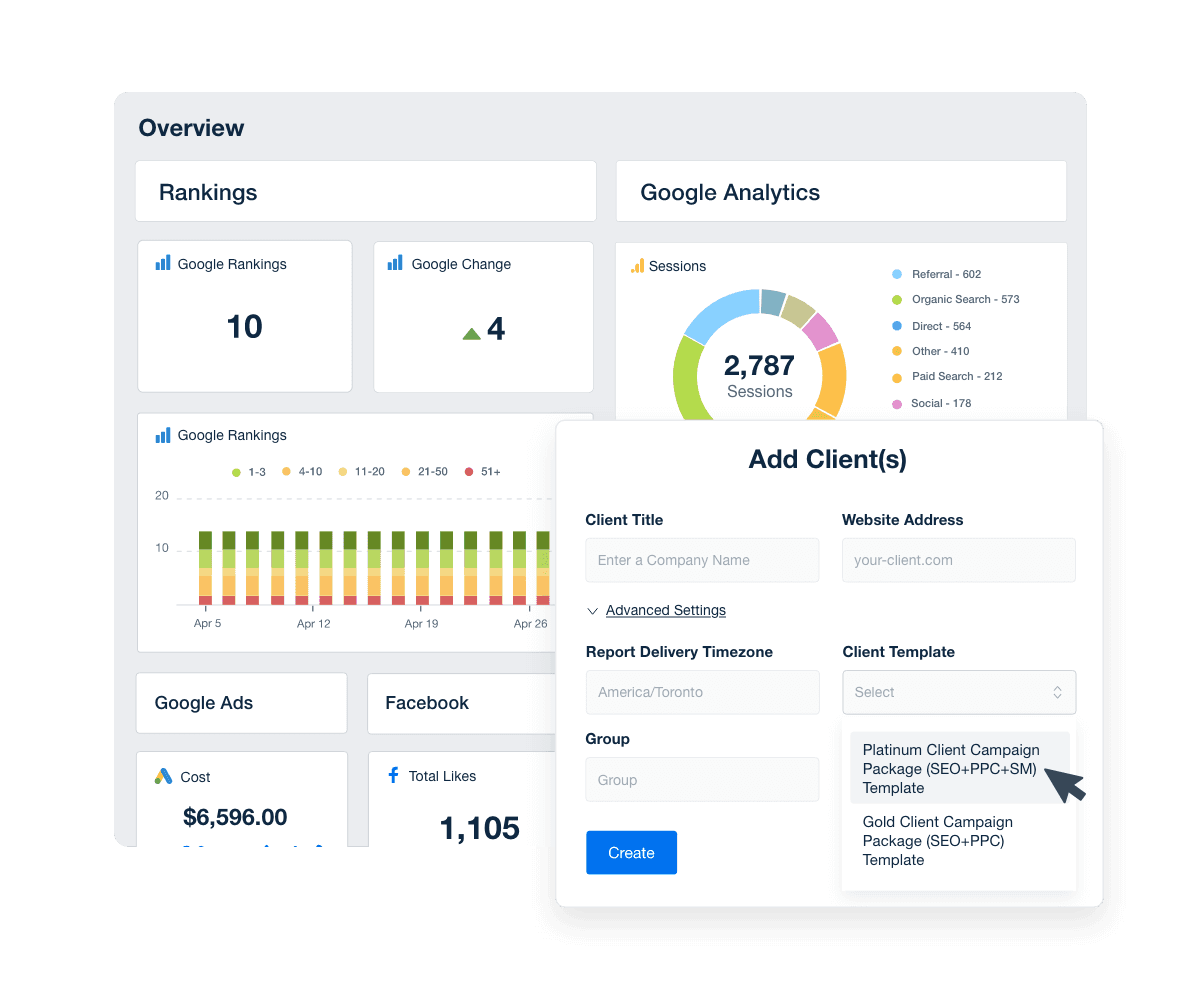
Launch Reporting Dashboards Faster With Prebuilt Templates
Choose from dozens of professionally designed dashboard templates built for marketing agencies. Whether you’re reporting on SEO, PPC, or social, templates give you a head start—so you can create and customize dashboards in less time.
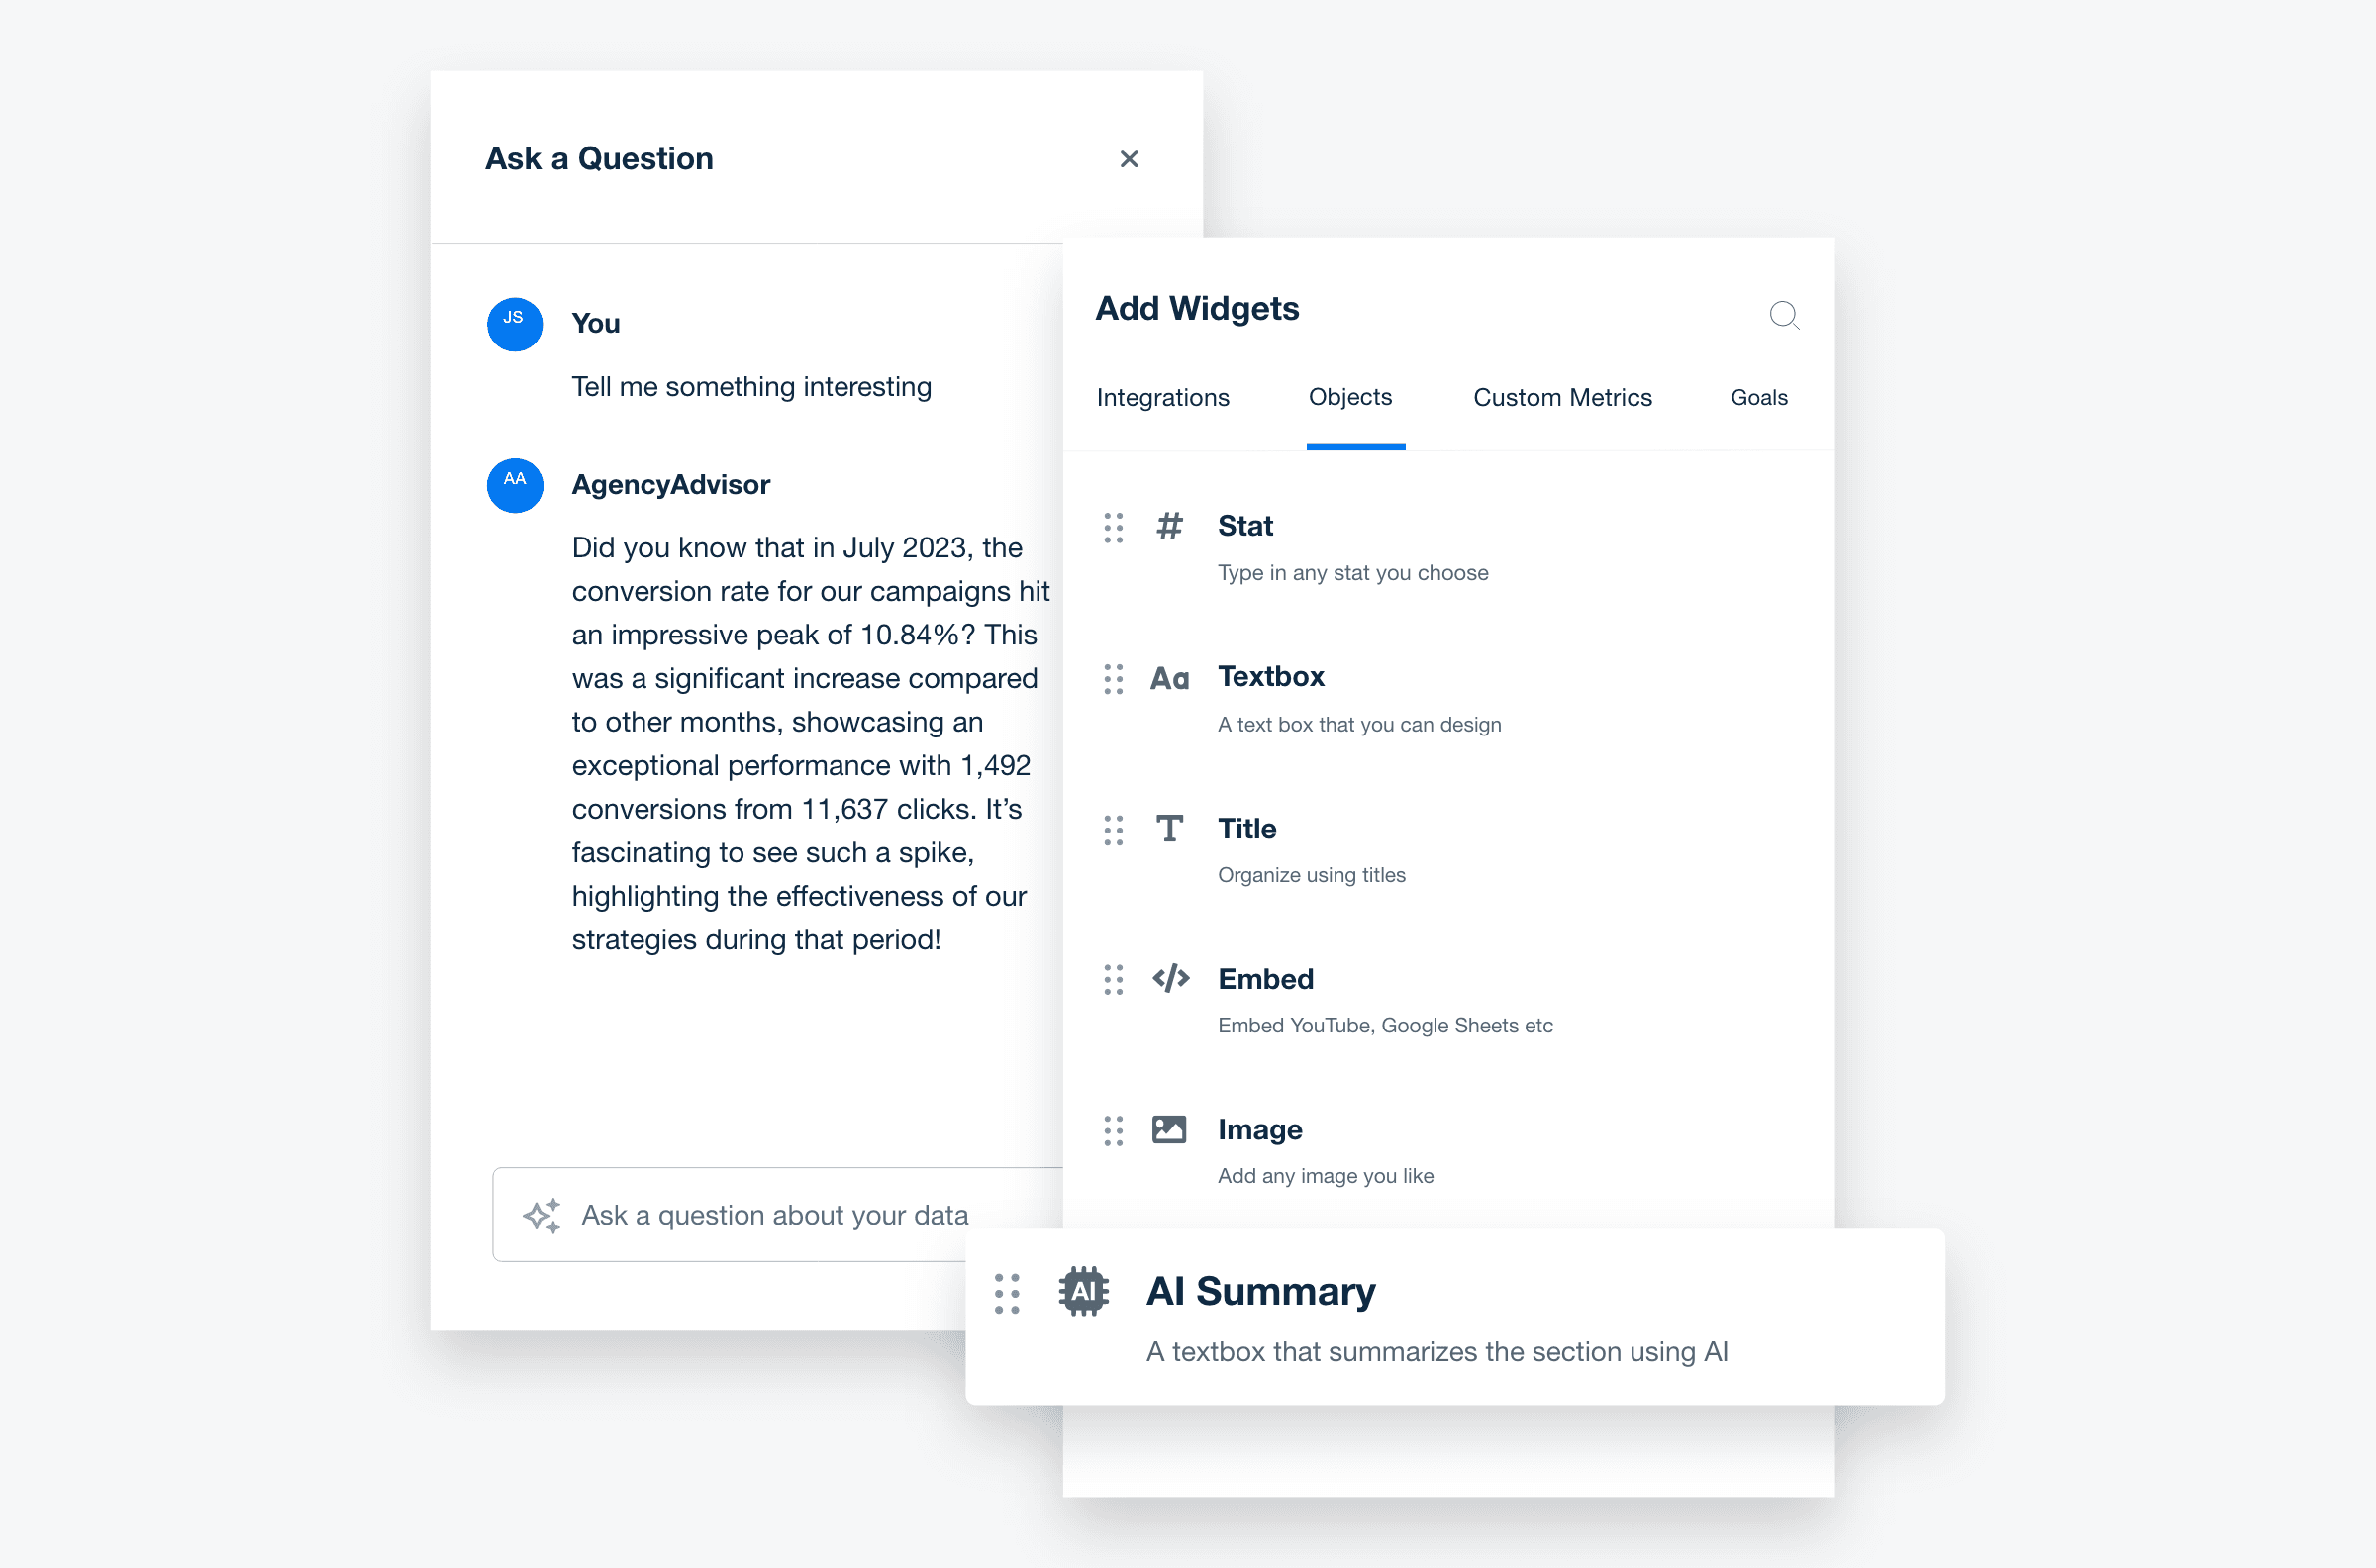
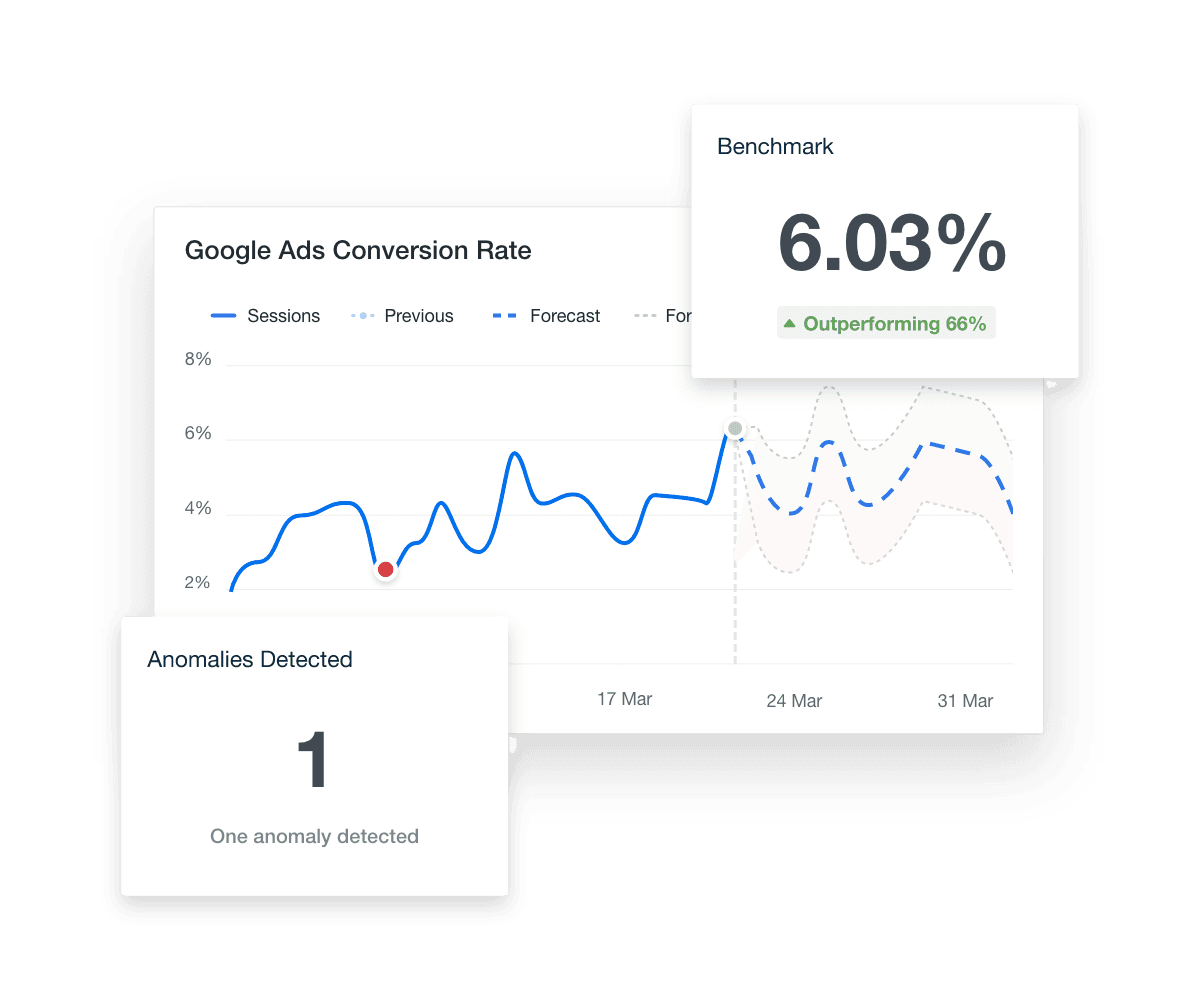
Let AI Highlight the Metrics That Matter Most
Use built-in AI tools to surface key wins, performance trends, and actionable insights—automatically. It’s like having an extra analyst on your team, helping you save time and spot what’s working before your clients even ask.
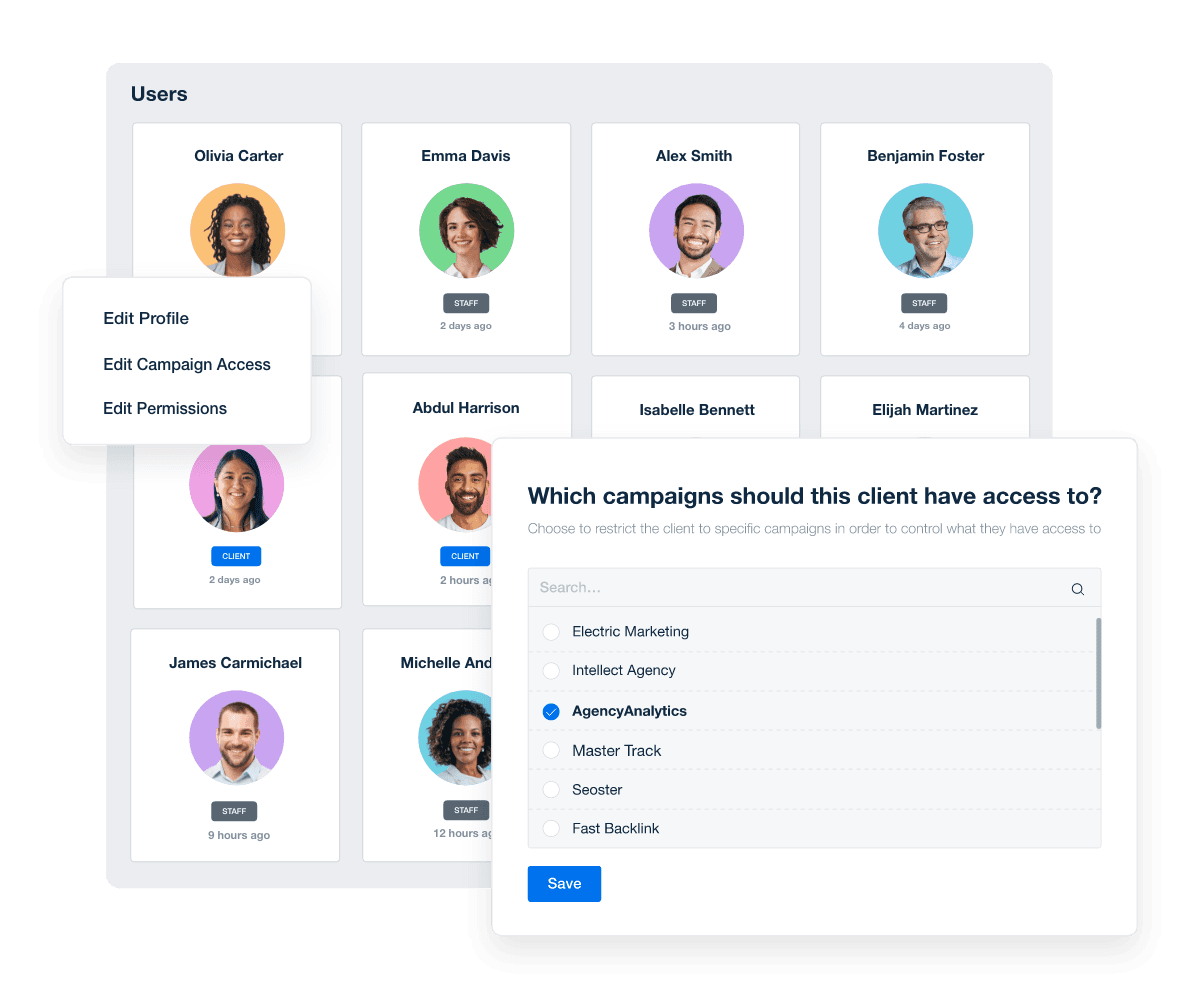
Unlock Real-Time Data Access for Every User
The dashboard tool makes it easy for users to explore their own data through a simple user interface—no training required. With unlimited users, custom data widgets, and seamless data connections, agencies create dashboards that provide a comprehensive view, uncover user behavior, and support data storytelling that delivers valuable insights.


Lily Zimmel, Agency Director
Envida
Discover the All-in-One Reporting Tool Trusted by 7,000+ Marketing Agencies
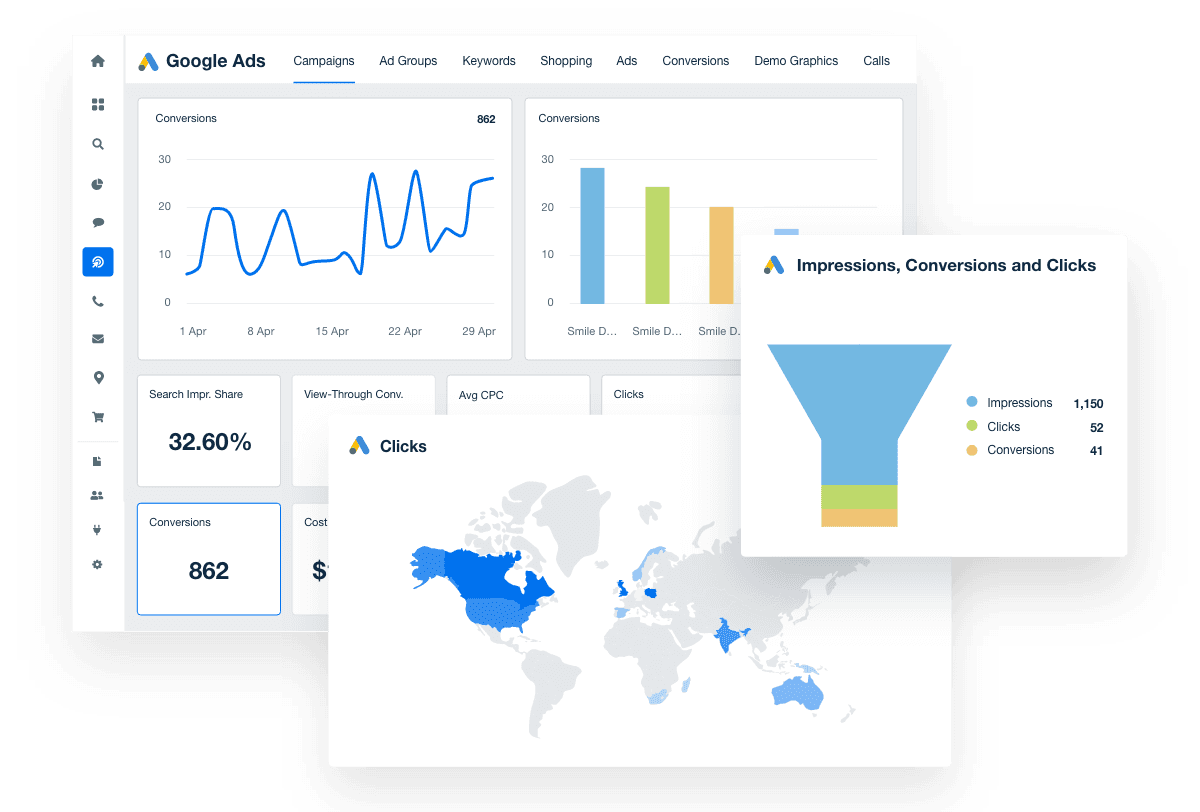
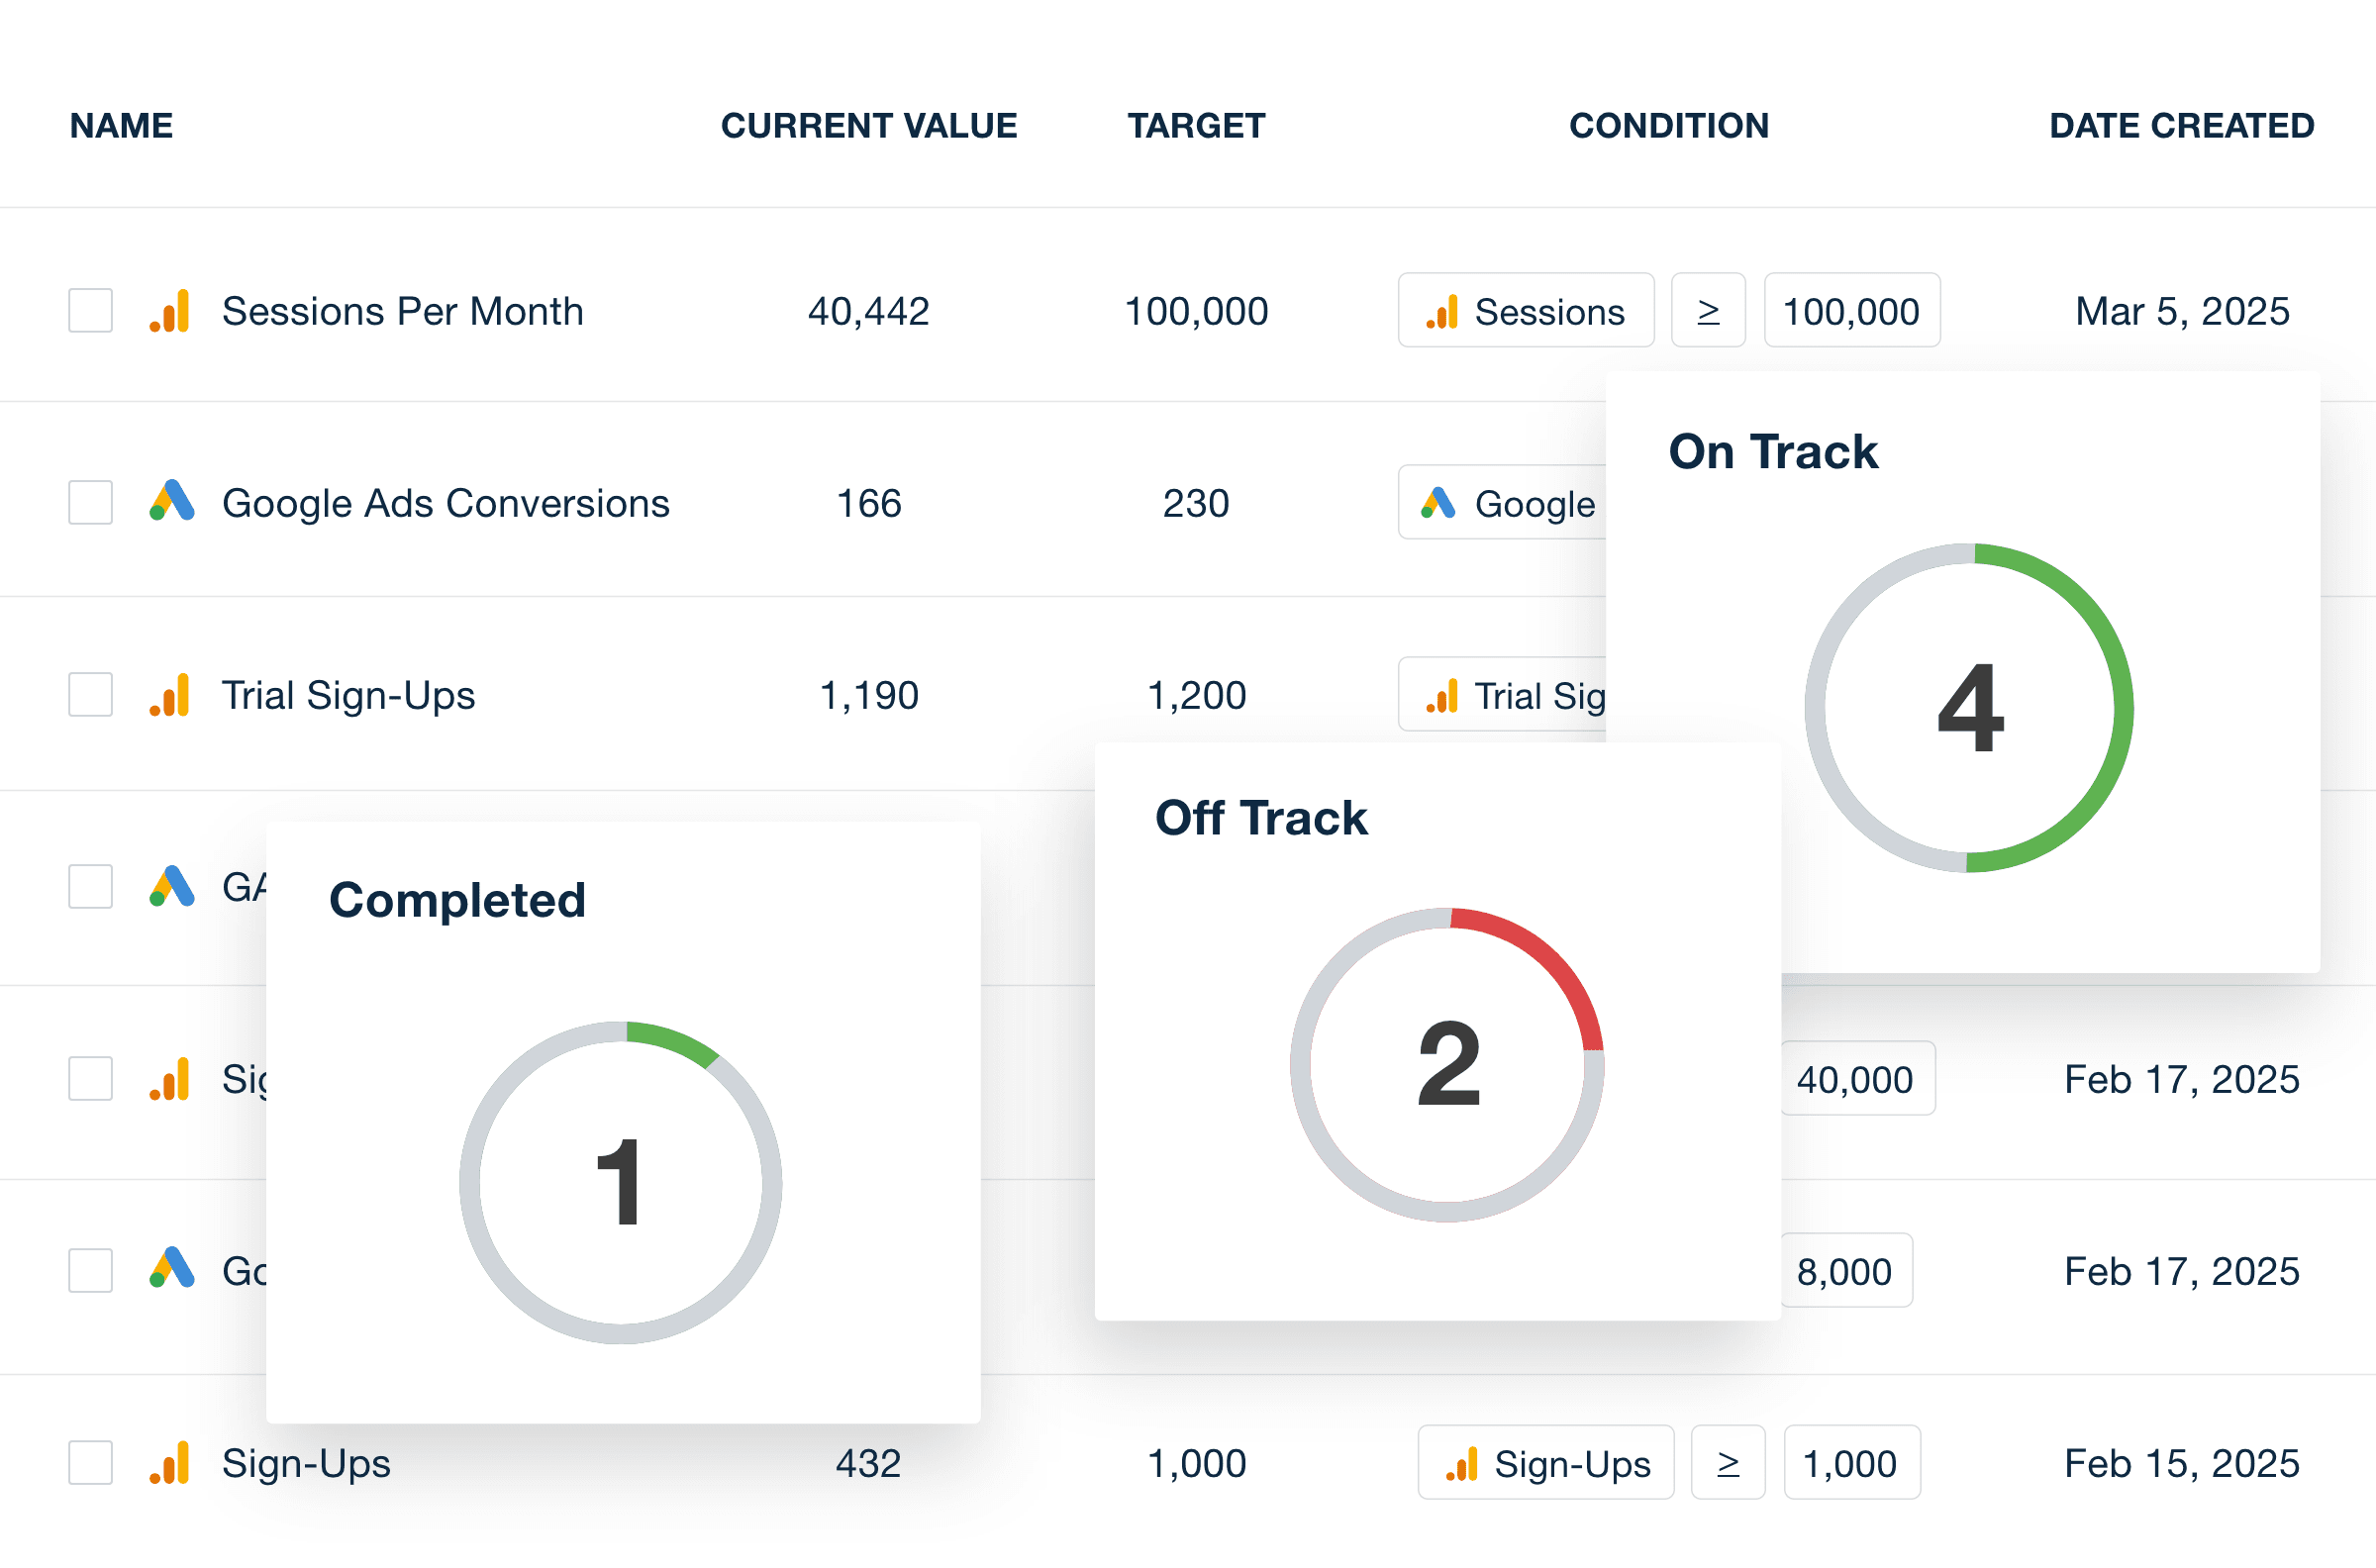
Visualize Progress Toward KPIs and Ad Spend Targets
Set campaign goals and budget limits directly in your dashboards. With visual indicators and progress bars, you can quickly show clients how their campaigns are pacing—keeping expectations aligned and proving your team’s performance.
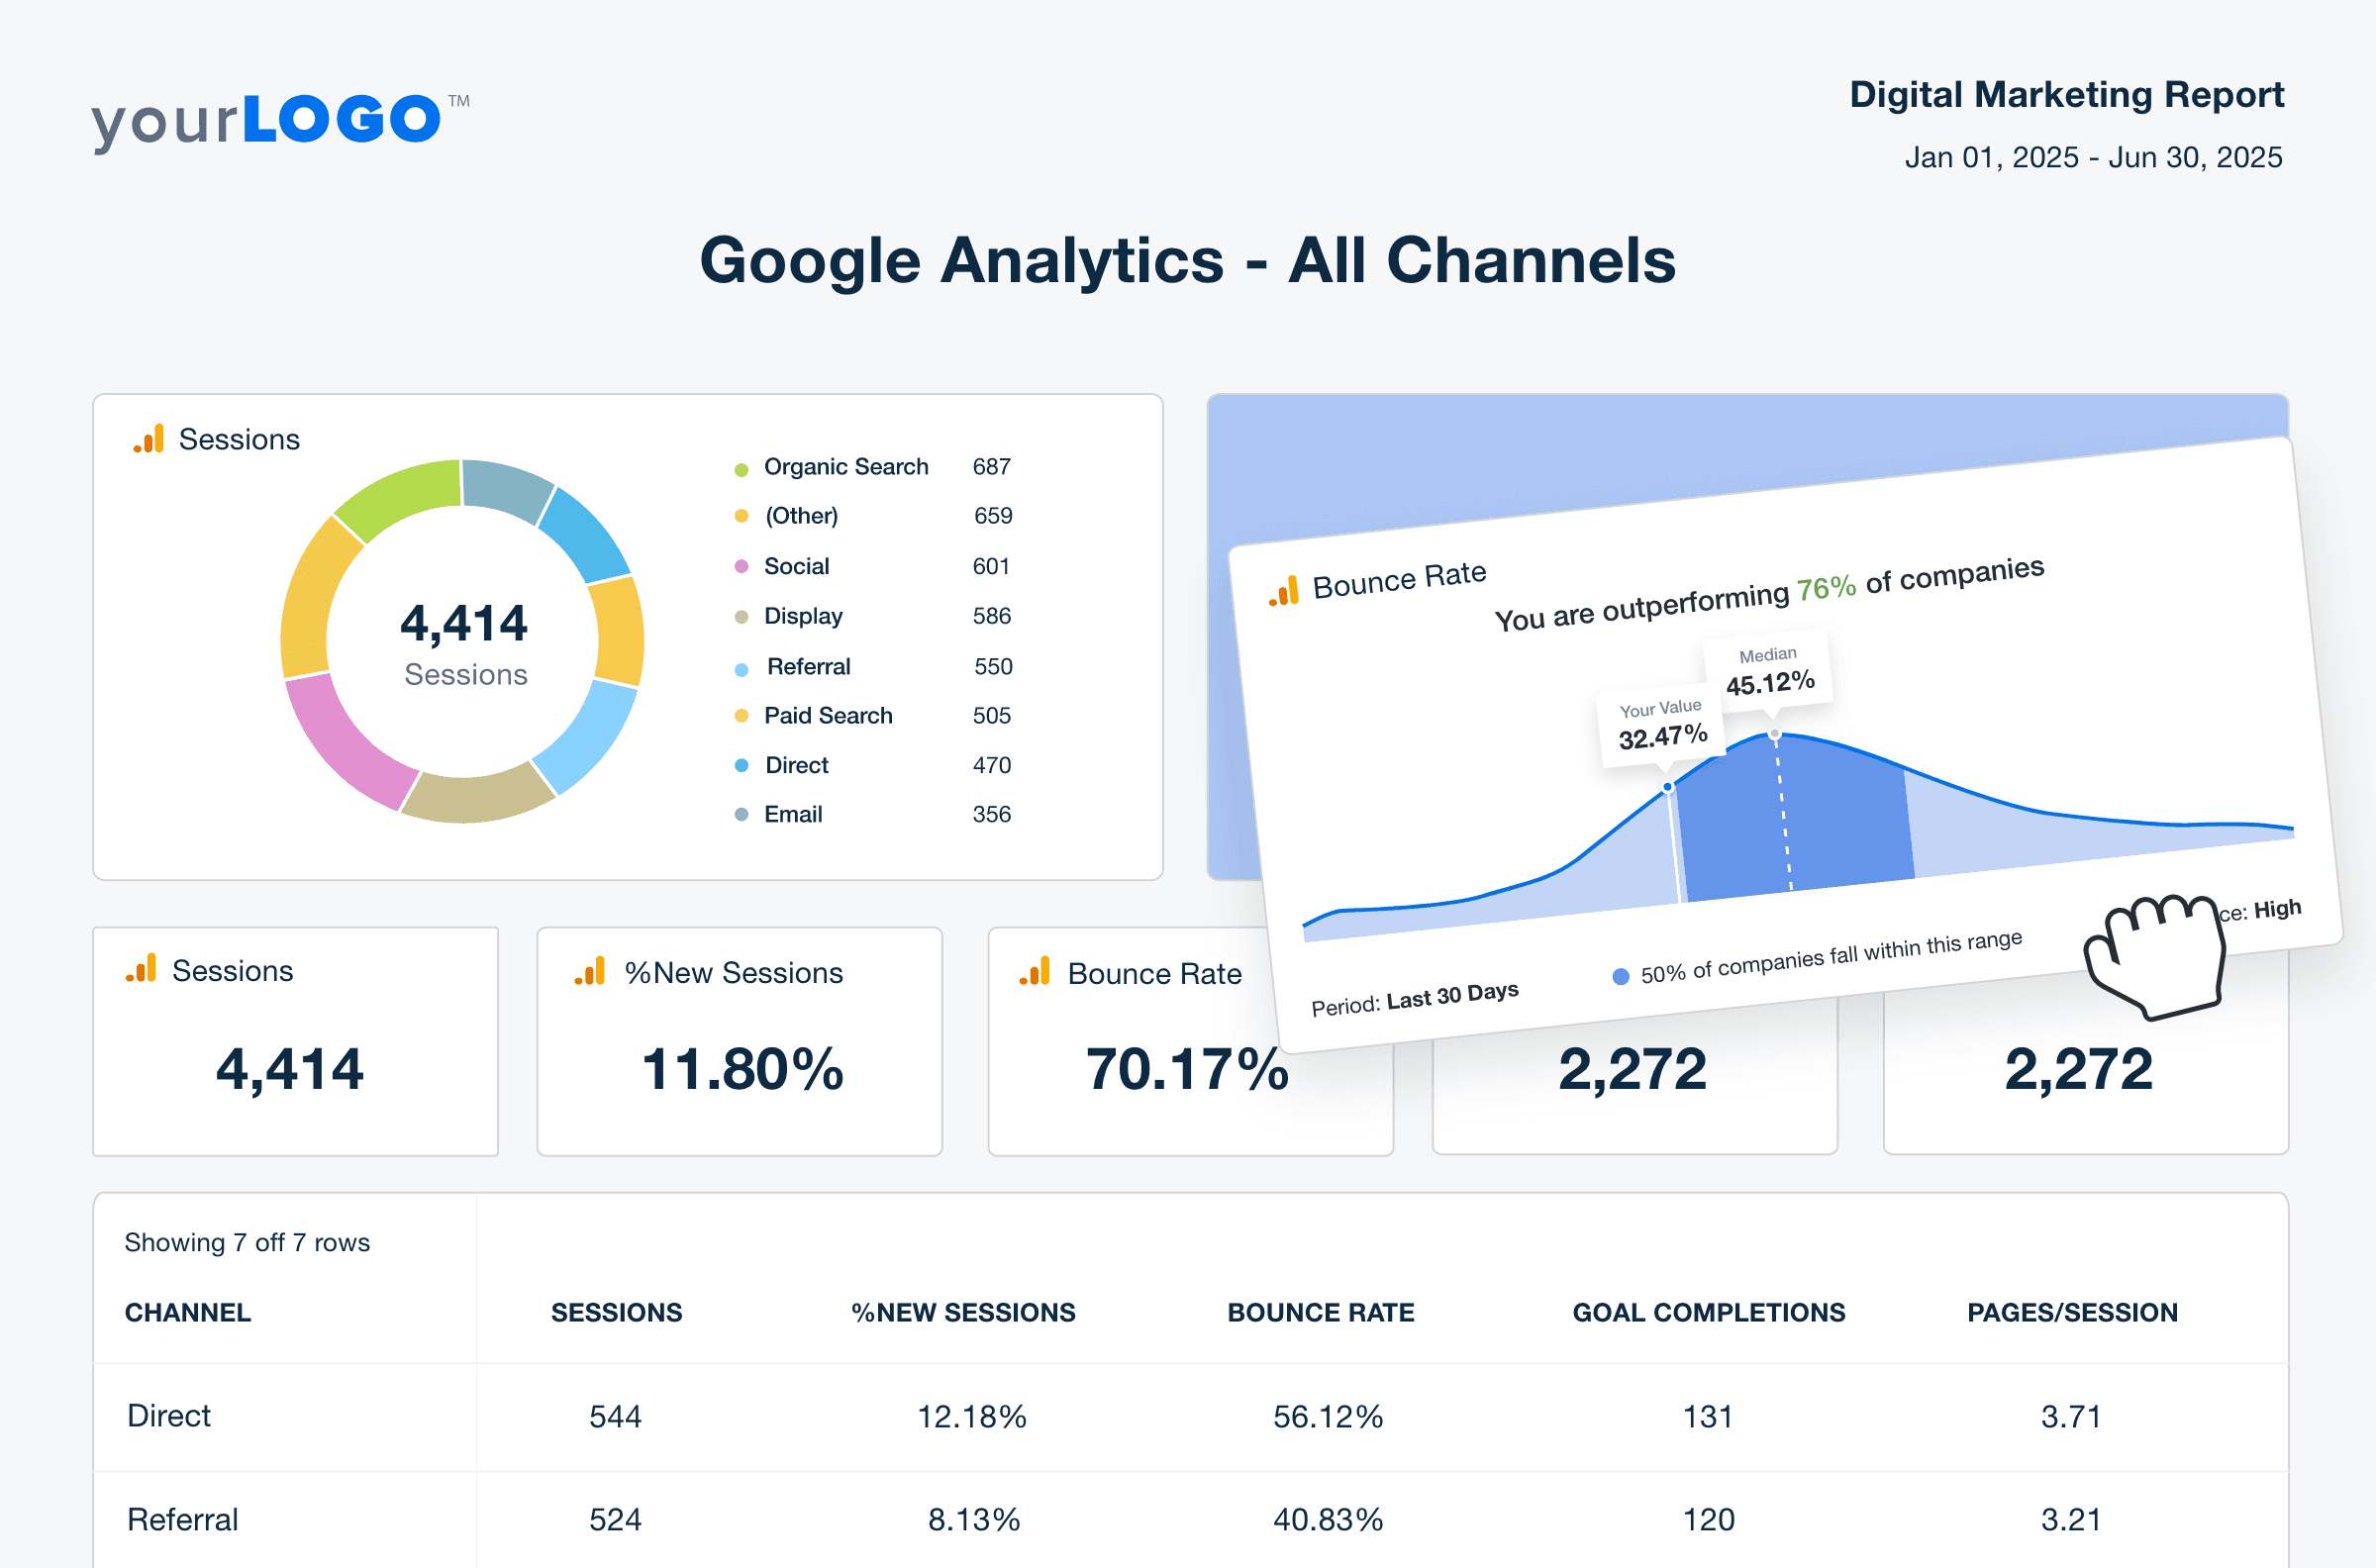
Explore Data With Live, Visual Dashboards
Interactive dashboards make it easy for business users to explore data in real time. With built-in pie charts, bar charts, and drag-and-drop interface, your team can present data clearly, uncover data patterns, and drive smarter decisions—without needing a data scientist.
Create Reports & Deliver Insights Without Bottlenecks
Give your agency and clients the power of self-service analytics and deliver polished, professional insights. From dashboard creation to interactive reports, business users can import data, customize views, and analyze performance without waiting on data teams or learning SQL databases.
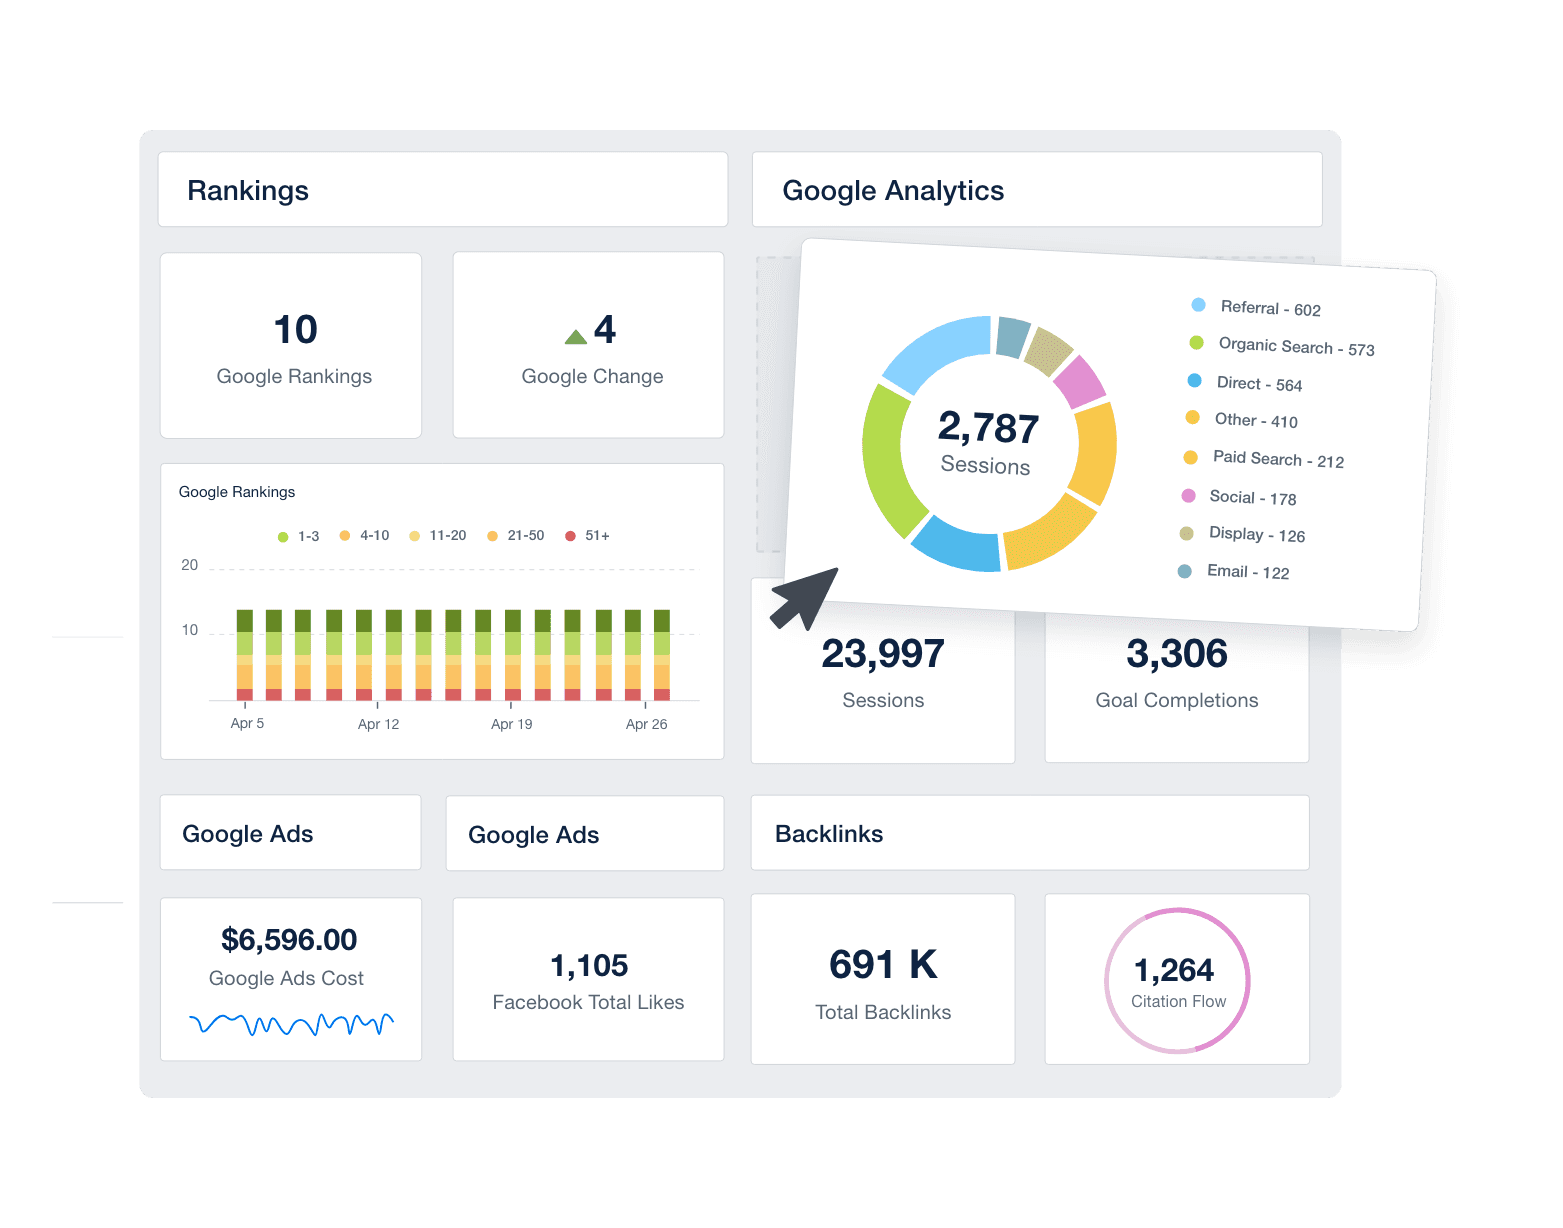
Drive Data-Driven Decisions With Purpose-Built Tools
The dashboard reporting tool is built to support complex data analysis and business intelligence needs. Create interactive dashboards that use the best data visualization techniques, from charts to interactive maps and more, present data in ways that support business processes, enable businesses to act faster, and uncover insights that drive growth.
Automate Reporting and Focus on What Moves the Needle
Stop chasing data across disparate data sources. Dashboard software tools handle the data aggregation and data analytics for you—turning complex information into ready-to-share data insights. With built-in key features and a responsive customer support team, your agency explores data faster and spends more time providing valuable insights—not playing data analyst.
Get Started for Free