Table of Contents
QUICK SUMMARY:
Struggling to turn raw data into client-friendly insights? This guide shows you how to write effective data analysis reports, with expert advice from leading agencies. Learn what to include, avoid common mistakes, and use tools that save time while proving your value
Your agency’s success depends on more than good work; it depends on how well you communicate it to your clients. It’s not enough to show clicks, impressions, or conversions in a silo. Clients want the whole story behind those numbers.
That’s why understanding the difference between reporting and analytics is critical. Reporting tells clients what happened. Analytics tells them why it happened and what to do next. When you combine the two effectively, you do much more than deliver information—you drive smarter decisions.
Here’s the problem: too many agencies are still wasting hours cobbling together data analysis reports manually, through spreadsheets, screenshots, disconnected tools—it’s a mess. All that time spent on busywork means less time delivering real value to clients.
Learning how to build strong data analysis reports changes everything. When done right, these reports save you plenty of time, surface valuable insights clearly, and help position your agency as a strategic partner.
Whether you're reporting on SEO, PPC, or social media, this guide covers how to write a data analysis report, avoid common mistakes, and use practical tools to get started faster.
Read on to discover real-world reporting tips from leading agencies that have streamlined the process, saved time, and strengthened client retention.
What Is a Data Analysis Report?
Before we discuss how to write a data analysis report, let’s define what this document is.
A data analysis report is a structured document that turns raw performance metrics into meaningful, actionable insights. It combines quantitative and qualitative data (hard numbers, plus context and interpretation) to evaluate performance, share findings, and shape more innovative marketing strategies.
Instead of just listing key metrics and campaign results, a great data analysis report explains:
What happened
Why it happened, and
What to do next
Agencies use data analysis reports to:
Validate the ROI of campaigns
Identify which tactics are working well (and which aren’t)
Back strategic recommendations with relevant data
Why Data Analysis Reports Matter
For growth-minded agencies, data analysis reports offer a strategic advantage and are one of your most powerful levers for long-term growth.
Here’s what happens when you get reporting right:
Clients See the Whole Picture: Great reports connect data across customer behavior, website performance, and conversion rates, giving clients clear context, not just numbers. This enhances agency/client communication and collaboration.
Clients Stick Around: A strong report builds trust, and trust drives retention. Transparent reporting demonstrates the impact of your marketing efforts and keeps clients invested for the long haul.
You Stand Out as a Partner, Not a Vendor: Sharp executive reports position your team as trusted advisors rather than task runners.
You Stop Wasting Hours: Automating your data analysis process and reporting frees up your team’s time to focus on strategy instead of building reports from scratch.
You Grow Revenue Faster: Effectively highlighting your wins sets the stage for more data-driven marketing, where every upsell and cross-sell feels like a natural next step, not a sales pitch.
In a nutshell: the better your reports, the faster your agency scales!
Delivering actionable insights isn't just a service we offer; it's our secret sauce for boosting our success! It's all about going beyond mere data delivery. We're here to help clients understand the impact of that data and take concrete steps toward reaching their goals. And guess what? This not only makes our clients happier, but also keeps them coming back for more. It's a win-win that's all about shared success!
Michelle van Blerck, Communications Manager, Digital Freak
3 Key Elements of a Great Data Analysis Report
Speaking of better reports, how do you ensure they deliver value rather than a flood of disconnected numbers? You start by getting the core elements right.
Every strong data analysis report needs a few non-negotiables to turn relevant data into a compelling story.
1. A Clear Purpose
Every report needs a lens. Without it, you risk dumping historical data without direction, leaving clients confused instead of confident!
Your purpose sets the frame for the entire data analysis process. Without it, even the best essential metrics won’t move the conversation forward.
2. A Logical Structure
Your clients don’t have time to decode endless tables and raw metrics.
They need clarity, and fast! Every data analysis report should follow a logical, repeatable structure that makes your insights instantly digestible.
Later in this article, we’ll review a proven report structure that balances clarity, context, and action without overwhelming your client.
3. Data Visualizations
Data visualization is where reports either shine or fall flat.
Walls of raw quantitative data and qualitative data won’t convince busy clients. But clear, simple charts, graphs, and visual callouts make your insights impossible to miss.
Strong visuals do a lot more than make your reports prettier. They make them more actionable, memorable, and valuable to your clients.
Impress clients and save hours with custom, automated reporting.
Join 7,000+ agencies that create reports in minutes instead of hours using AgencyAnalytics. Get started for free. No credit card required.
Data Analysis Report Examples
To master report writing, it’s helpful to see how the key elements work in practice. Here are a few real-world examples of data analysis reports that show what strong reporting looks like.
We’ll share when to use each example, key metrics to include, and some helpful insights to call out.
1. SEO Data Analysis Report Example
A well-structured SEO data analysis report uncovers how content and keywords are performing and what’s holding rankings back. Use it to surface actionable insights from SEO analytics, track organic traffic trends, and prioritize optimizations that move the needle.
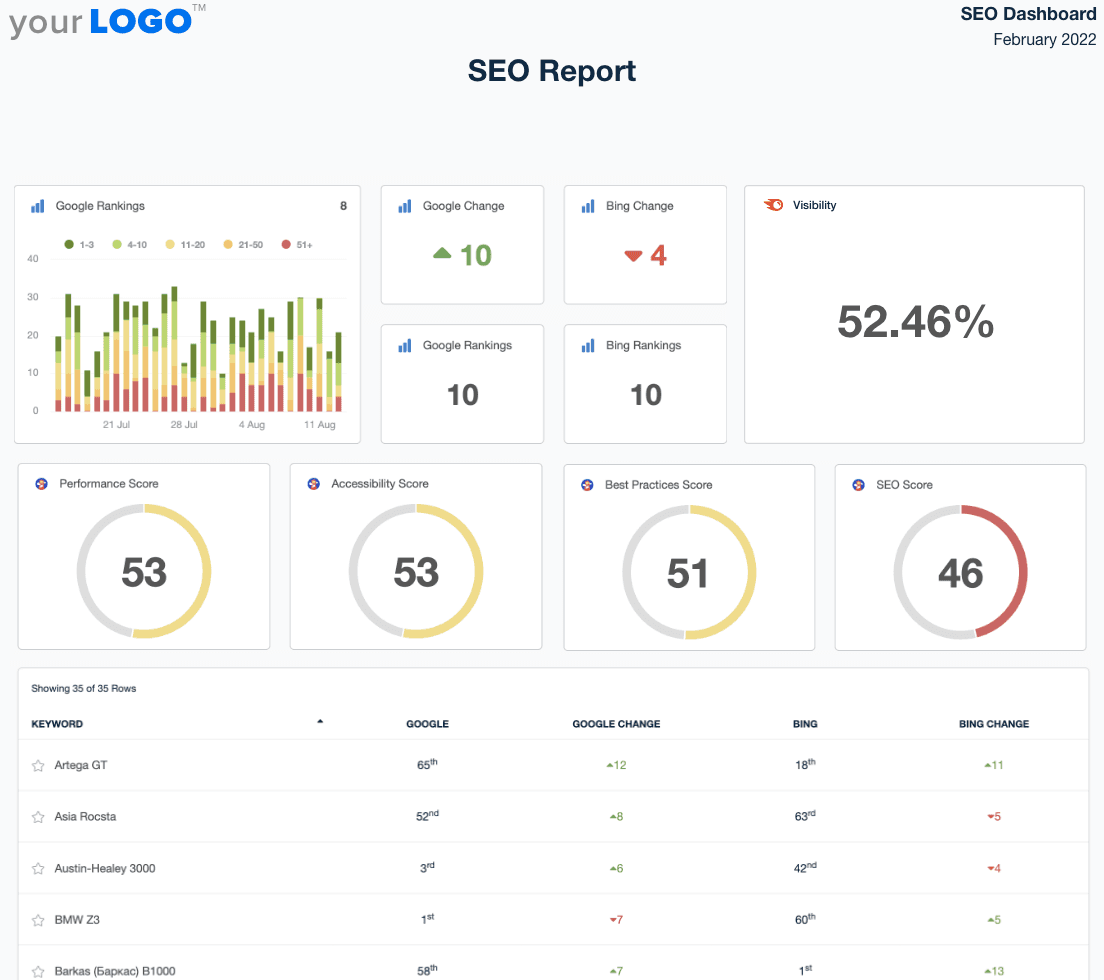
Purpose: To show organic traffic growth and identify optimization opportunities.
What To Include:
Traffic trends from organic search
Keyword rankings and movement
Top-performing pages
Backlink growth
Technical issues (e.g., crawl errors)
Insights To Call Out:
Which content pieces are driving the most traffic?
Where rankings dropped (and why)?
Which keywords show opportunity for low-hanging gains?
2. Social Media Data Analysis Report Example
A strong social media data analysis report translates social media marketing analytics into strategic guidance. It connects engagement metrics to broader goals like traffic, reach, and conversions to help shape content strategy and ad spend.
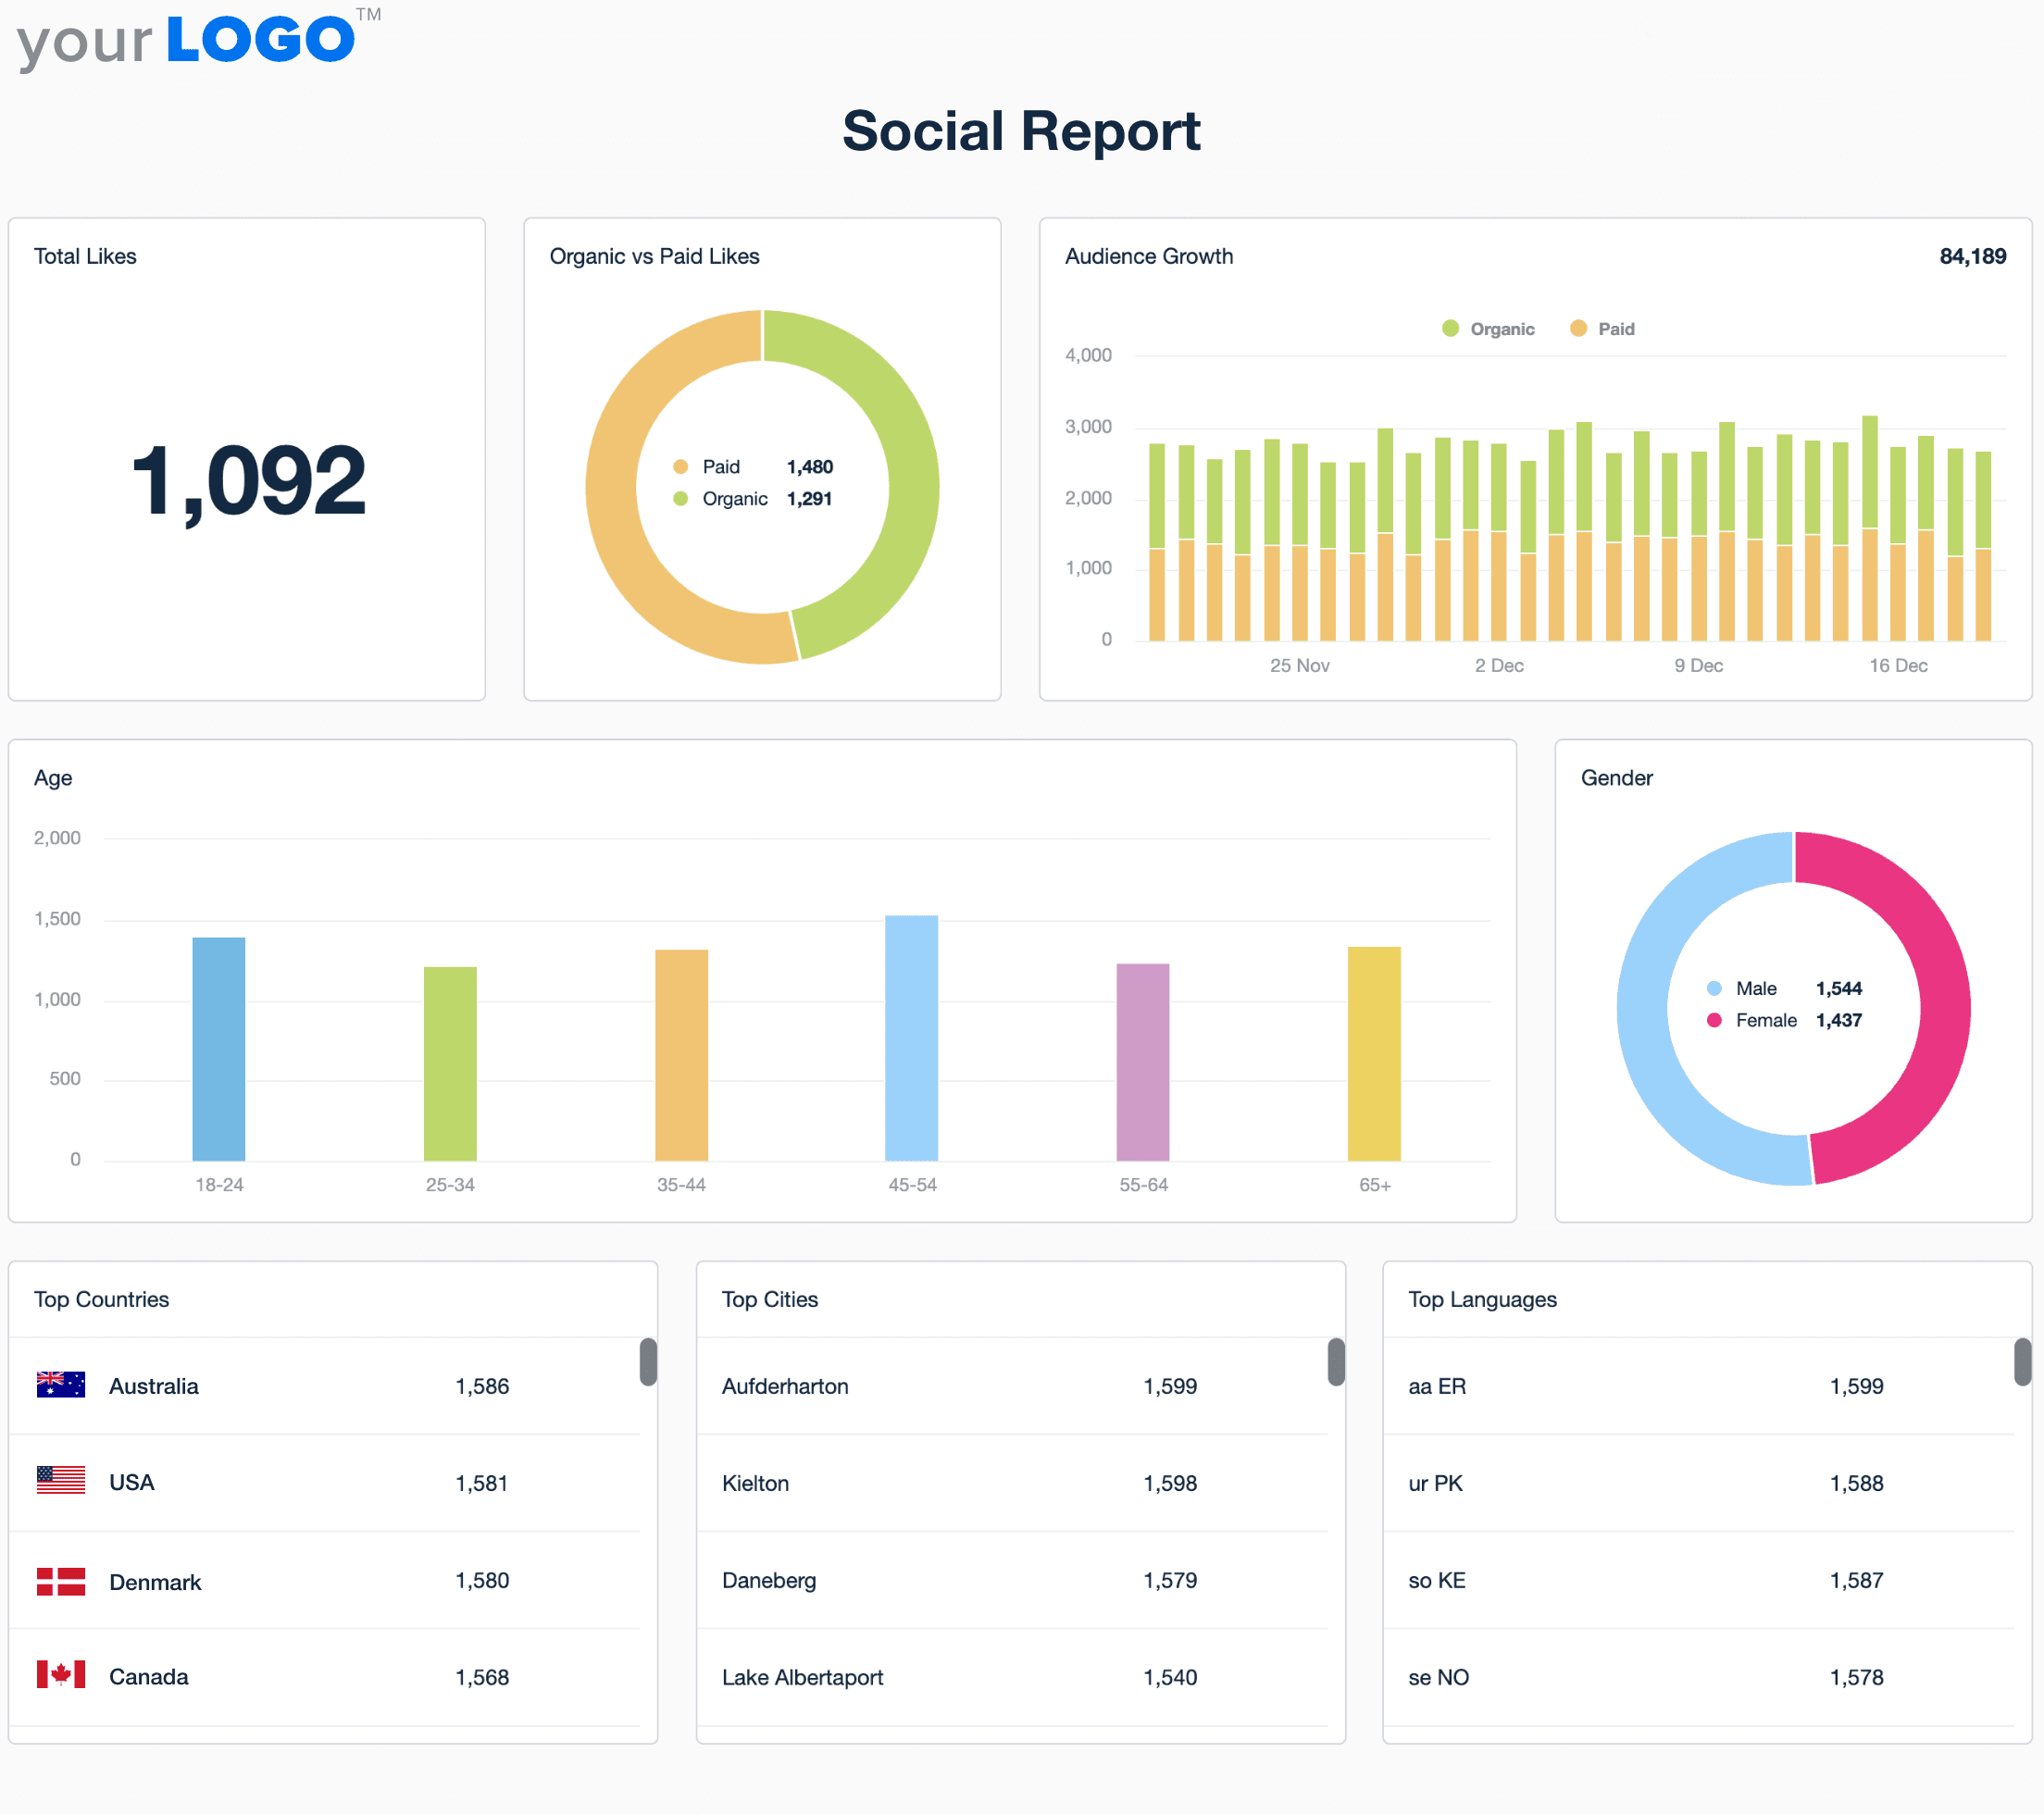
Purpose: Measure engagement, reach, and platform ROI and identify content opportunities.
What To Include:
Follower growth by platform
Top-performing posts
Referral traffic to the website
Paid vs. organic performance
Insights To Call Out:
Which types of content drive the most engagement?
Is one platform outperforming the others?
What’s converting more, brand awareness or traffic?
3. Digital Marketing Analysis Report Example
A digital marketing data analysis report pulls together insights from across channels like email, social, PPC, and more to give clients a unified view of marketing performance. It helps them make informed decisions at every funnel stage and aligns your reporting with tangible business outcomes.
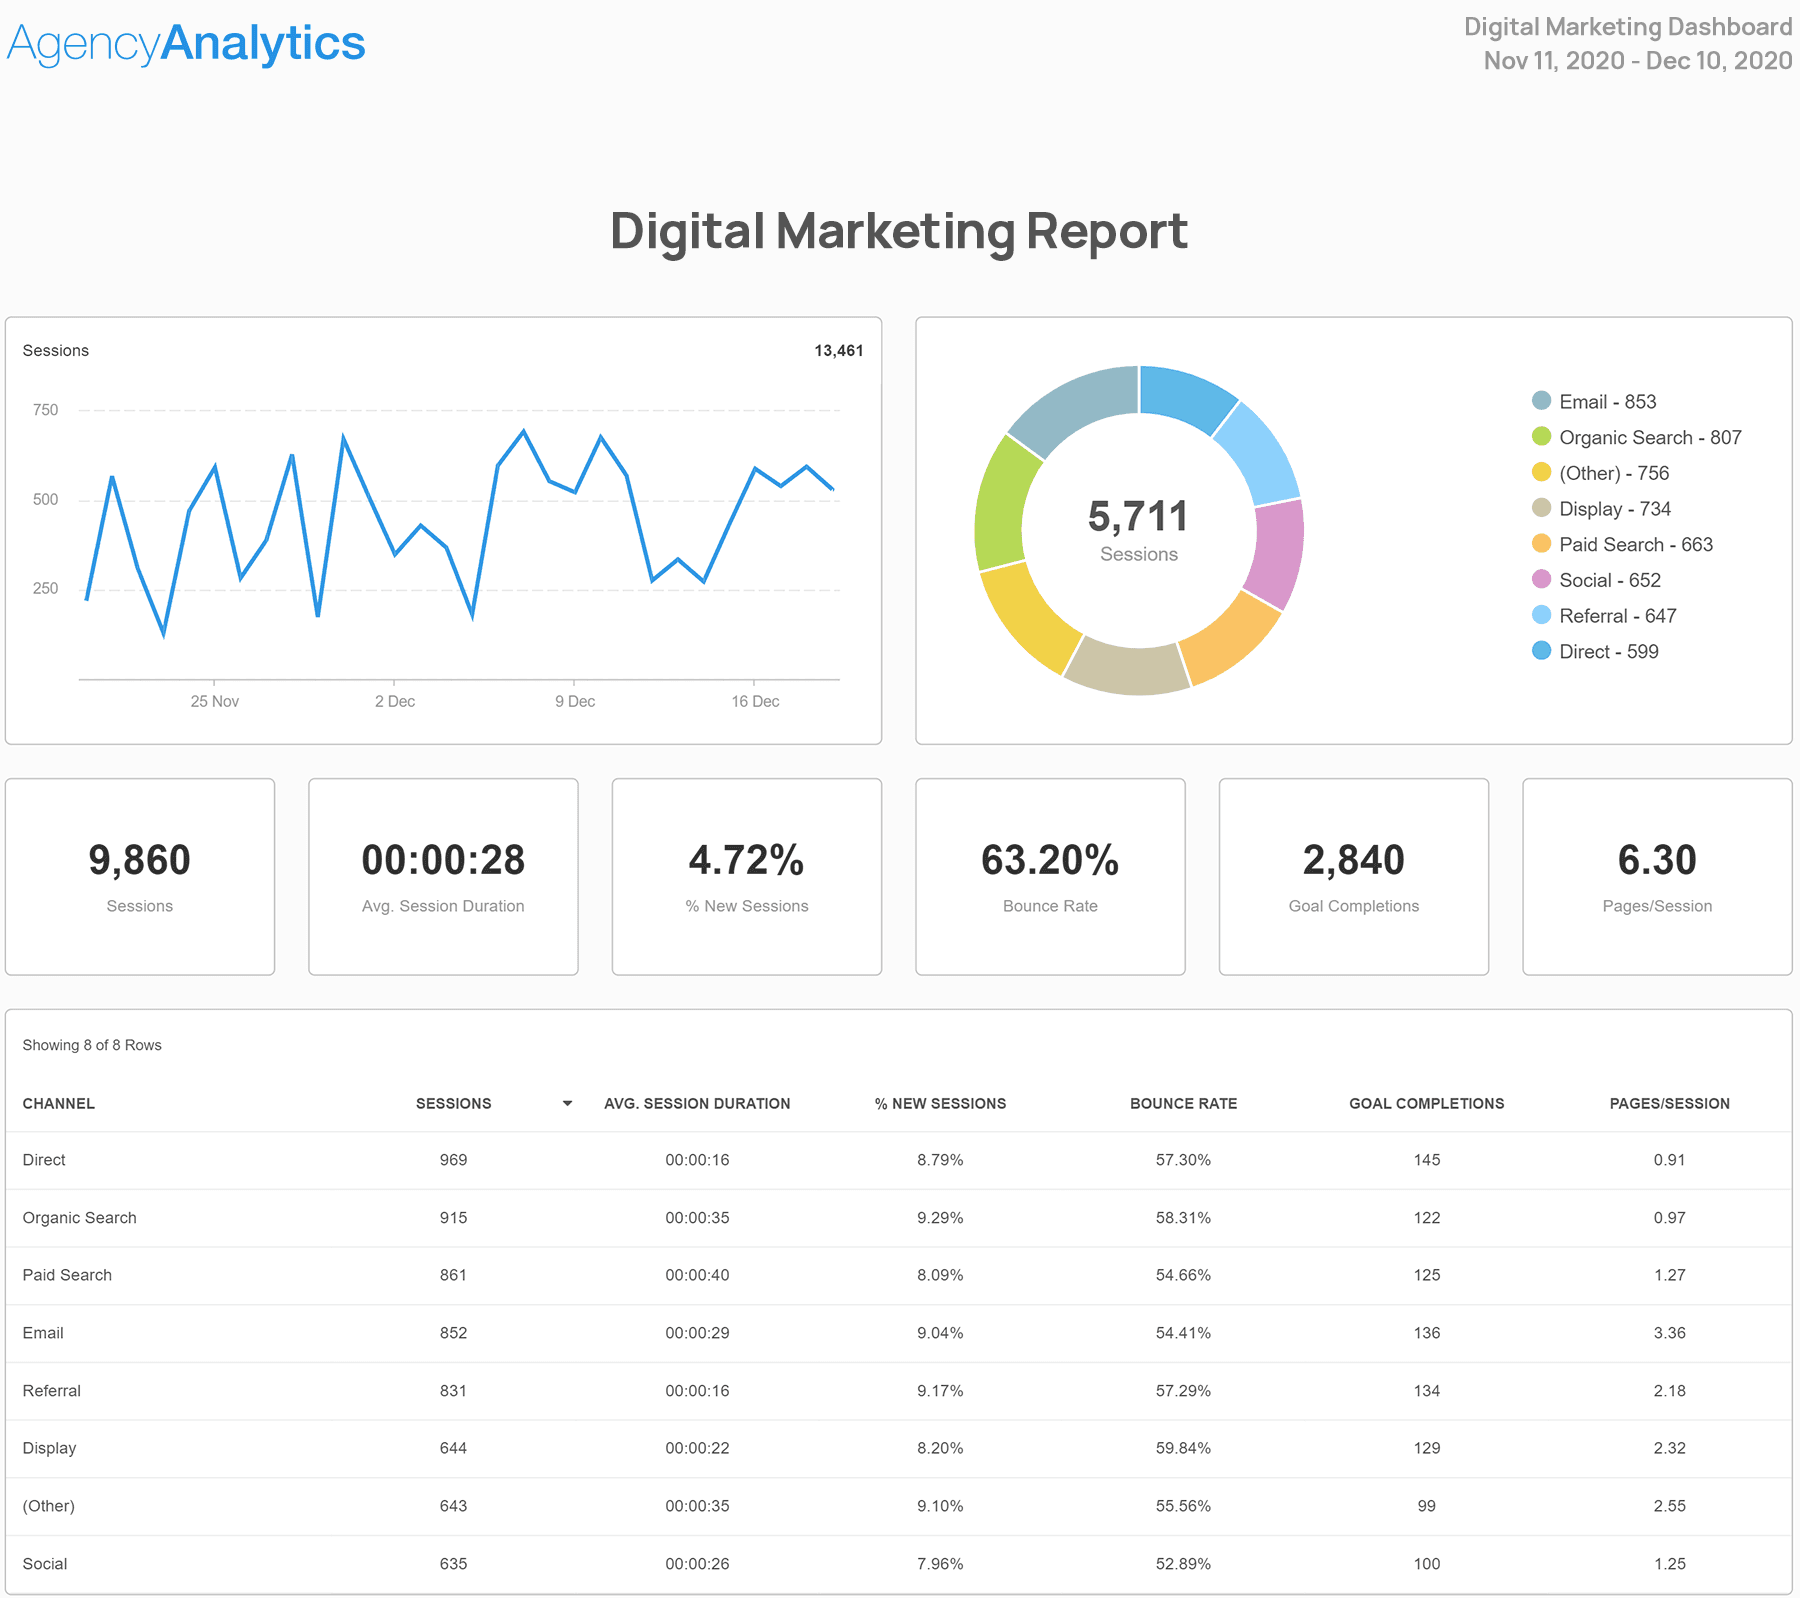
Purpose: Provide a full 360° view of multi-channel marketing efforts and performance.
What To Include:
Channel-by-channel breakdown (email, social, search, PPC)
Lead generation volume and quality
Funnel progression and conversion metrics
Attribution data
Insights To Call Out:
Which channel is delivering the highest ROI?
Are there any noticeable drop-offs in the funnel?
What can be optimized in the conversion path?
Deliver Meaningful Overviews, Without the Clutter
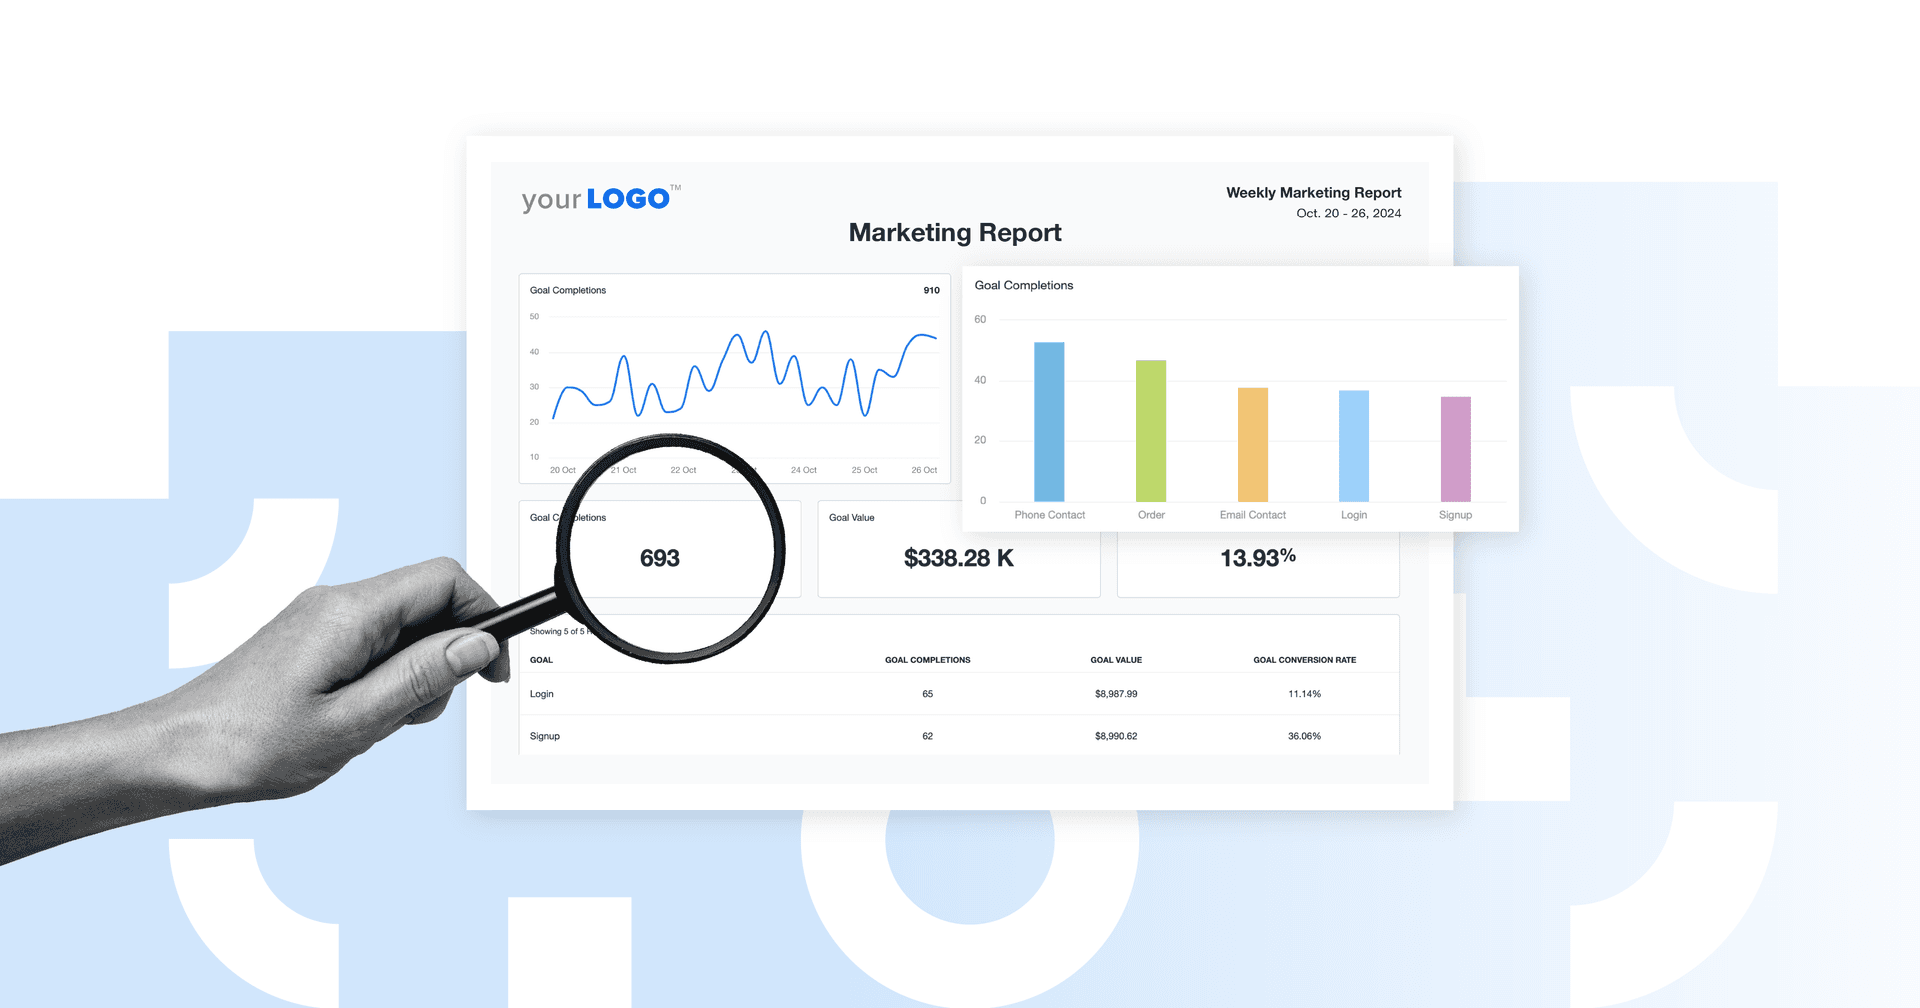
See Our Report Template in Action
4. Web Analytics Data Analysis Report Example
A web analytics data analysis report tells the story of how users interact with a site, from customer behavior patterns to high-exit pages and conversion rate blockers. It helps uncover valuable insights that improve website performance and drive smarter optimizations.
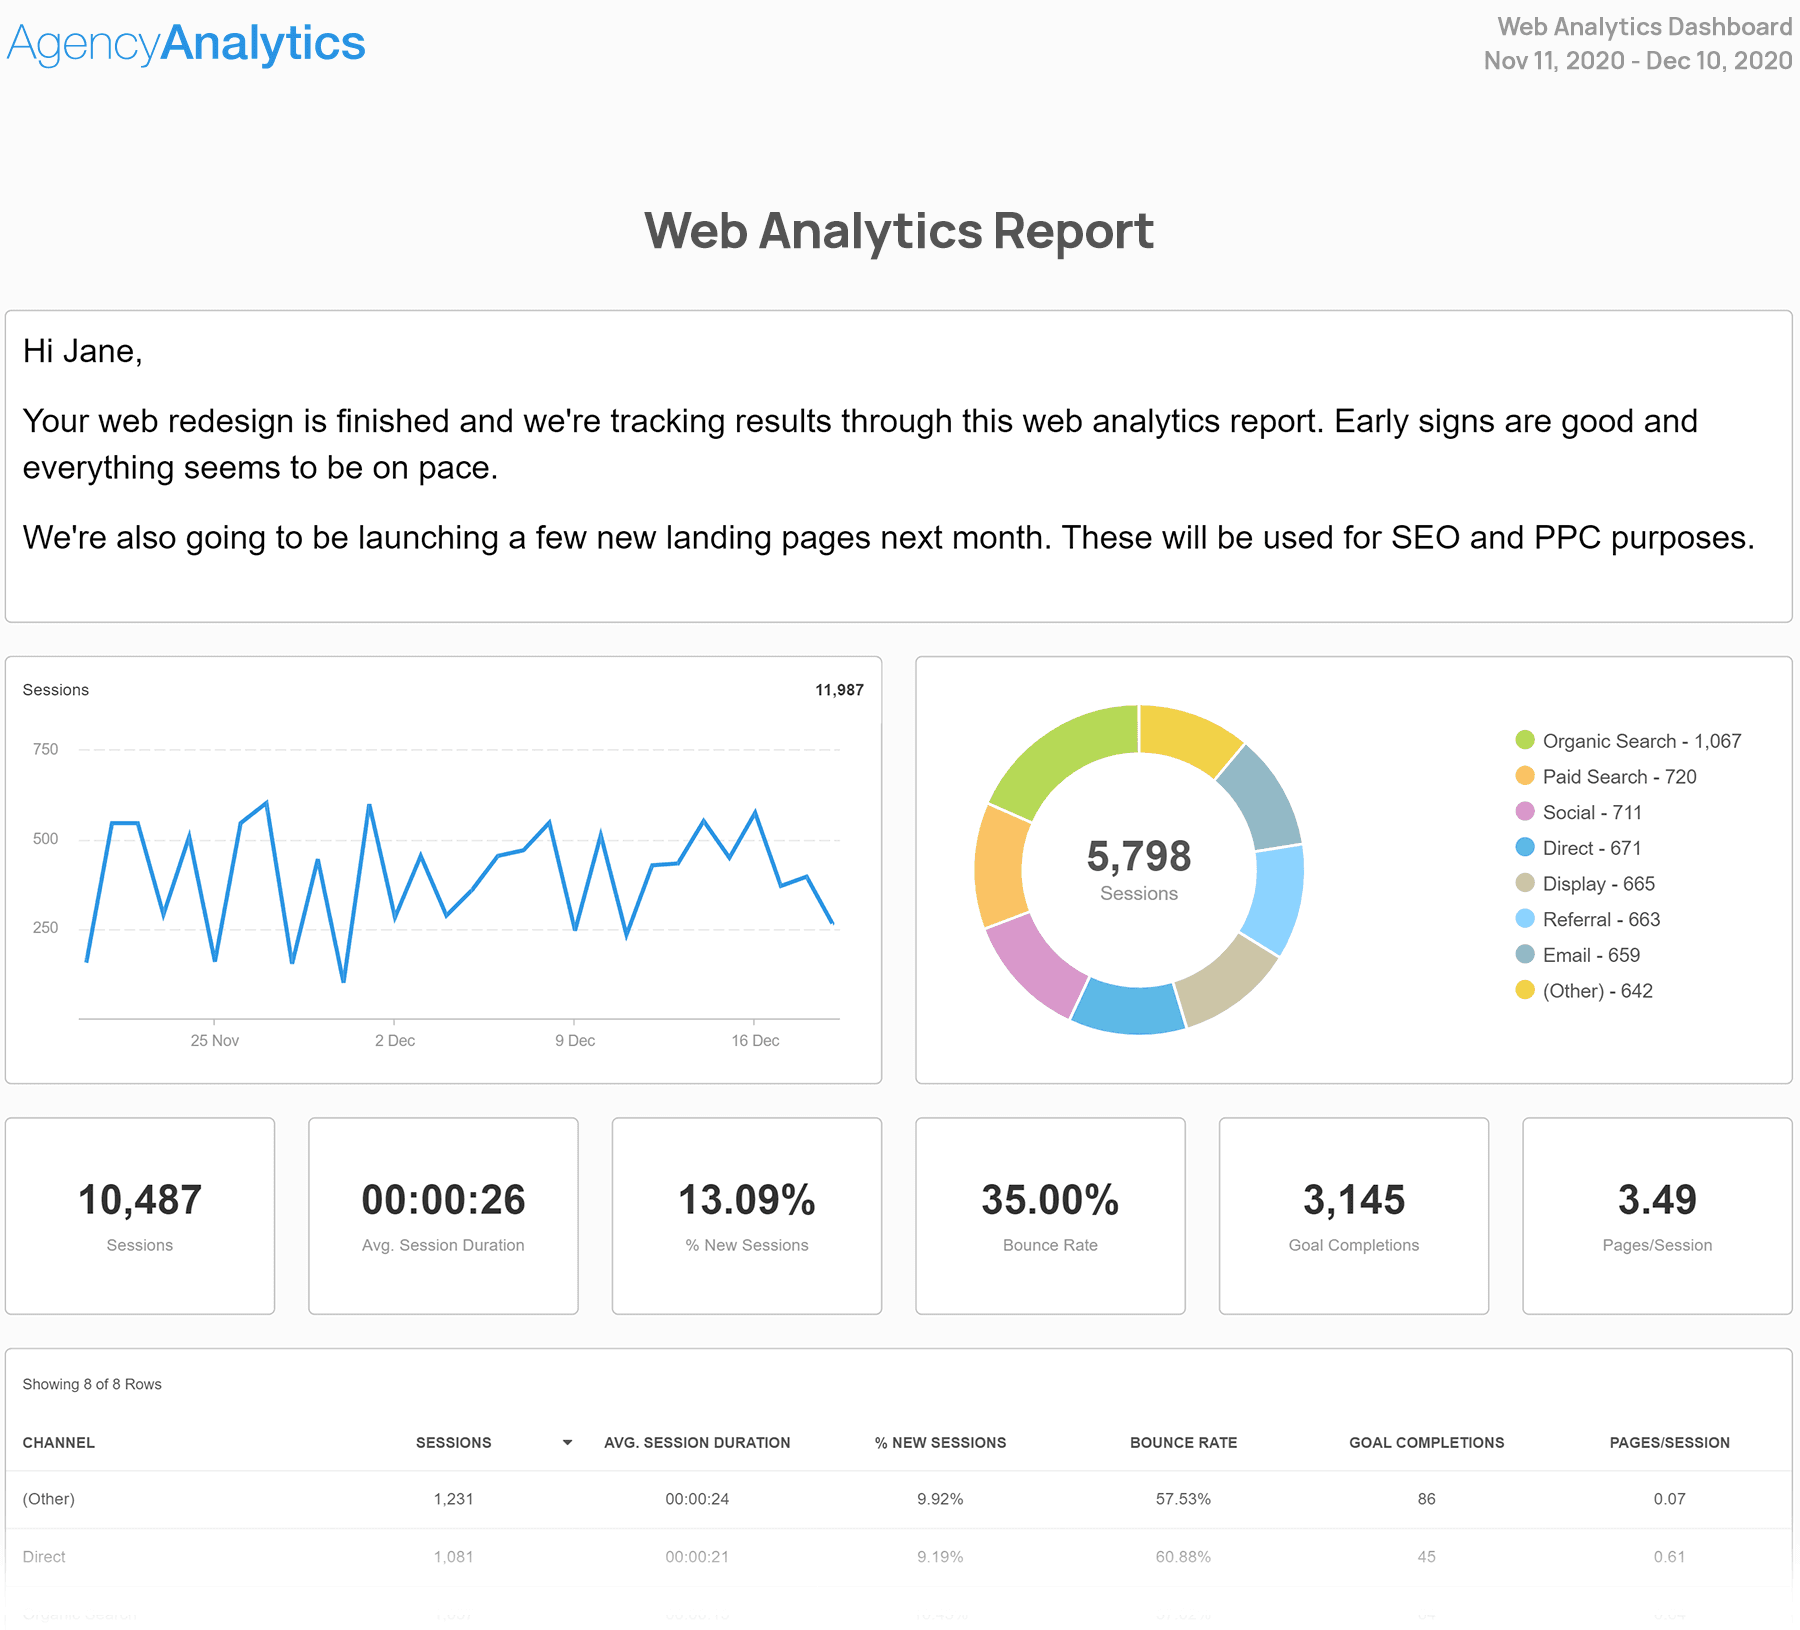
Purpose: To present how users interact with a website.
What To include:
Time on site, pages per session
Traffic sources
Top entry/exit pages
Conversion funnels
Insights To Call Out:
Where are users dropping off?
Are CTAs and landing pages working as expected?
Is the site attracting the right traffic?
5. PPC Data Analysis Report Example
A focused PPC data analysis report evaluates what’s working and what’s wasting ad budget. It breaks down essential metrics like CPC, CPA, and keyword performance to help your team adjust targeting, creative, and bidding strategy for maximum return.
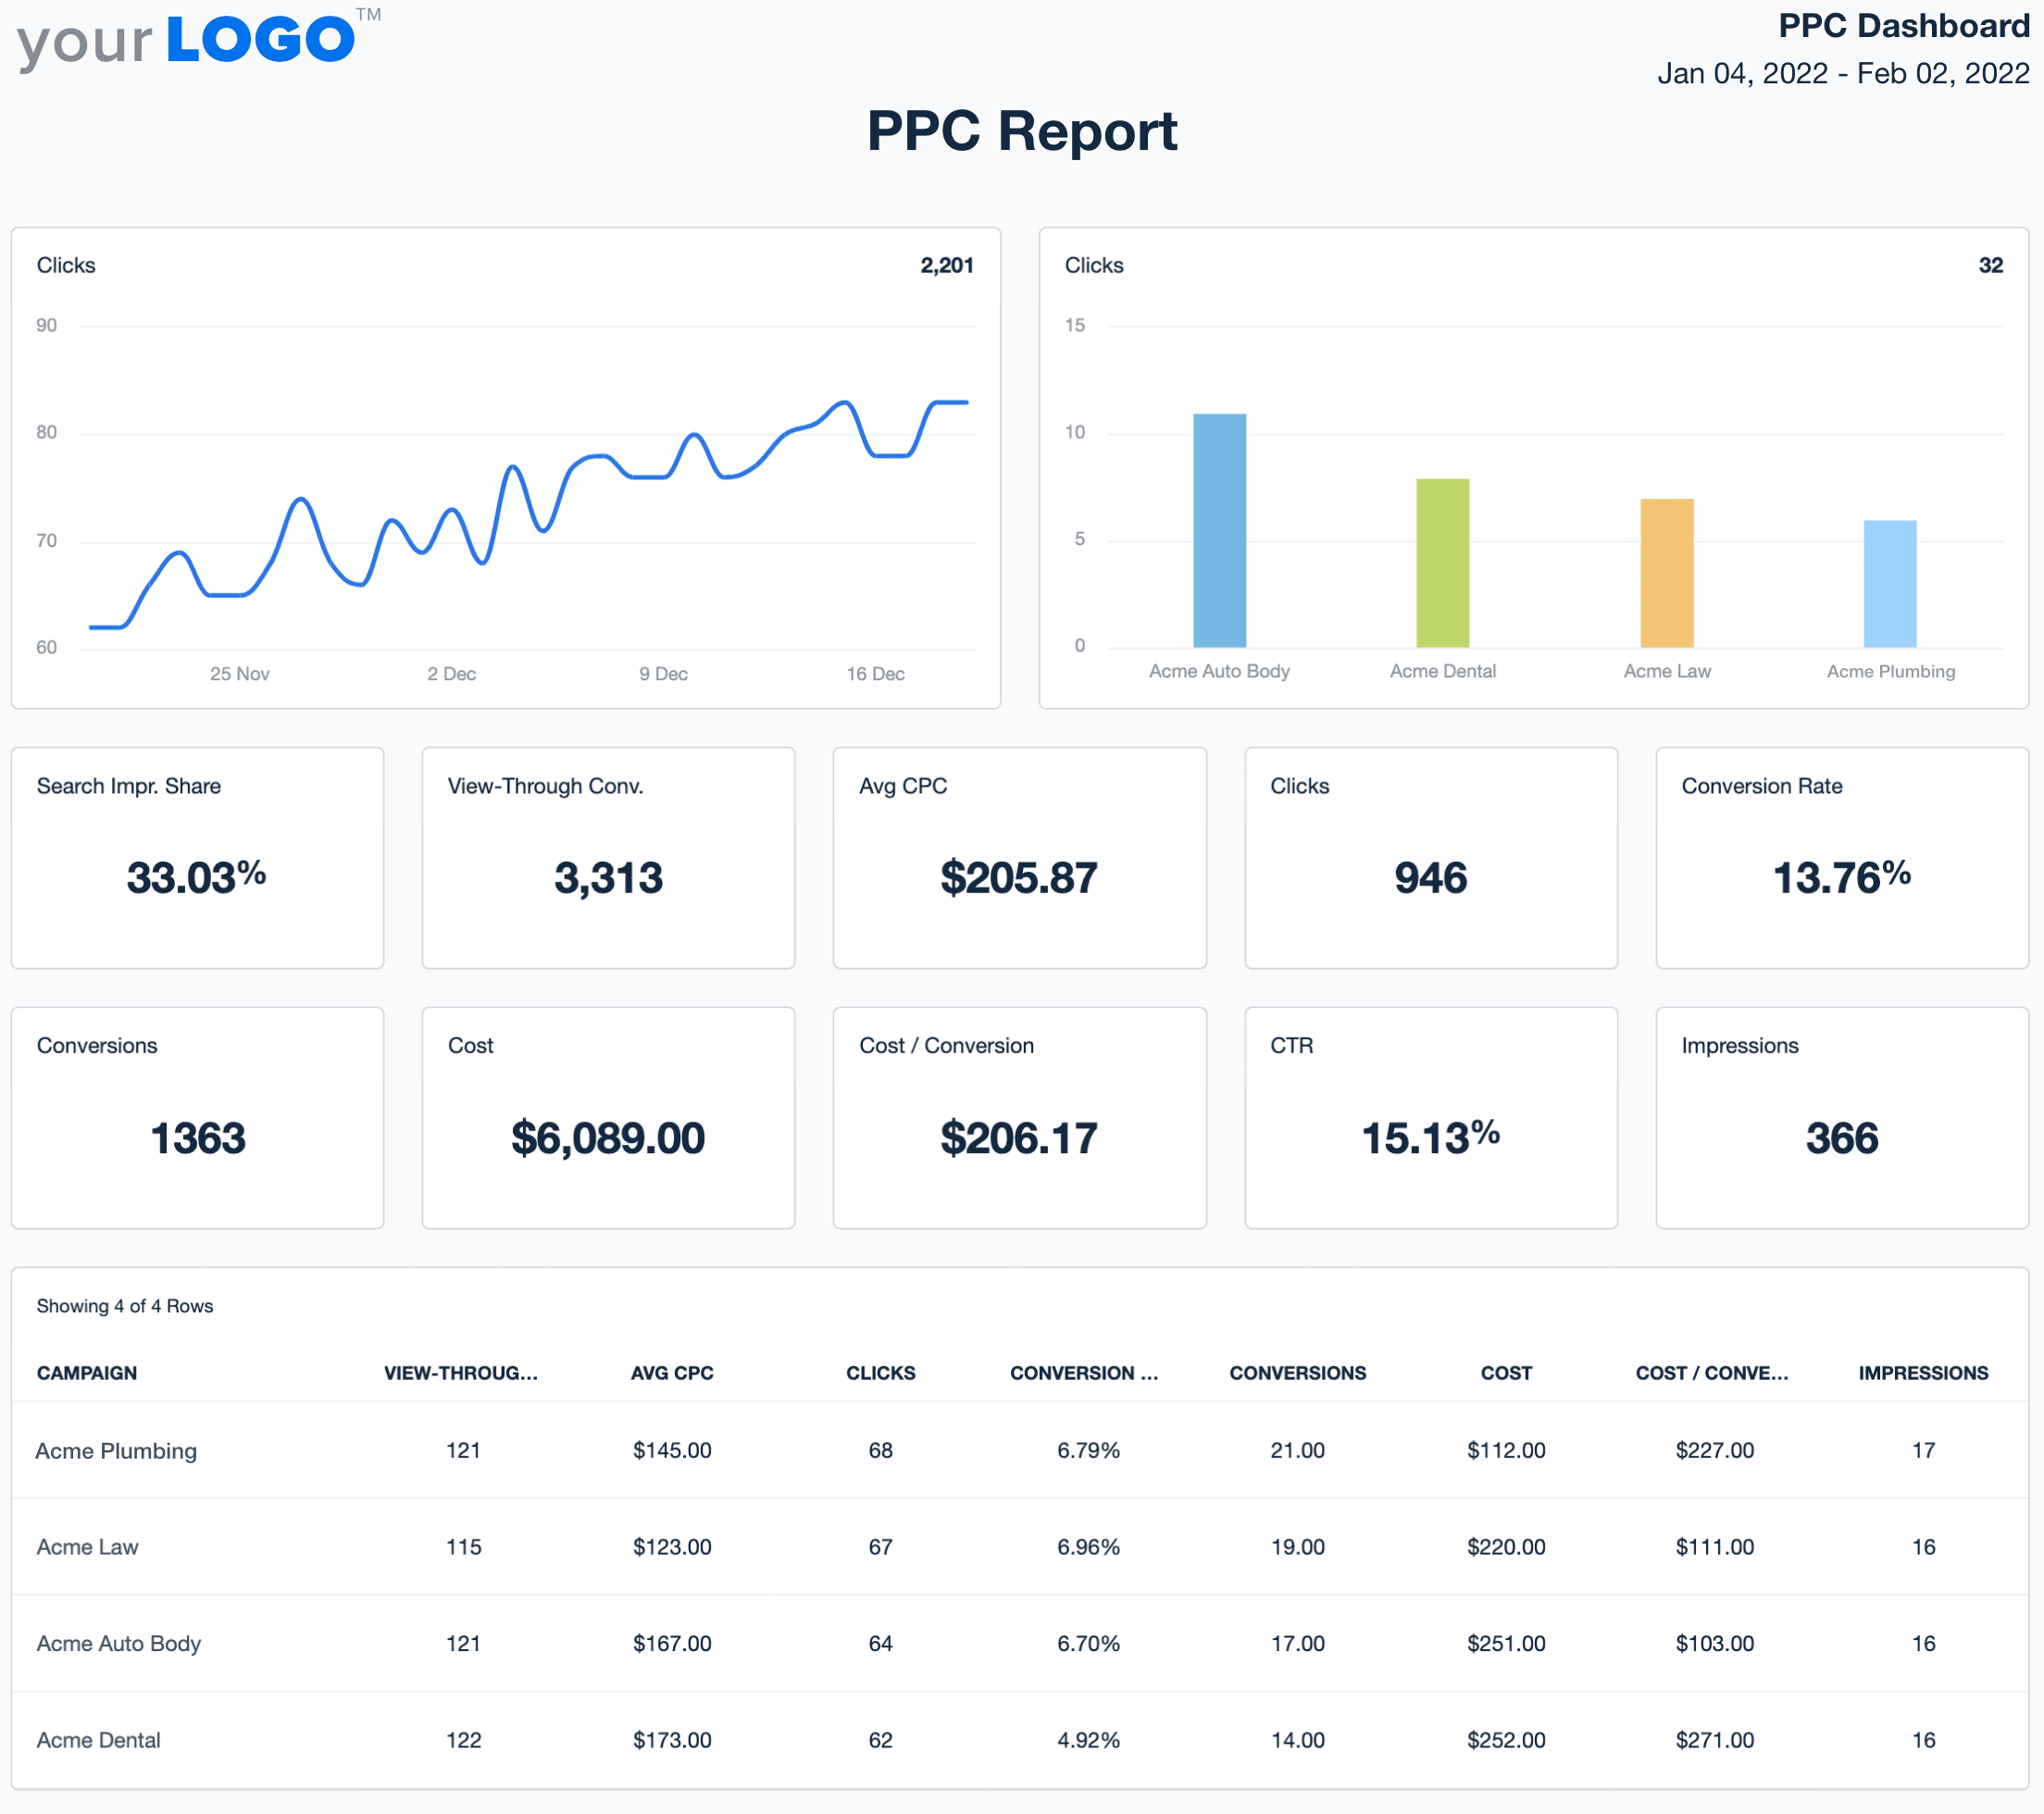
Purpose: Evaluate paid campaign effectiveness.
What To Include:
Impressions, clicks, CPC, CTR
Conversion volume and CPA
Keyword performance
Ad group performance
Insights To Call Out:
Are we hitting CPA targets?
Which campaigns are wasting budget?
What copy or creative changes are working?
How To Write a Data Analysis Report Step-by-Step
Looking at analytical report examples is a great starting point. But if you want to deliver reports that impress clients consistently, you need a repeatable process.
Here’s how to create a data analysis report from start to finish, without wasting time or missing key insights.
Step 1: Start With a Report Template
Building reports from scratch wastes time and creates inconsistencies. Instead, start with a data analysis report template. Then implement PPC reporting automation so every cycle ships on time. Templates speed up report creation while still giving you the flexibility to customize your reports to each client.
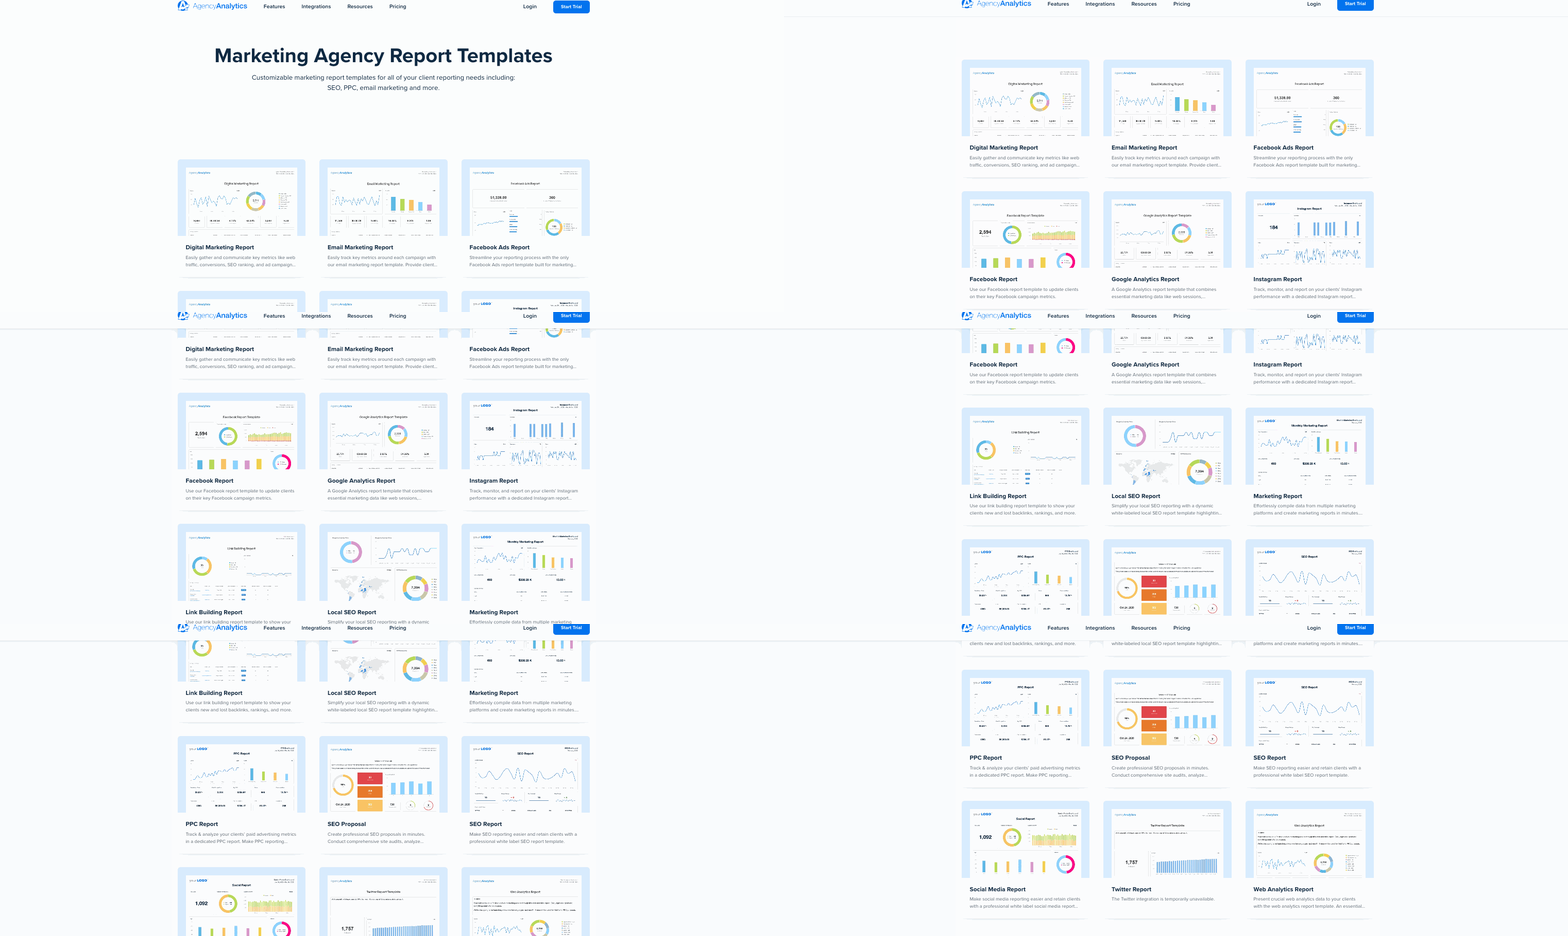
AgencyAnalytics report templates do more than give you a structure.
Here’s what makes them stand out:
Connect to 80+ Integrations: Connect your favorite platforms (like Google Analytics, Facebook Ads, Shopify, and more) to populate each report with up-to-date data, no manual copy-pasting required.
Your Brand, Front and Center: White label every report with your logo, colors, and agency name so you deliver insights that feel custom, not canned.
Visuals That Tell the Right Story: Choose from a range of data visualization options that support your insights.
These templates don’t just save you time—they elevate the entire client experience.
Start from one of AgencyAnalytics’ fantastic report templates and modify based on the KPIs that you or your client cares about. Then, keep asking for feedback. The more you understand what your client cares about and how they're measuring success, the better you're able to present focused and engaging data.
Paul Echols, Creative Director & Agency Owner, Square 205
Agency Tip: Bookmark our library of customizable marketing agency report templates for SEO, PPC, social, email, web analytics, and more to start getting your reports done in minutes.
Step 2: Define A Clear Objective
Your report should never feel like a data dump. It should have a defined purpose that guides what you include, how you interpret it, and what recommendations you make.
Before you gather a single data point, get crystal clear on what the report needs to communicate and why.
Ask yourself:
Are you showing progress against KPIs?
Highlighting missed targets and why?
Justifying a new strategy or pivot?
Supporting a pitch for more budget or a campaign shift?
Every data analysis report should answer a specific set of client questions. Without that focus, you risk overwhelming them with numbers that lack context or direction.
A clear objective also prevents internal drift. If your team isn’t aligned on the story behind the data, your message won’t land.
Agency Tip: Before kickoff, write a one-line report mission statement. Example: “Show how organic traffic grew 15% this quarter and recommend next steps to scale SEO performance.” Share it with your team so every section of the report stays sharp, relevant, and aligned with what your client cares about most.
Step 3: Pull the Right Data
Once you’ve locked in the objective, the next step is choosing the right data to support it.
Too often, agencies overload reports with every available metric. But more data doesn’t equal more clarity. Relevance wins every time.
Start by identifying the five to seven essential metrics that directly support the story you’re telling. These should align with the report’s goal, whether that’s proving ROI, tracking conversion rate changes, or validating a new strategy.
Context is everything. Even the right metrics lose meaning without benchmarks or trends. Layer in:
Historical data to show movement over time.
Competitor benchmarks to highlight where the client stands.
Industry averages to frame performance realistically.
The goal is to help your client not just see what happened, but understand why it matters.
Focus on the "So what?" factor. Make every data point meaningful by explaining its impact on the client's goals. Clients don't just want numbers; they want to know how those numbers affect their success. Show them the value, and your reports will be both powerful and engaging!
Michelle van Blerck, Communications Manager, Digital Freak
Agency Tip: Use AgencyAnalytics’ Insights feature to surface quick-hit competitive comparisons. Show how your client stacks up in their niche—and where the biggest opportunities lie.
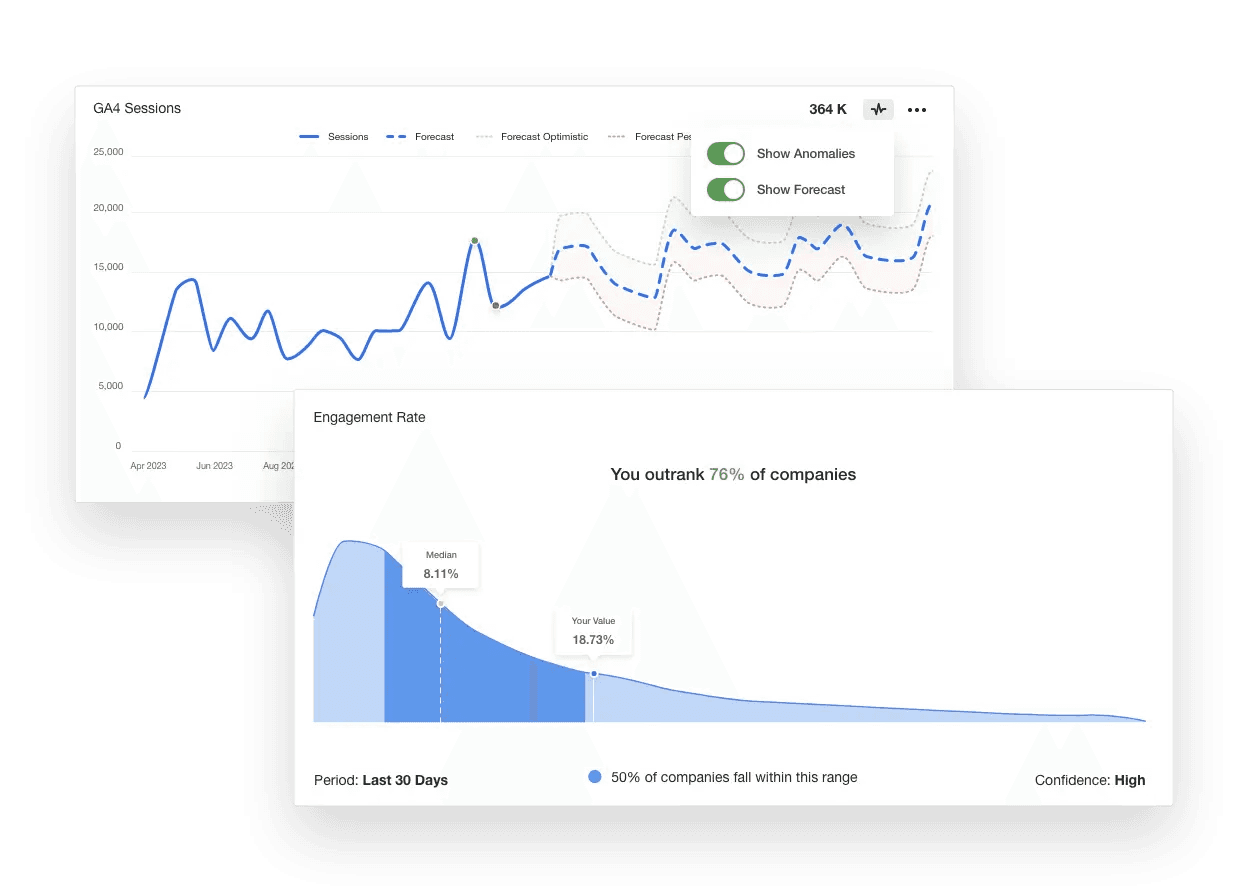
Benchmark client performance against 150,000+ campaigns. Spot opportunities, set smarter goals, and show clients the impact. Try AgencyAnalytics free for 14 days.
Step 4: Analyze and Interpret
Today’s agencies are more than creative partners. They’re expected to act like data scientists, uncovering patterns, diagnosing problems, and guiding clients with data-driven recommendations.
There is a big difference between providing an observation and an actionable insight. Observations tell the client what we found, while actionable insights tell them a story about what we found and what we should do about it. Our clients don't pay us to make observations. They pay us to create change in their organization. We make change through actionable insights.
Kerrie Luginbill , Chief Strategy Officer/ Partner, OTM
Compelling data analysis starts by looking at your metrics through multiple lenses:
Understand What Happened: Review key insights across campaigns, SEO, paid ads, or web analytics to establish a clear performance baseline.
Pinpoint Why It Happened: Dig into the underlying causes, whether it’s a spike in organic traffic after an SEO push, or a dip in conversion rate after a landing page redesign.
Forecast What Might Happen: Use historical data and trend analysis to anticipate opportunities or risks, helping clients stay one step ahead.
Recommend What to Do Next: Turn insights into specific, tactical next moves that are aligned with the client’s goals and supported by relevant data.
Agency Tip: Include one quick win and one strategic insight in every report. Show short-term impact and recommend a next move tied to long-term growth.
Better yet, explore AI tools for data analysis to accelerate this step and surface deeper insights faster. AgencyAnalytics recently rolled out Ask AI and AI Summary, two AI-powered tools that analyze large volumes of client data quickly, share historical trends, and even identify growth opportunities in a fraction of the time.
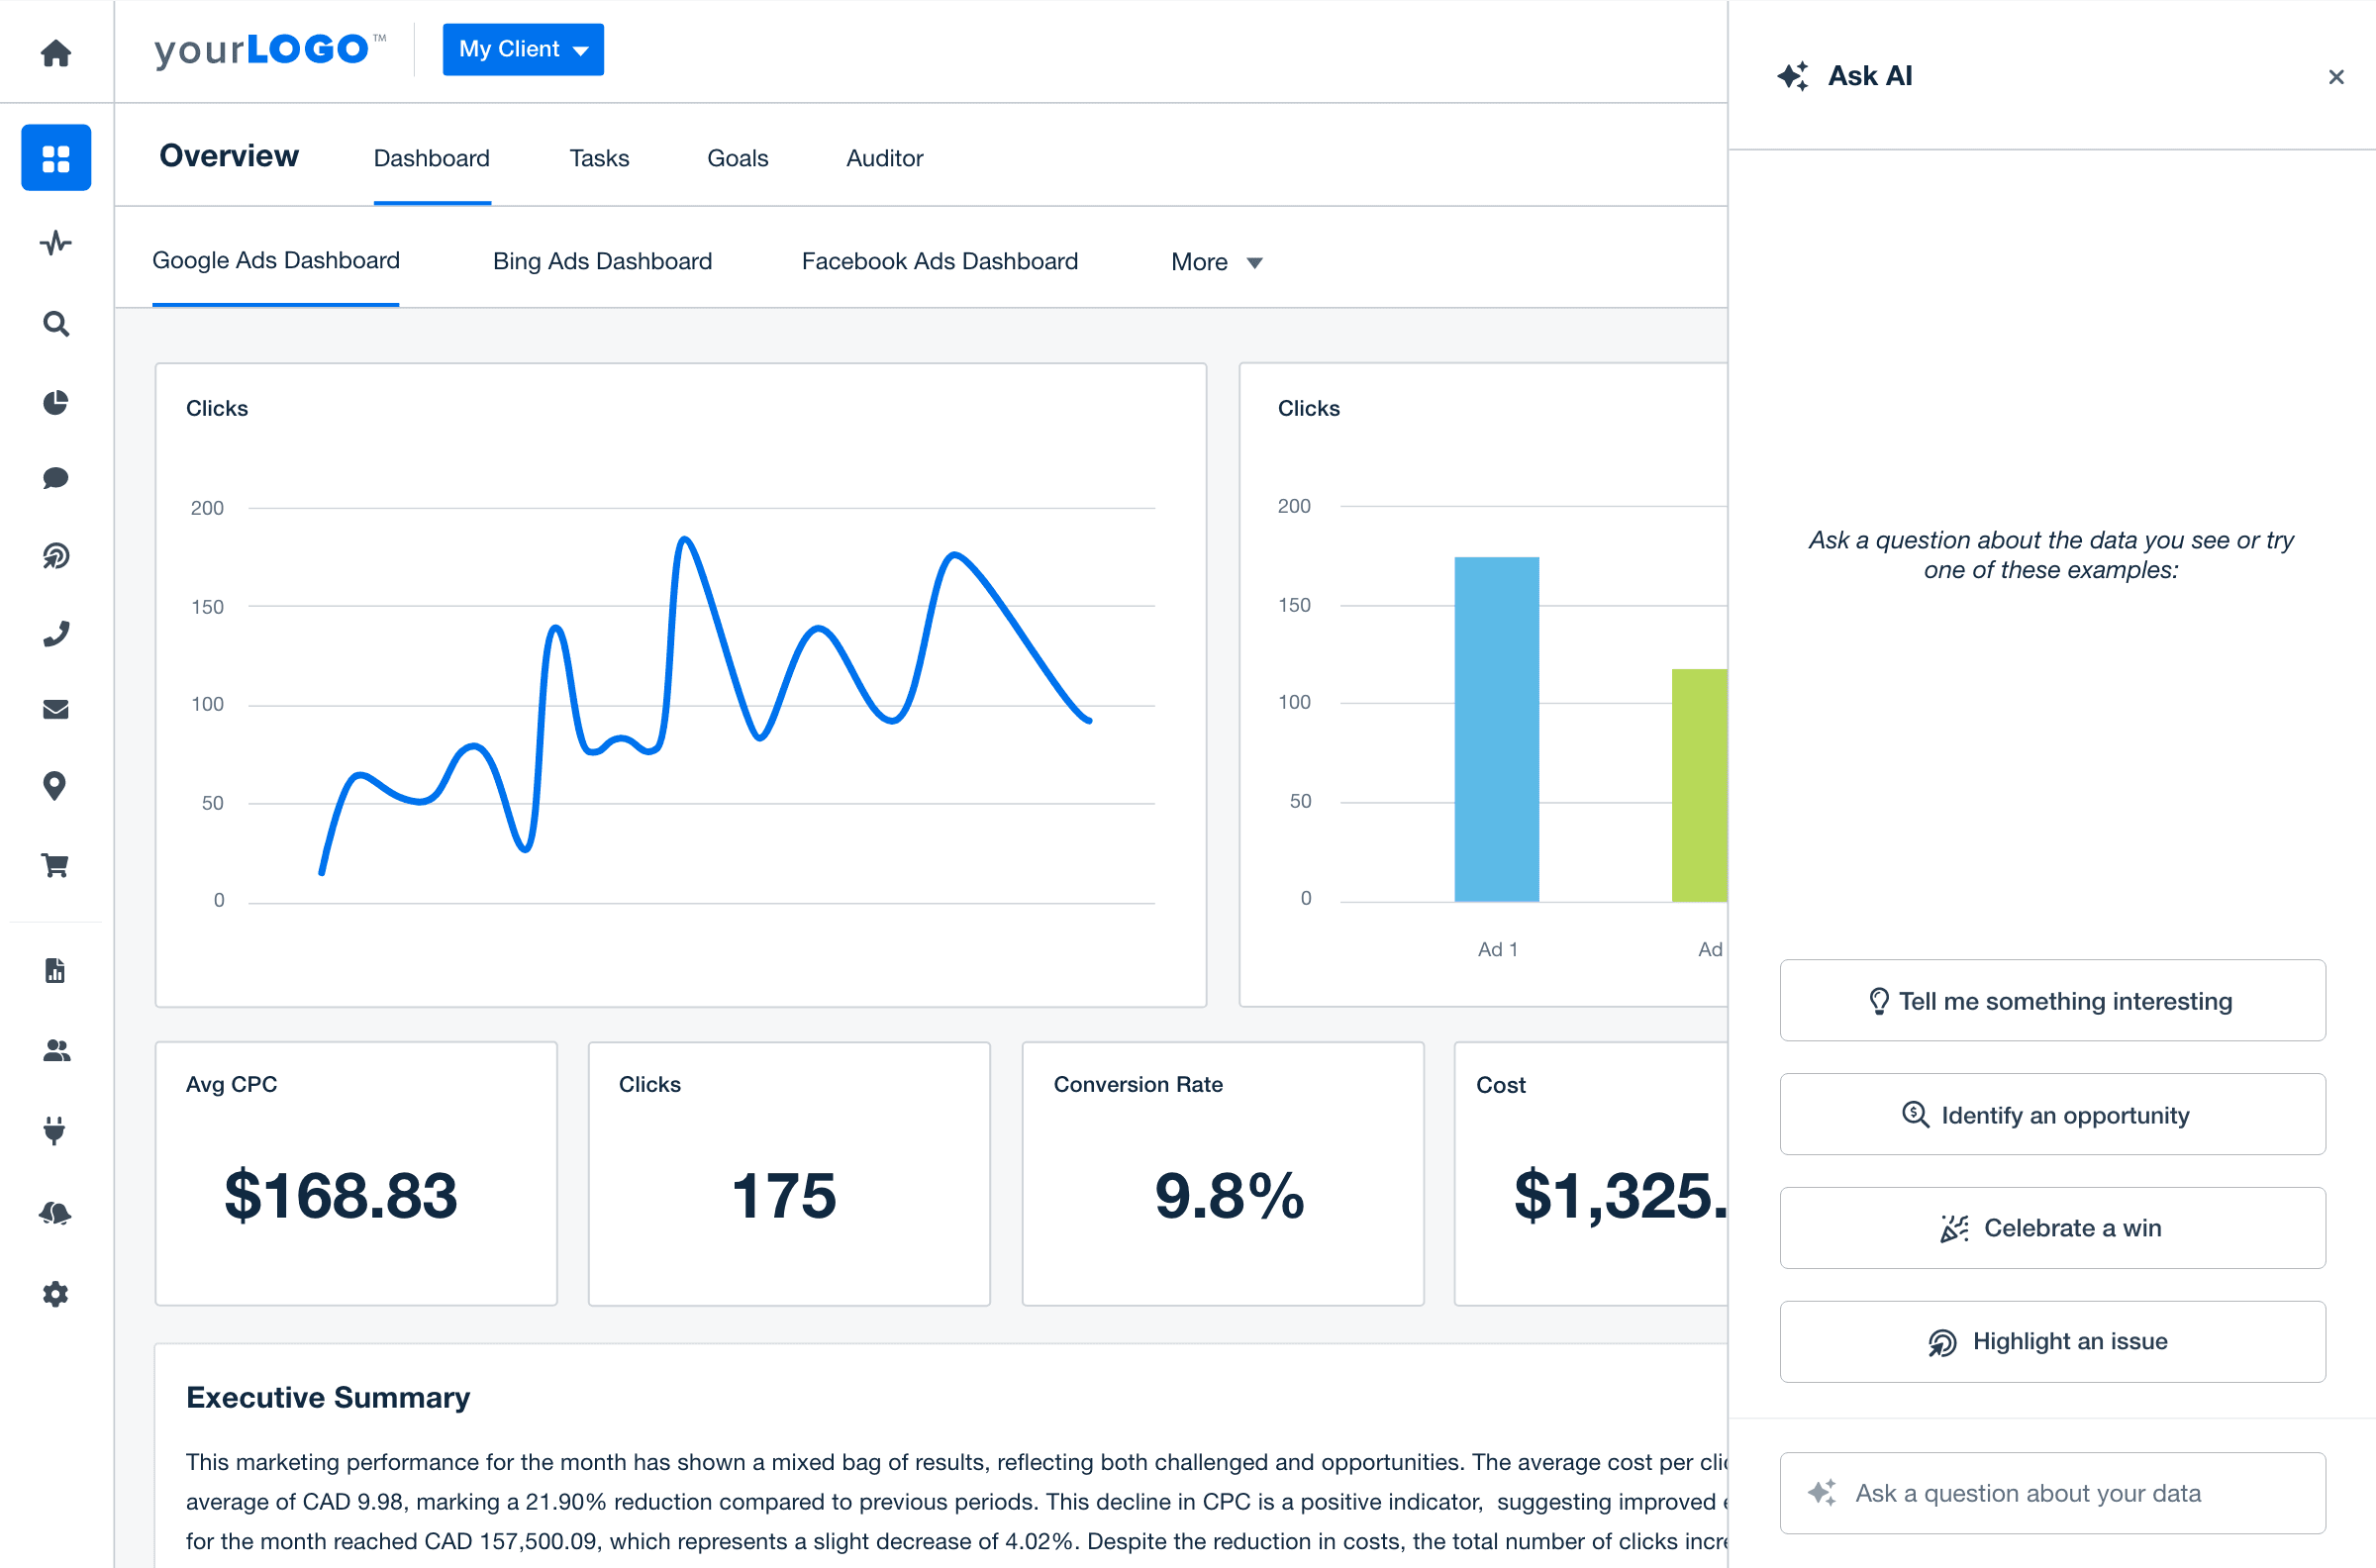
Automate analysis, uncover hidden insights, and craft compelling narratives with AgencyAnalytics’ AI tools. Try it free for 14 days.
Step 5: Organize Into a Clear Structure
Excellent marketing analysis means nothing if it’s buried in a messy report.
Your structure is what makes the story land. It helps your clients move from big-picture performance to clear next steps without digging for answers.
Use a format that guides your clients from big picture to specific action, for example:
Executive Summary: High-level wins, losses, and key insights.
Objectives & KPIs: What you aimed to achieve.
Data Findings: The numbers, trends, and performance breakdowns.
Analysis & Insights: What those numbers actually mean.
Recommendations: What to do next to improve overall business performance.
Appendix (optional): Charts, raw data, or methodology notes.
Avoid fluff. Every section should add value—or it doesn’t belong.
Agency Tip: Use consistent section headers every month to familiarize clients with the flow.
Step 6: Add Visuals and Highlights
Great data falls flat without great visuals.
Strong marketing data visualization techniques, such as charts, graphs, and callouts, help clients identify trends, spot risks, and take action quickly.

The goal: clarity, not complexity. Your visuals should do three things:
Highlight wins and opportunities.
Make patterns impossible to miss.
Answer “so what?” at a glance.
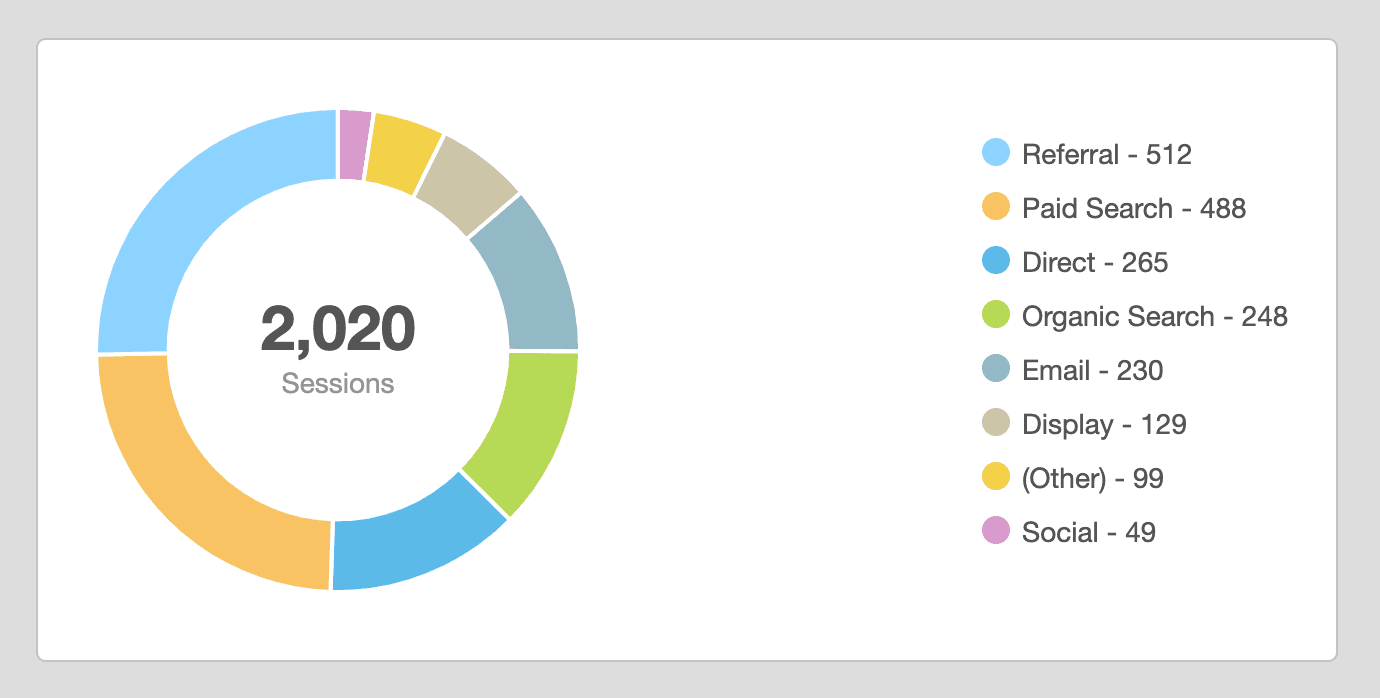
Thanks to data visualization tools like AgencyAnalytics, you don’t need your designers to create these. With AgencyAnalytics, choose the data visualization style that best supports your narrative and use annotations to add context directly to your charts.
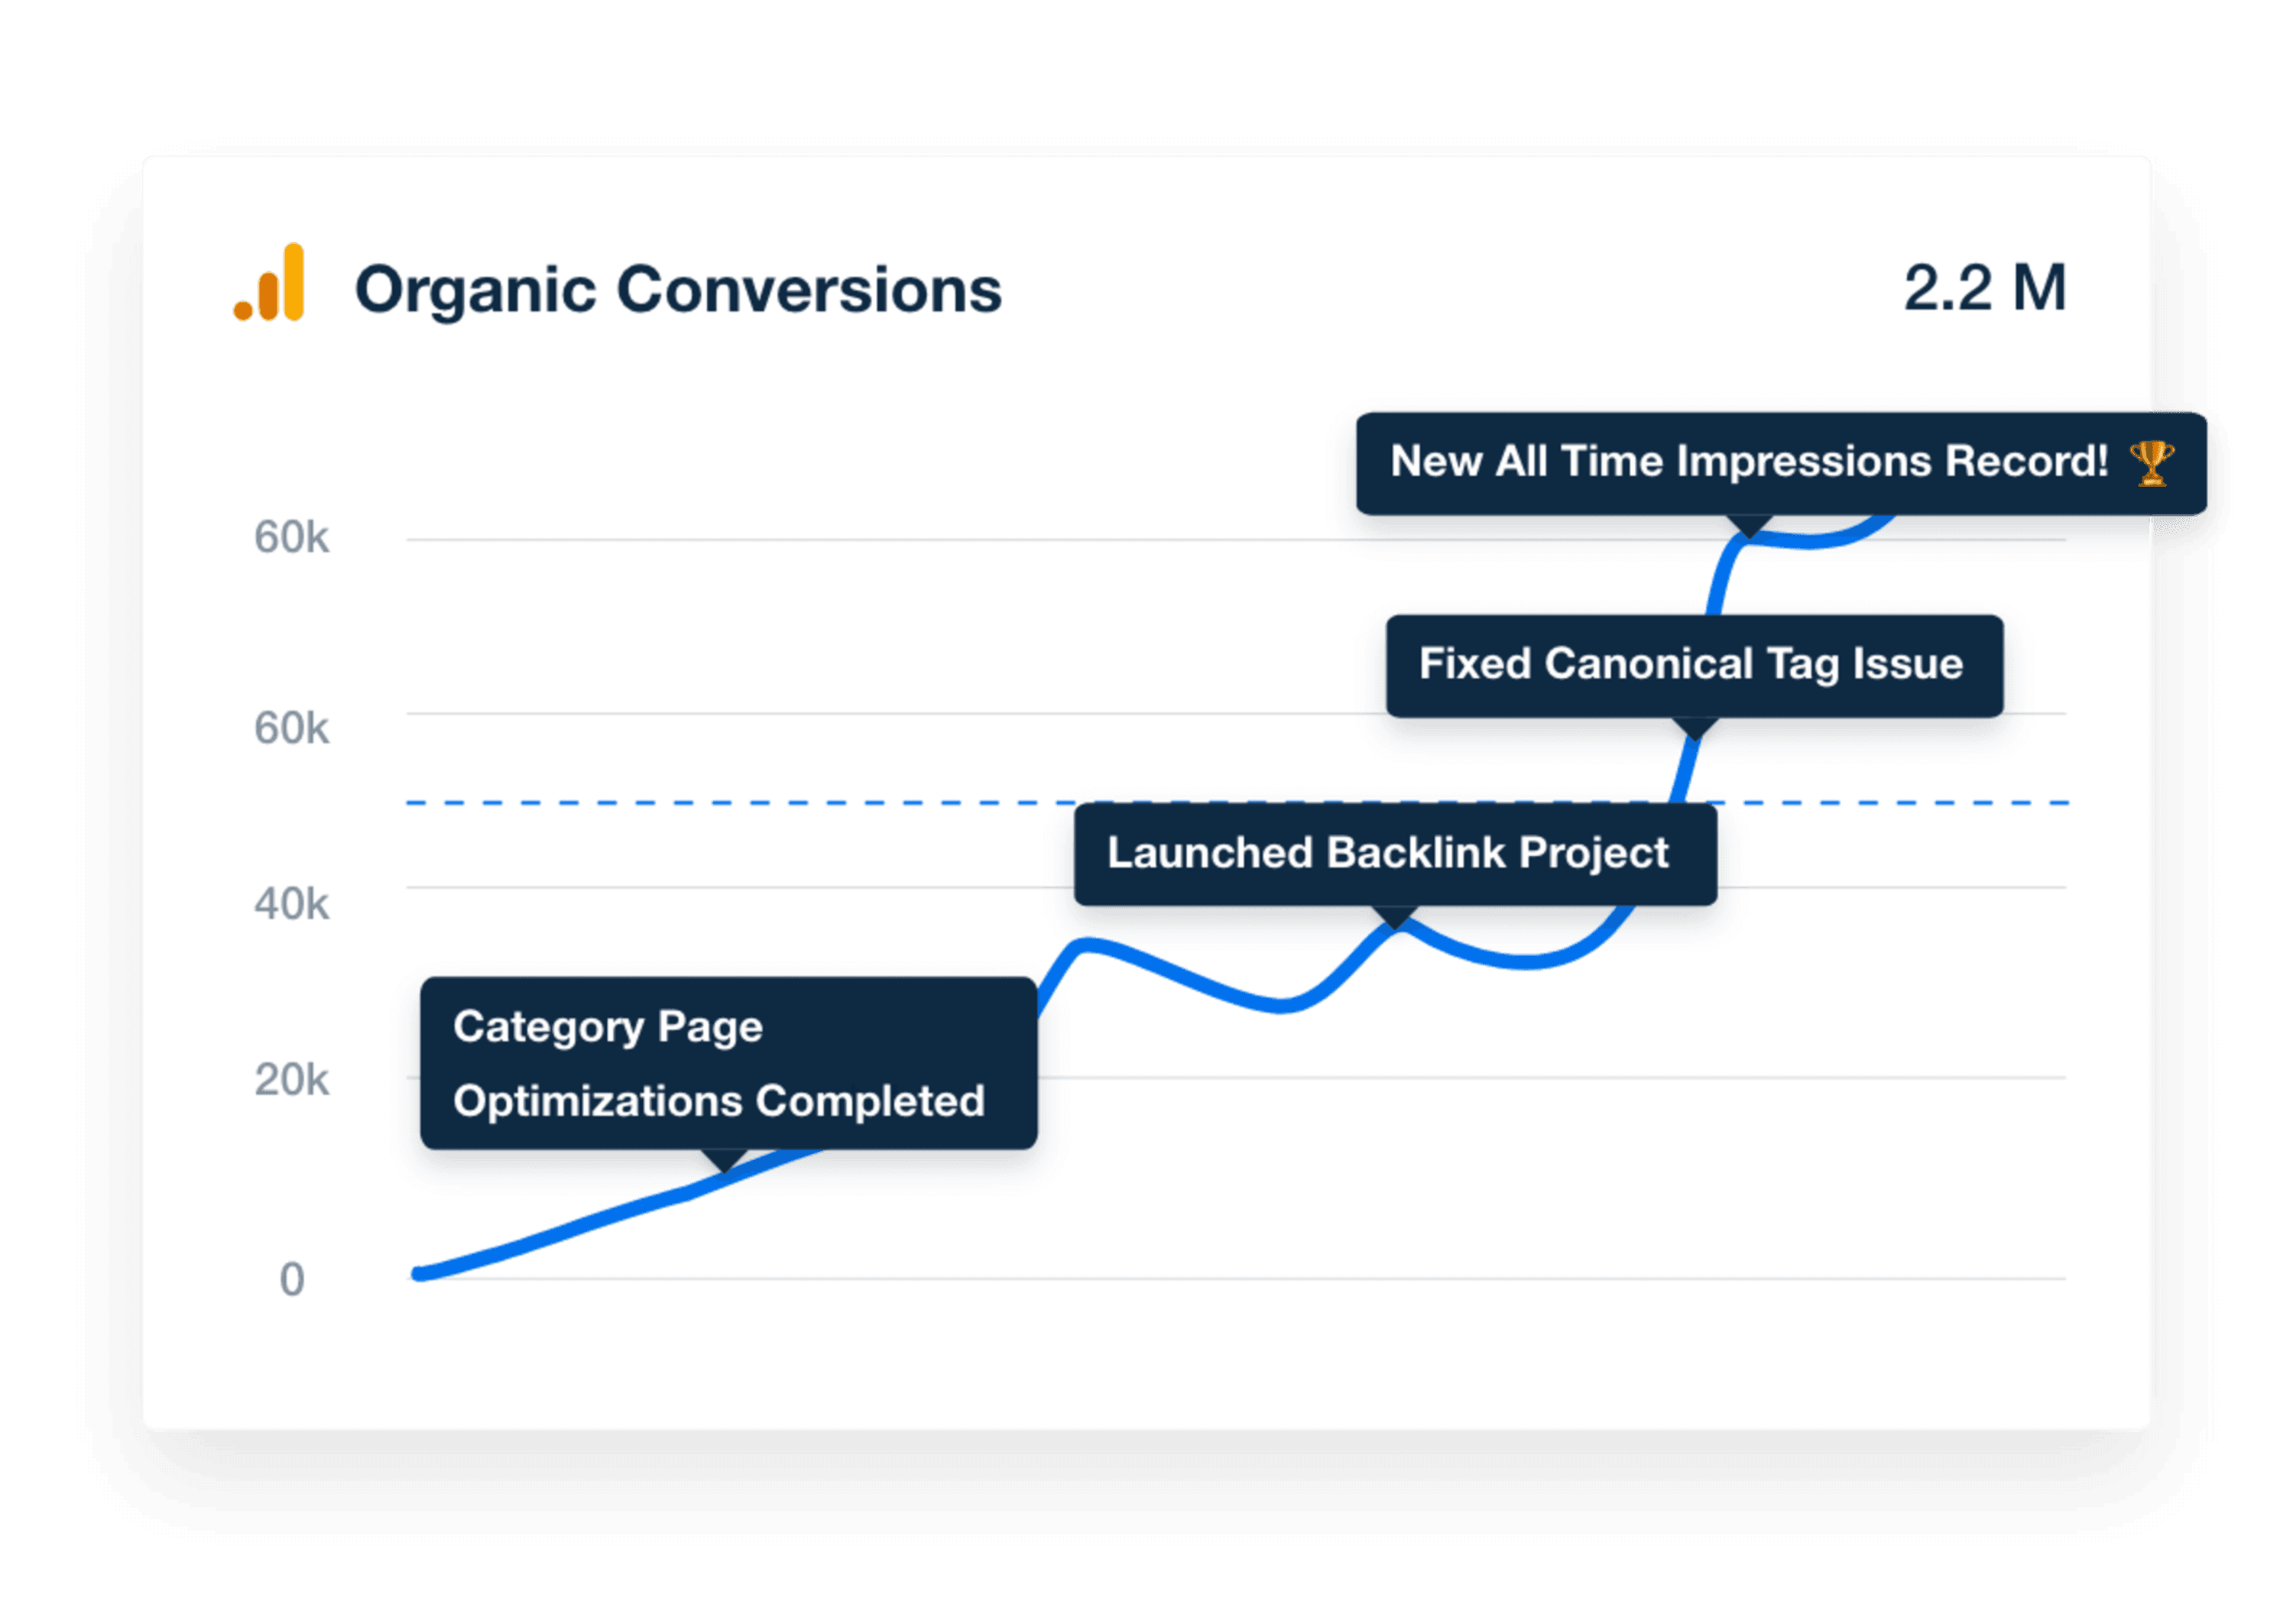
Use AgencyAnalytics Annotations to call out wins, shifts, or milestones right where the data lives, without adding clutter. Try it free for 14 days.
Agency Tip: Don’t just show the spike, explain the story. Annotations help you connect the dots for the client and reinforce your value in every chart.
Step 7: Review and Personalize
The difference between a decent report and a memorable one? Personalization!
An effective data analysis report shows that you understand your client’s business, priorities, and long-term goals. That’s what builds trust and keeps relationships sticky.
Always tailor your insights to reflect each client’s specific marketing objectives, from customer behavior trends to channel-specific tactics. Don’t just show the data, make it matter in their world.
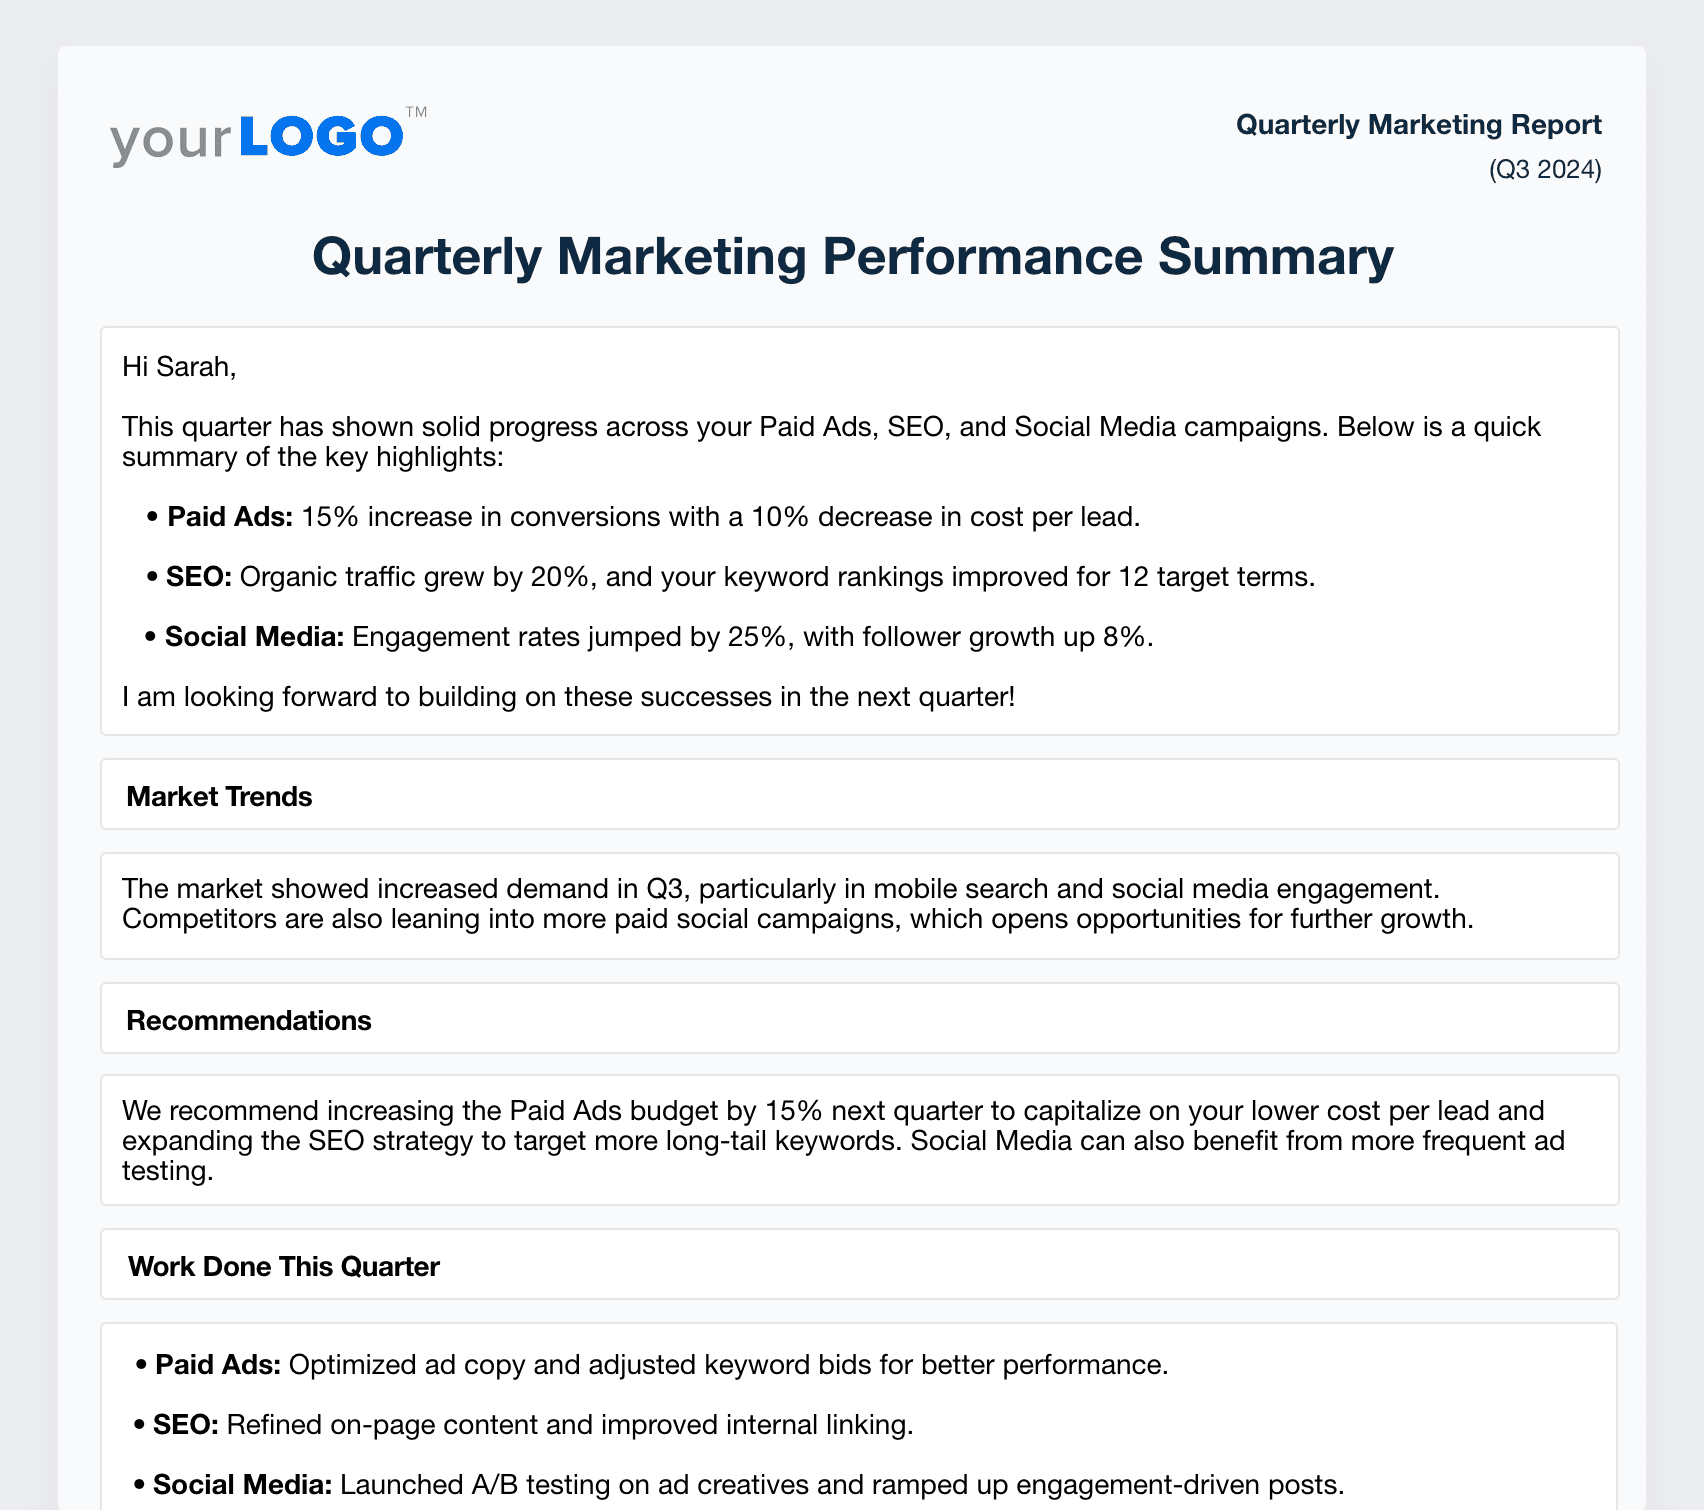
Agency Tip: Use the report summary section to speak directly to the client. Address them by name, recap their biggest wins, and clearly outline the next steps. This simple, personal touch turns a standard report into a strategic conversation—and shows your agency is genuinely invested in their success.
Impress clients and save hours with custom, automated reporting.
Join 7,000+ agencies that create reports in under 30 minutes per client using AgencyAnalytics. Get started for free. No credit card required.
Already have an account?
Log inCommon Mistakes To Avoid
Even with a strong process in place, a few common mistakes can weaken your message—or worse, confuse your client. Here’s what to watch out for and how to avoid making these mistakes.
1. Dumping Data Without Insight
If you’re presenting pages of quantitative and qualitative data with no interpretation or context, the client is left to connect the dots–and most won’t. To avoid making this mistake, add commentary explaining what the numbers mean and what action to follow. Every data analysis report should surface actionable insights, not just raw data.
2. Ignoring the Client’s Business Goals
A common mistake agencies make is reporting on activity, not impact. When this happens, the data doesn’t map to what the client cares about, like leads, conversions, revenue, or retention. To avoid this, tie every insight and recommendation back to a business decision or client priority. If it’s not helping them grow, cut it.
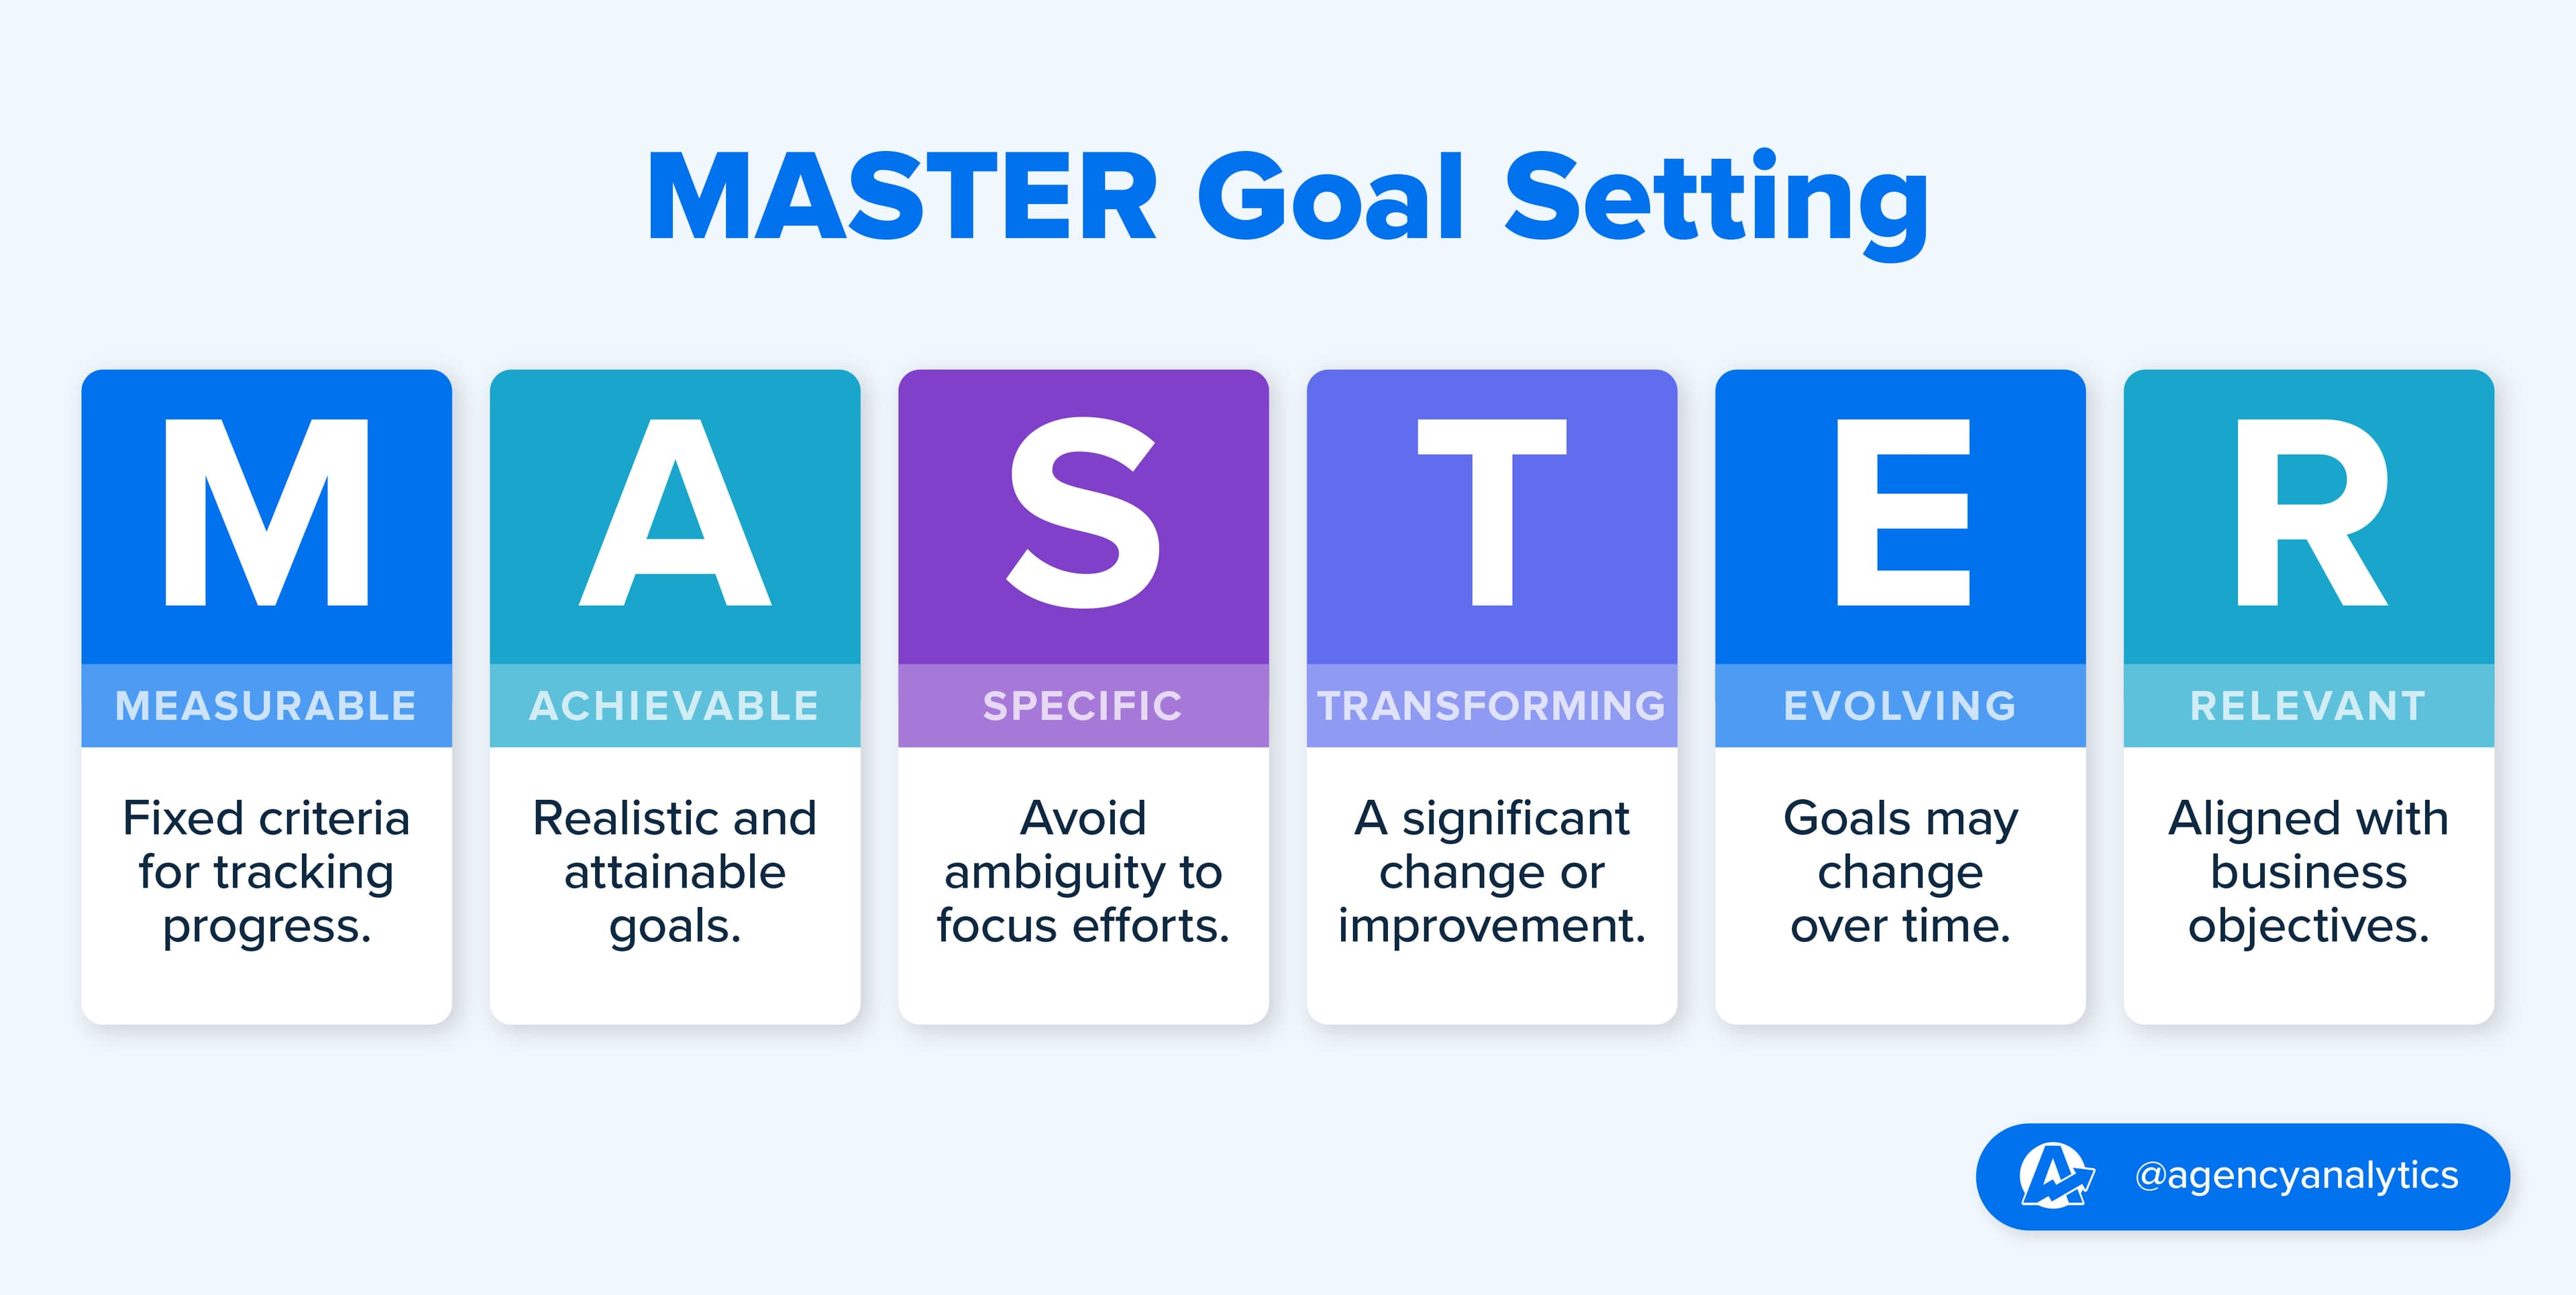
Use goal-setting frameworks like MASTER or SMART to align your reporting with what truly matters. When your reports support client goals directly, they become indispensable.
Our process always begins with a comprehensive client consultation to thoroughly understand their business objectives and priorities. We immerse ourselves in their vision and challenges. The goal is to help our clients choose KPIs that are relevant and meaningful.
Ruben Roel, President, Investigator Marketing
3. Inconsistent Format or Structure
If your report structure changes each month, clients have to relearn where to find what, making performance trends harder to follow.
Use a consistent layout that clients get comfortable with. Templates help maintain clarity and save time while still allowing flexibility.
4. Overloading With Jargon or Technical Speak
If your reports read like they were written for Google’s algorithm, not your client's, you’ll lose their attention.
Keep it human. Use plain language, short sentences, and a conversational tone. The goal is clarity, not complexity!
5. Burying the Lead
If your most important insight is buried on page six, after five pages of background noise, you’re wasting everyone’s time!
Start with the big takeaways. Lead with what happened, why it matters, and what comes next. Data analysis reporting should never feel like a scavenger hunt.
Final Thoughts
Data analysis reports are more than a reporting task; they’re your agency’s proof of performance, your trust-builder, and one of your strongest tools for retention and growth.
When done right, reports don’t just show results. They build relationships. They reinforce your expertise, support better strategic planning, and help clients feel confident in your direction.
But consistency is key.
Clients need to know that every report will be clear, actionable, and worth their time.
That’s where structure, automation, and flexibility come in.
AgencyAnalytics makes it easy to scale your reporting process without sacrificing quality. With customizable white label report templates, real-time dashboards, and features like annotations and report approvals, you’re set up to deliver polished, personalized reports in under 30 minutes.
The outcome?
Happier clients
Smarter conversations
More time for the strategic work that drives real business growth.

Written by
Sylva is an expert content writer with over 10 years of experience in tech and SaaS, offering first-hand insight into agency needs from her background in advertising.
Read more posts by Sylva SivzattianSee how 7,000+ marketing agencies help clients win
Free 14-day trial. No credit card required.


