Table of Contents
QUICK SUMMARY:
Learn how to combine analytics, visuals, and context to create data stories that help clients connect the dots between raw numbers and meaningful insights—all while using tools like AgencyAnalytics to simplify the process.
You’re in the middle of a client meeting, presenting a meticulously crafted report. The slides are polished, the data is accurate, and the metrics tell a clear story—at least to you. But as you glance around the room, something feels off. The silence lingers after you finish explaining a key point. The questions that follow confirm your suspicions: they’re not connecting the dots.
How do you bridge the gap between metrics and meaning? This is where data storytelling comes in. Rather than sharing raw metrics, you present a narrative that helps clients see the bigger picture and connect emotionally with the results.
In this article, we’ll explore the benefits of data storytelling for marketing agencies, discuss how to tell a story with data, and show you how to get started to ensure that complex data excites your clients every time.
What Is Data Storytelling?
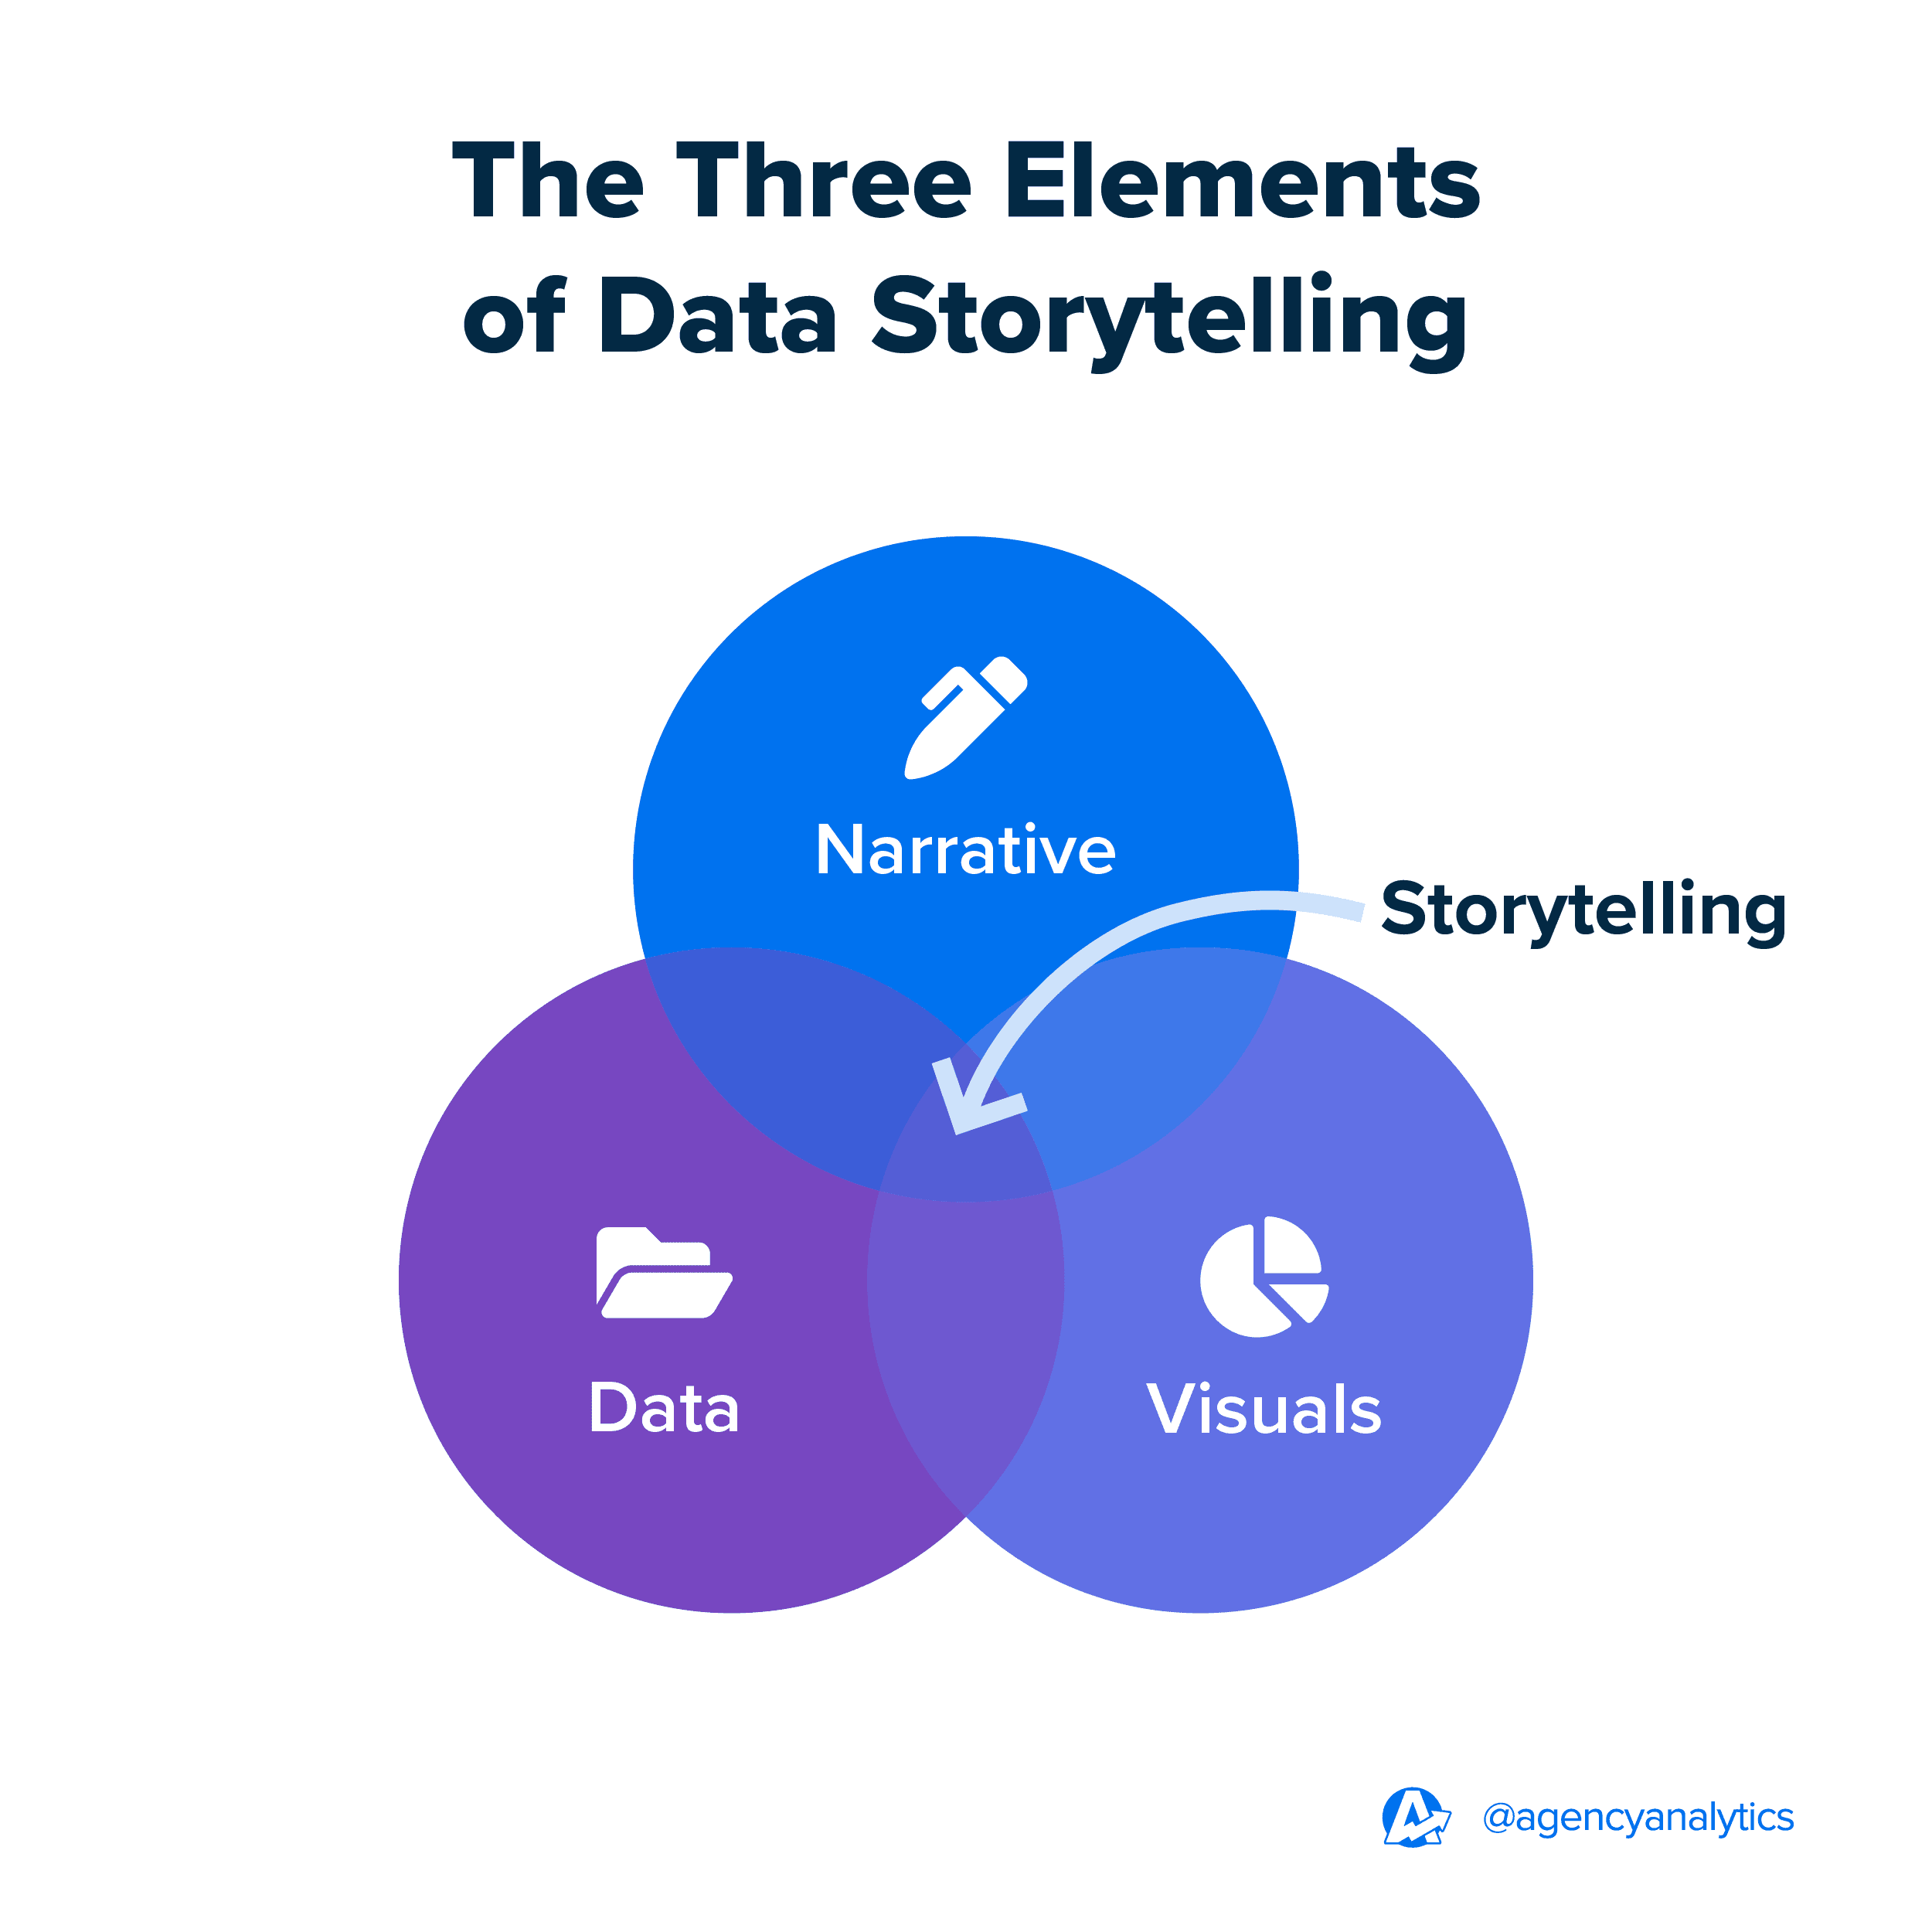
Data storytelling combines data, visuals, and a narrative to turn raw metrics into meaningful insights that inspire action. While raw data offers facts, a data story provides meaning. With data storytelling, agencies don’t just present results—they deliver a message that drives decision-making and builds client trust.
Let’s say you collect data showing that a Google Ads campaign generated 5,000 clicks. Without putting this into context, it’s difficult to understand the campaign's impact. But when framed in a data story—such as explaining how your agency targeted a specific audience segment, successfully drove that traffic to a landing page, and then converted those clicks into sales—you provide clarity.
That’s the power of storytelling: it transforms complex data into a compelling narrative that connects with clients.
Is Data Storytelling The Same As Data Visualization?
Data visualizations like charts and graphs help enhance key points in a data story, but they’re only one piece of the puzzle. Effective data storytelling combines visualizations + your data + a compelling narrative to explain why the data matters.
For example, you might use a data visualization to show a spike in web traffic during a specific period. On its own, it’s an interesting insight, but without the narrative, clients are left wondering:
What caused the increase?
Was it a successful ad campaign?
Was it from a social media post that went viral?
Is this because of a seasonal trend?
A strong data story goes beyond visualizing data to contextualize the spike, explain the contributing factors, and recommend strategies to replicate the success.
The 3 Elements of Effective Data Storytelling
Now let’s examine the three key elements of data storytelling in more detail.
1. The Data
Your agency has access to an unprecedented volume of data at every stage of a campaign, from ad performance metrics to website traffic, social media engagement, audience demographics, and beyond. This wealth of information is more than just a byproduct of digital marketing—it’s a strategic advantage. What sets your agency apart is your ability to make sense of these diverse data sets and turn them into actionable insights.
Today, agencies aren’t just creative partners delivering visually stunning campaigns. To remain competitive, you’re expected to take on the role of data scientists, uncovering patterns, spotting opportunities, and guiding clients toward measurable success.
Compelling data storytelling begins with the ability to analyze data through multiple lenses:
Understand What Happened: Review performance metrics and campaign outcomes to establish a clear baseline.
Pinpoint Why It Happened: Dig into the underlying causes, trends, and contributing factors that drove the results.
Forecast What Might Happen: Anticipate potential opportunities or risks, helping clients prepare for what’s next.
Recommend What to Do Next: Turn insights into actionable steps that align with the client’s goals.
Without these steps, even your most visually compelling presentations will lack substance.
2. The Narrative
The narrative is your storyline. It’s what contextualizes the data and makes it relevant to the client. A good storyline typically consists of the following:
Characters: In data storytelling, the “characters” are your clients and their customers.
Setting: How you set the scene to provide context for the data’s importance.
Conflict: The challenge revealed by the data.
Resolution: Your proposed solution.
To demonstrate how to build a strong narrative, imagine your marketing agency is analyzing the performance of a client’s recent Google Ads campaign. The client is a retail brand focused on sustainability, and the campaign’s goal was to increase online sales among environmentally conscious consumers. Your analysis uncovers a surprising insight: while the campaign drove 15,000 clicks, conversions were lower than expected among a key audience segment—women aged 25 to 34.
Using the four key elements of storytelling, you craft this narrative to present your findings and recommendations:
Your campaign was a success in many ways, driving 15,000 clicks and generating substantial traffic (setting).
But the data also revealed an insight worth exploring: women aged 25 to 34—a key segment of your target audience—weren’t converting at the expected rate (characters).
Our analysis shows this likely stems from the campaign’s focus on cost savings, which doesn’t align with this group’s stronger emphasis on sustainability. This disconnect in messaging may have caused them to disengage (conflict).
To better connect with this audience, we recommend revising the messaging to highlight your sustainability commitments and testing these adjustments with A/B campaigns. This approach ensures your messaging resonates with their values, paving the way for improved conversions (resolution).
By building a compelling narrative like this, you help clients understand the whole picture.
3. Data Visualizations
Visual tools such as charts, graphs, and infographics enhance your data storytelling by highlighting key trends, pinpointing areas for improvement, and showcasing campaign results in a way that resonates with clients–particularly those who are visual learners.
As you walk your client through your narrative, you might use a line graph to show the overall trend in clicks versus conversions to help set the stage for the story. Alternatively, a segmented bar chart could highlight how conversion rates varied among different audience demographics, emphasizing the underperformance of women aged 25 to 34 as an issue.
These visuals make the data easier to understand and strengthen your recommendations in a compelling, easy-to-digest format.
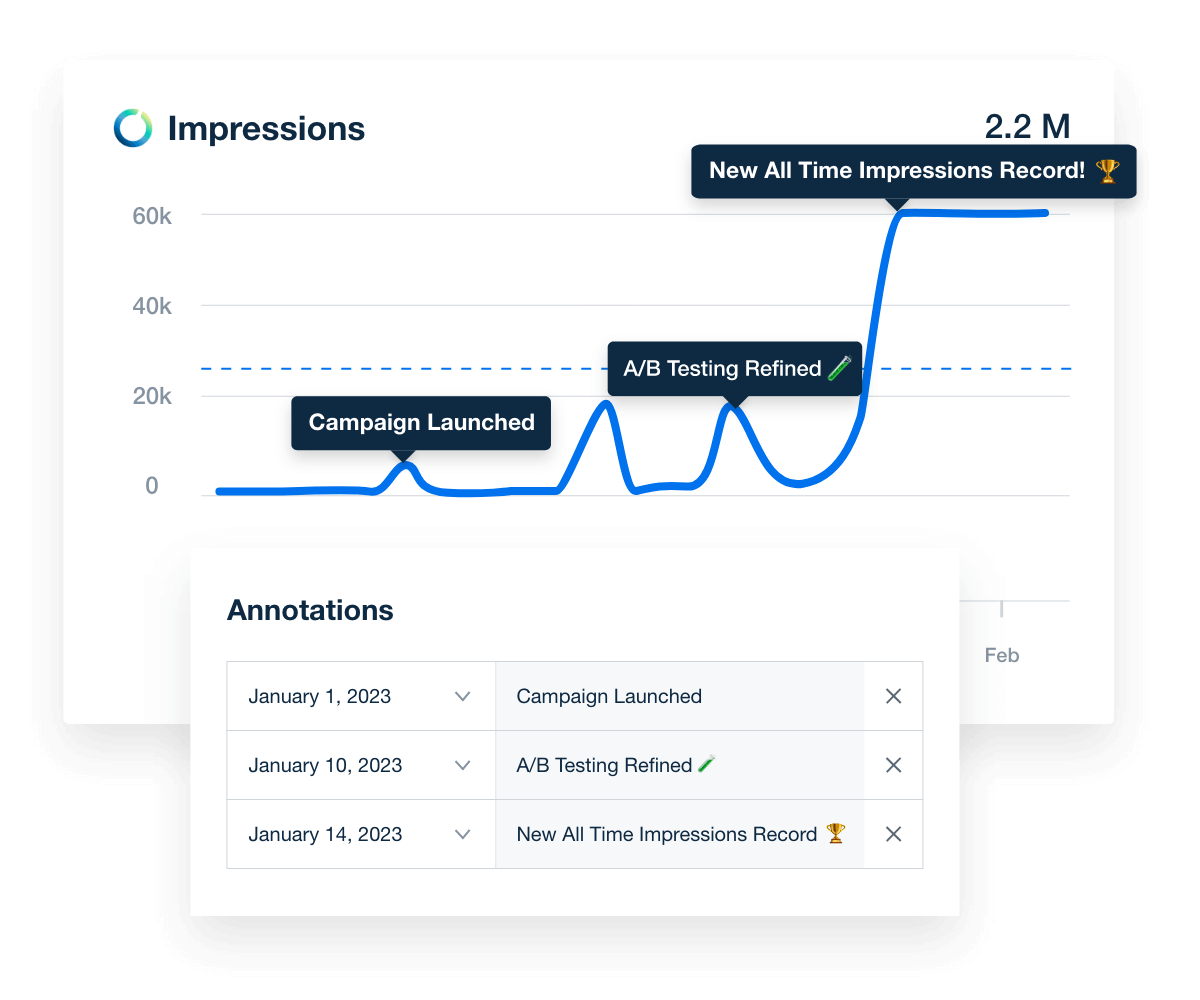
Make insights clear and impactful. AgencyAnalytics' annotations feature effortlessly highlights key points in your client reports. Try it out with your 14-day free trial.
What Are The Benefits of Data Storytelling for Agencies?
When done effectively, data storytelling bridges analytics and action, helping your agency maximize client engagement, retain clients, and even win new business.
Let’s explore a few reasons why telling a data story is valuable for your agency:
Backing Up Your Claims: Data storytelling avoids presenting vanity metrics that superficially indicate campaign performance. Instead, it ensures that your agency backs up claims of big wins with tangible evidence and real-time data.
Keeping Clients Engaged: An engaging data story transforms reports from dry updates into a conversation clients look forward to. It keeps them excited about the journey and encourages active participation in planning and strategy.
Proving ROI to Clients: A clear data story demonstrates the value of your agency’s work. Instead of handing over a report filled with numbers, you show how your efforts directly contribute to their goals.
Building Trust: Data storytelling provides clients with visibility into your work. This transparency fosters confidence in your agency and strengthens the partnership over time, showing clients they’re in capable hands.
Driving Decision Making: Data stories provide insights into what to do next. By weaving context and recommendations into your reports, you empower your agency to make informed decisions.
Differentiating Your Agency: Data storytelling helps set your agency apart from competitors who might only deliver raw numbers or basic reports. It demonstrates your expertise and commitment to providing value in an approachable, client-centered way.
Strengthening Client Acquisition: Data storytelling is also an asset during pitching. It gives your agency an opportunity to highlight opportunities and make a compelling case, giving prospects a teaser of what it’s like to work with your team.
Impress clients and save hours with custom, automated reporting.
Join 7,000+ agencies that create reports in under 30 minutes per client using AgencyAnalytics. Get started for free. No credit card required.
Already have an account?
Log inHow To Turn Raw Data Into Meaningful Data Stories For Clients
Now that you understand data storytelling and why it matters, let’s discuss how to tell a good data story.
We recently interviewed Tom Gibson, founder of Pilot, who used data storytelling to help an ecommerce client achieve remarkable results. By analyzing buying behavior and aligning advertising strategies, his agency drove a 30% increase in revenue while simultaneously reducing inventory by the same percentage.
By mastering the art of telling data stories, Pilot has empowered this client—and many others—to make smarter, data-driven decisions across every aspect of their business. From identifying the most profitable products to invest in, to determining which ones to spotlight in advertising, Pilot seamlessly blends creative insights with hard data. This approach drives top-line revenue growth and helps clients avoid costly missteps, whether in product selection or digital marketing strategies.
In this next section, we’ll share how to transform raw numbers into compelling narratives that resonate with your clients, drawing from Tom’s tried and true advice:
1. Start With a Clear Objective
Telling a strong data story begins with understanding your client’s goals. Without a clear objective, even the most well-crafted story misses the mark.
Take the time to define the key question or goal your data story needs to address. Is your client focused on increasing revenue, improving customer engagement, cutting costs, or expanding into a new market? By aligning your story with their priorities, you ensure the data insights you share are relevant, impactful, and capable of generating an emotional response from clients.
Before preparing any data story, use a client onboarding questionnaire or revisit client discovery documentation to clarify your client’s goals.
2. Determine Which Data to Focus On
The next step is to focus on the data points that best demonstrate progress toward those goals. Even though your marketing campaigns generate an overwhelming amount of data—not every data point tells a meaningful story.
We always craft our data stories based on what is most important to our clients. At different parts of clients' journeys, revenue growth is more important than cost savings, and vice versa, so ensuring you are on the same page is vital, and this helps determine what data points are the most important.
Tom Gibson, Founder, Pilot
To keep your narrative clear and impactful, identify relevant data points that directly align with the client’s priorities.
If the goal is revenue growth, prioritize metrics like Return On Ad Spend (ROAS), Customer Lifetime Value (CLV), or sales conversions.
If the focus is improving brand awareness, highlight data like social media reach or website traffic.
If a client values customer satisfaction, highlight how their improved response rates or Net Promoter Score (NPS) indicate happier, more loyal customers.
If they focus on long-term growth, you might frame metrics like increased conversions or brand awareness within the context of sustained business success.
Agency Tip: For every metric you include, ask yourself: “What does this mean for the client?” If the data doesn’t answer that question, it may not belong in the story.
3. Gather and Analyze Your Data
Collecting the right data sets is one thing. Next, you’ll need to turn this data into actionable insights—trends, patterns, and findings that guide strategy and decision-making.
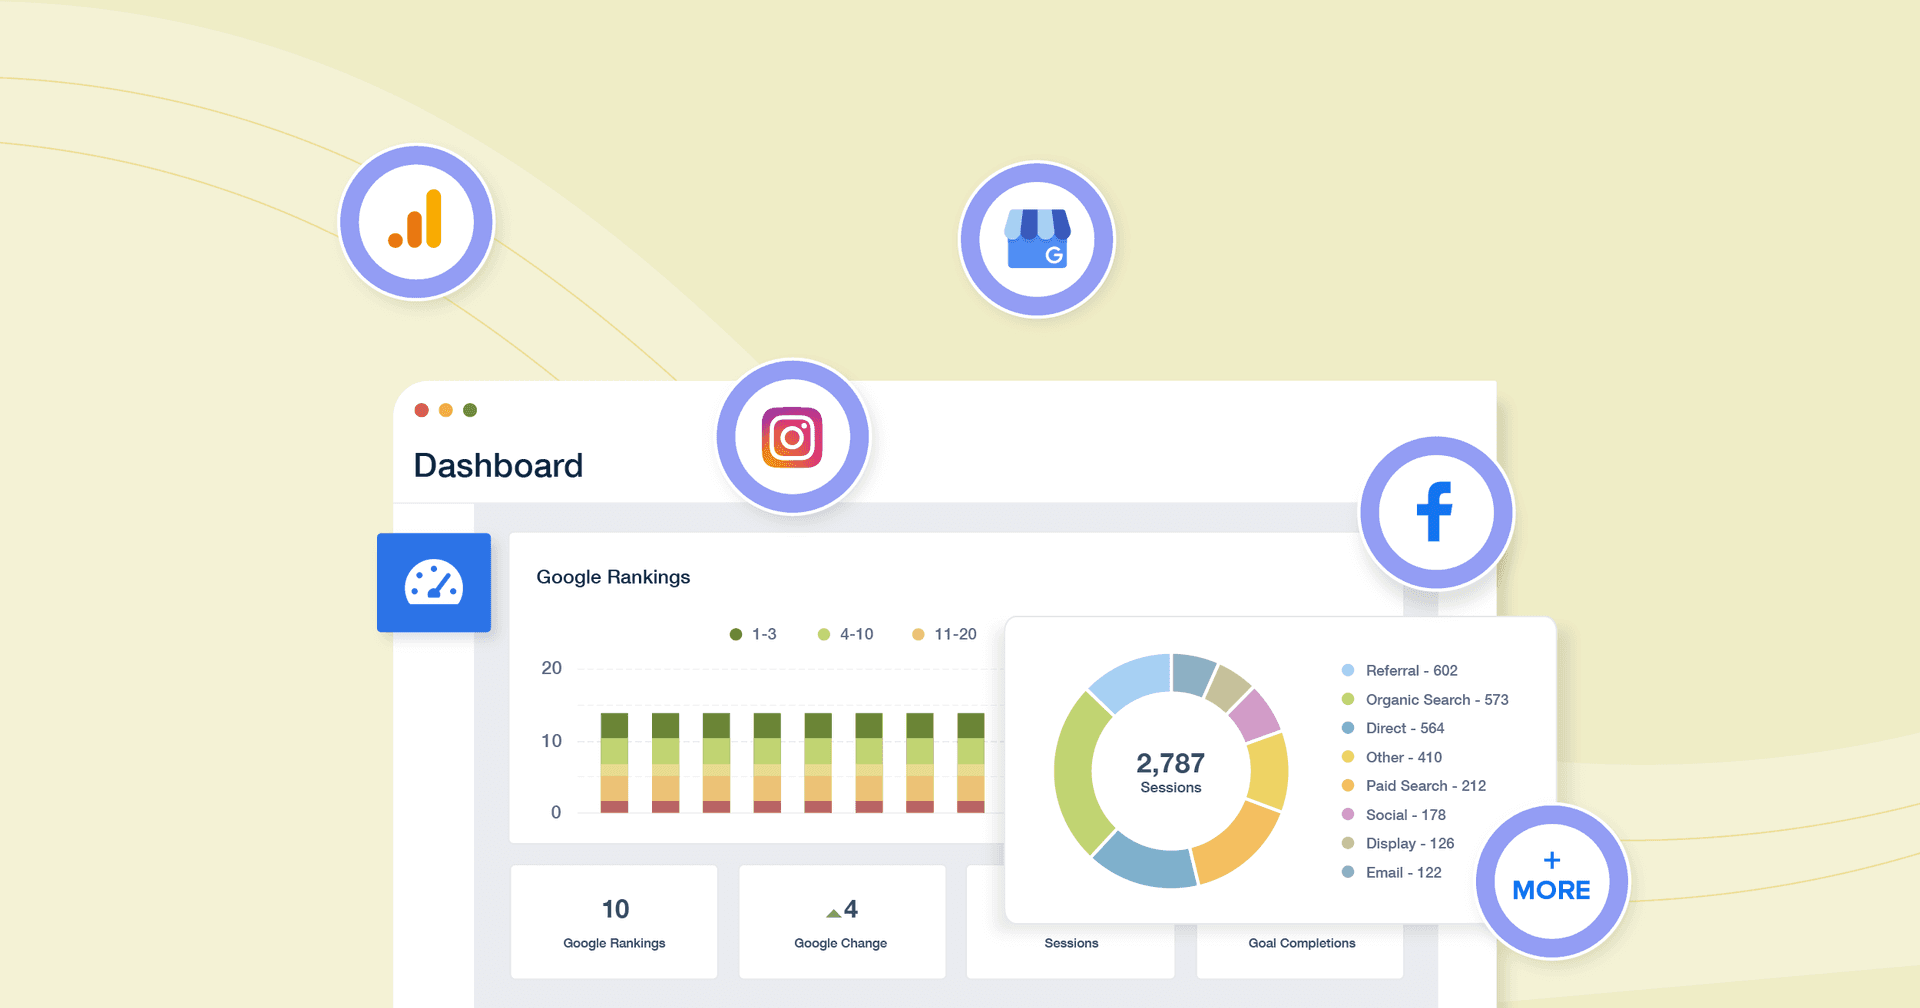
Manual data collection and analysis is extremely time-consuming. To avoid inefficiencies, use data analysis and automated client reporting tools to streamline your workflow. Explore tools that integrate seamlessly with the platforms your clients rely on, such as Google Ads, Facebook, or HubSpot, to centralize data from multiple sources. This saves time and ensures consistency.
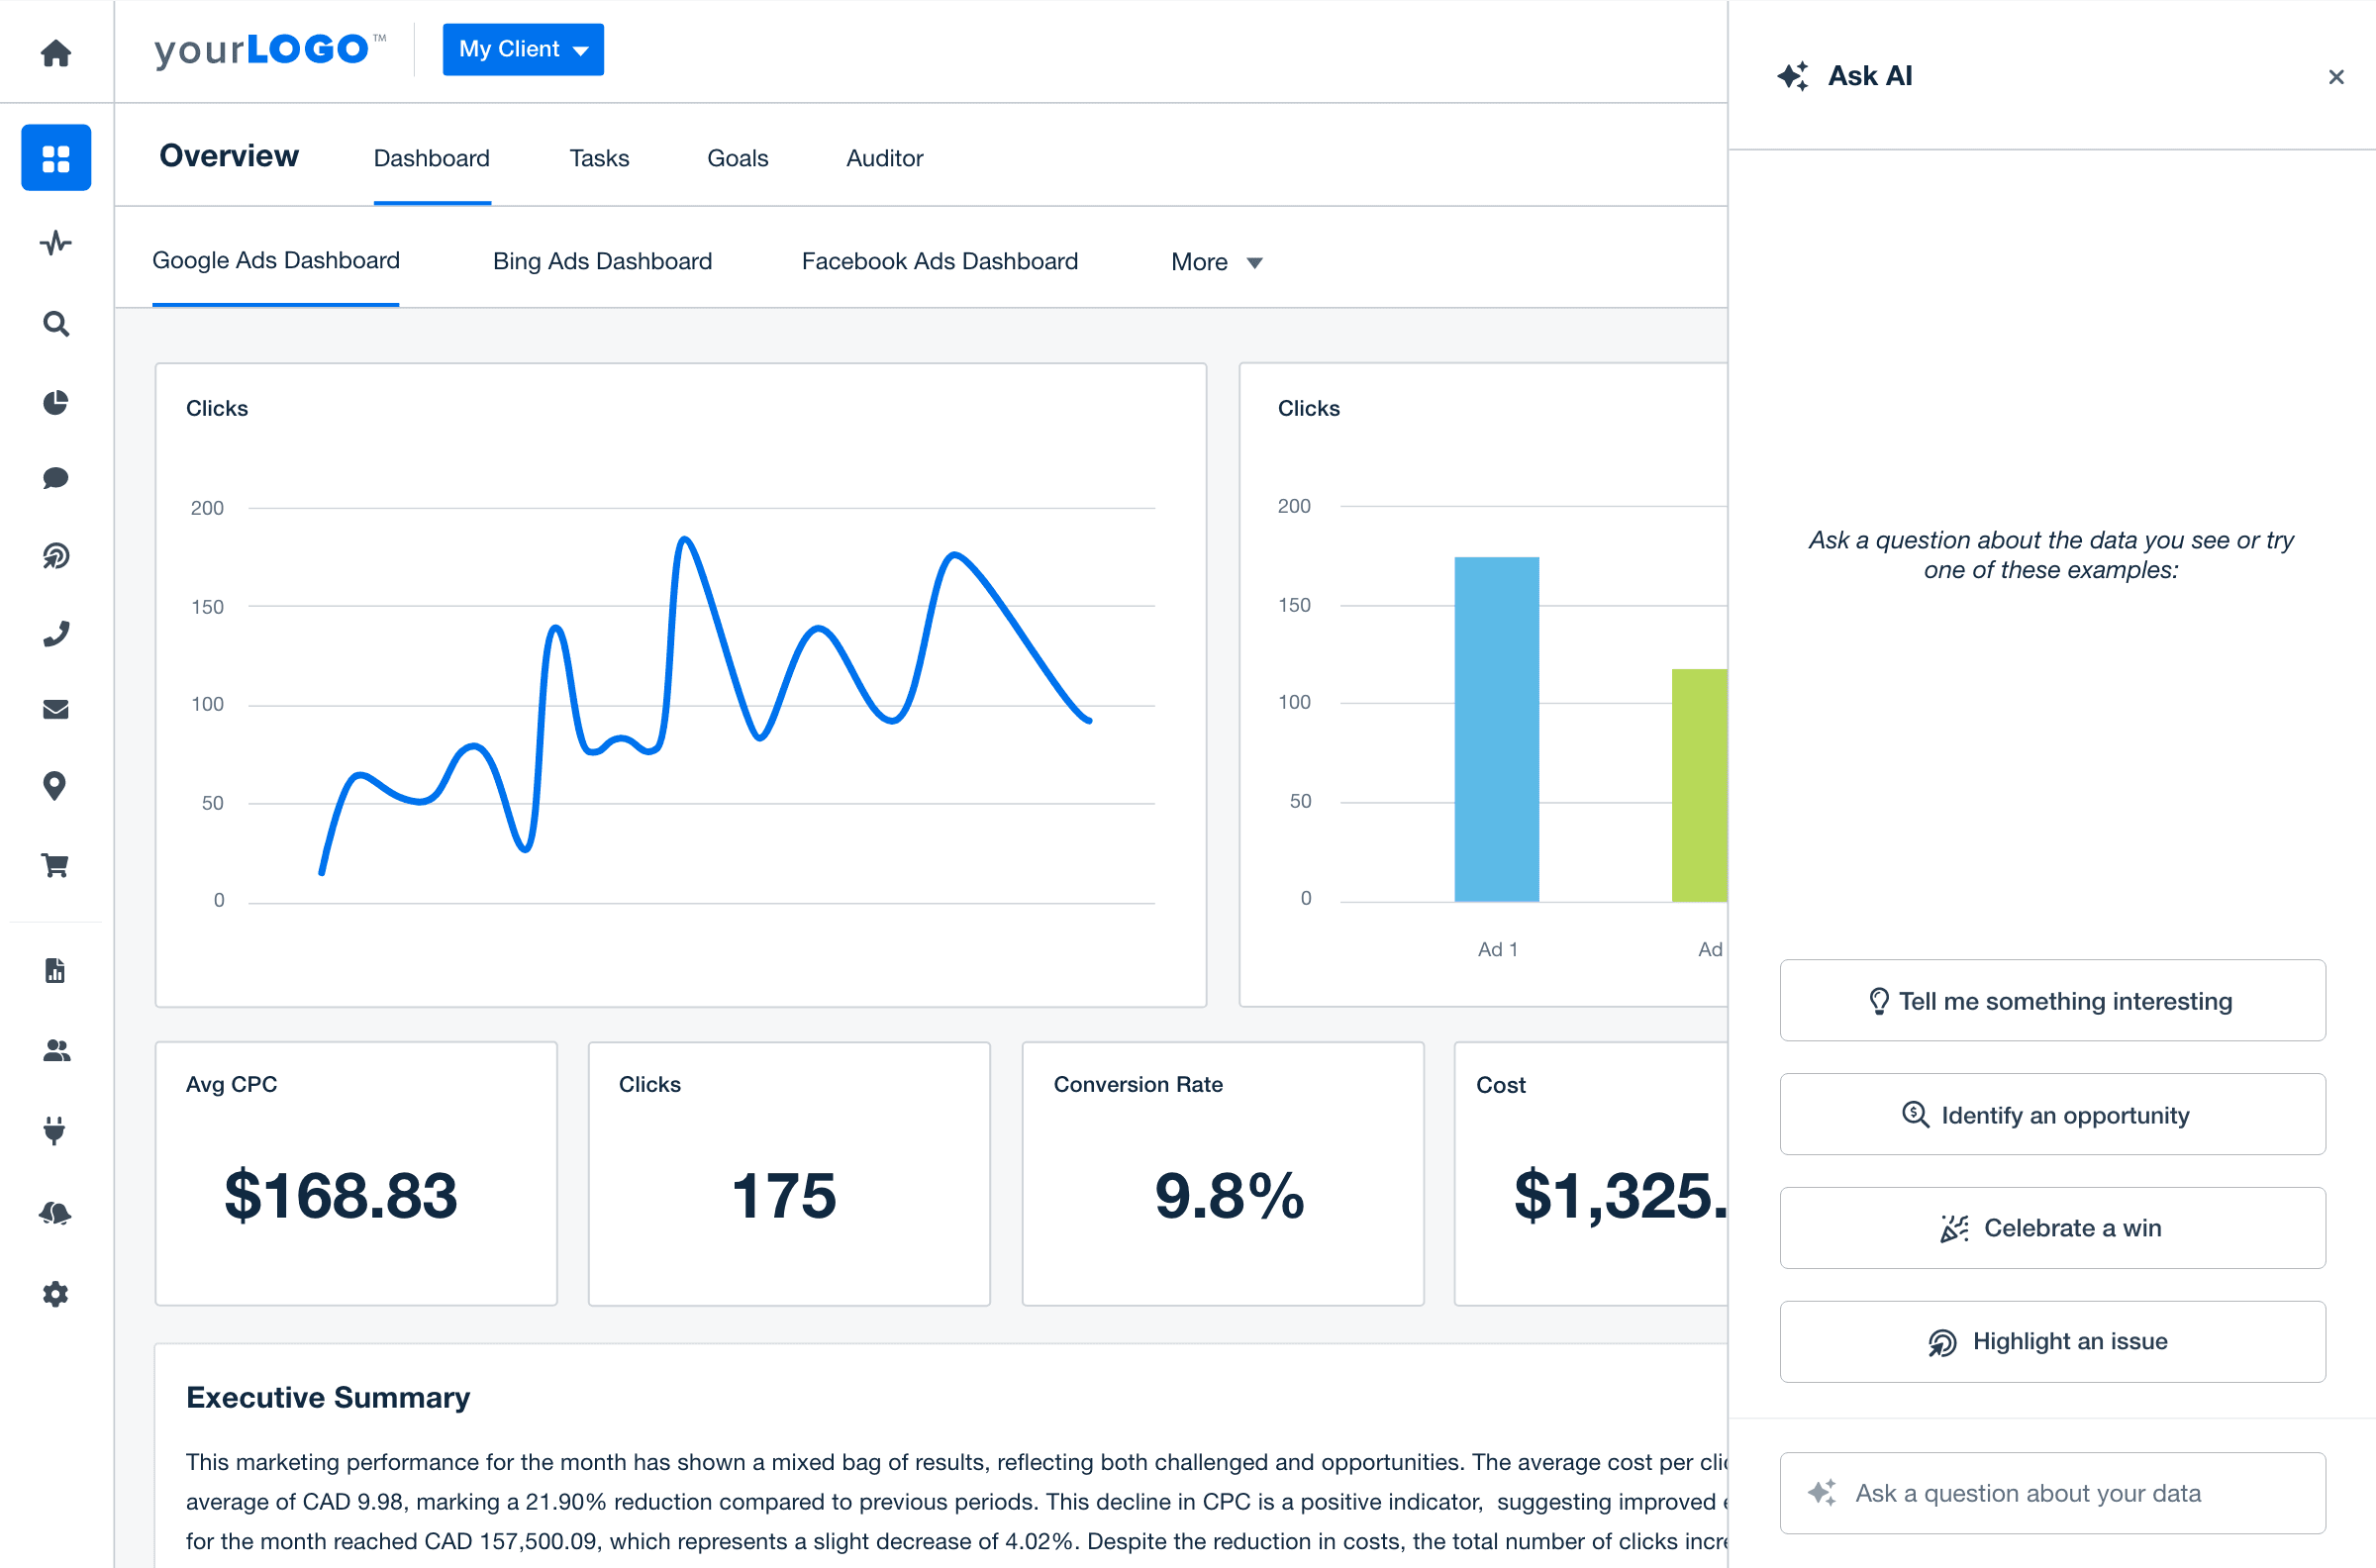
With features like AI-powered insights, automated reporting, and live dashboards, AgencyAnalytics helps you save time, identify trends, and surface critical findings. Try it yourself with an AgencyAnalytics 14-day free trial.
Data Analysis Best Practices
Once you have your data ready to go, follow these three tips for leveraging data effectively:
Look beyond standalone metrics to uncover patterns and trends. For instance, are conversion rates consistently higher at certain times of the week or month? Are specific audience segments engaging more with certain ad creatives?
For each key insight, dig deeper to identify the root cause. Why did engagement increase for one campaign but not another? Why is one platform outperforming others in terms of ROI? Answering these questions adds depth to your analysis.
Collaborate with your team to bring in multiple perspectives and ensure you’ve considered all angles when interpreting the data.
By combining technology with a strategic approach to analysis, you pull the most essential data insights, ensuring that your client reports are actionable and up to date.
4. Frame Your Data
Craft your storytelling narrative to structure your insights. Define the characters, setting, conflict, and resolution discussed earlier to make your findings more engaging.
To elevate your storytelling, go beyond standalone metrics by incorporating comparative analysis and show clients how their performance stacks up over time, across audience segments, or against industry benchmarks. Highlight trends, such as seasonal spikes or demographic patterns, and use before-and-after comparisons to demonstrate the impact of your work.
Adding industry benchmarks provides valuable context, like showing how a client’s conversion rate outperforms the market average.
Use AgencyAnalytics’ benchmarks feature to compare your clients' most important metrics directly against industry medians over the last 30 days. Try it out with your AgencyAnalytics 14-day free trial.
5. Create Data Visualizations
If your agency is still new to data storytelling, start with simple charts, such as pie charts or bar graphs, to break down data into digestible pieces. As you build more confidence, experiment with more advanced techniques to provide deeper insights.
Focus on visuals that directly support your narrative and highlight the key points. Use a variety of visualizations tailored to the type of data you’re presenting. Line graphs show trends over time, while tables are ideal for direct comparisons. Heatmaps illustrate geographic performance, scatter plots reveal correlations, and infographics simplify complex concepts.
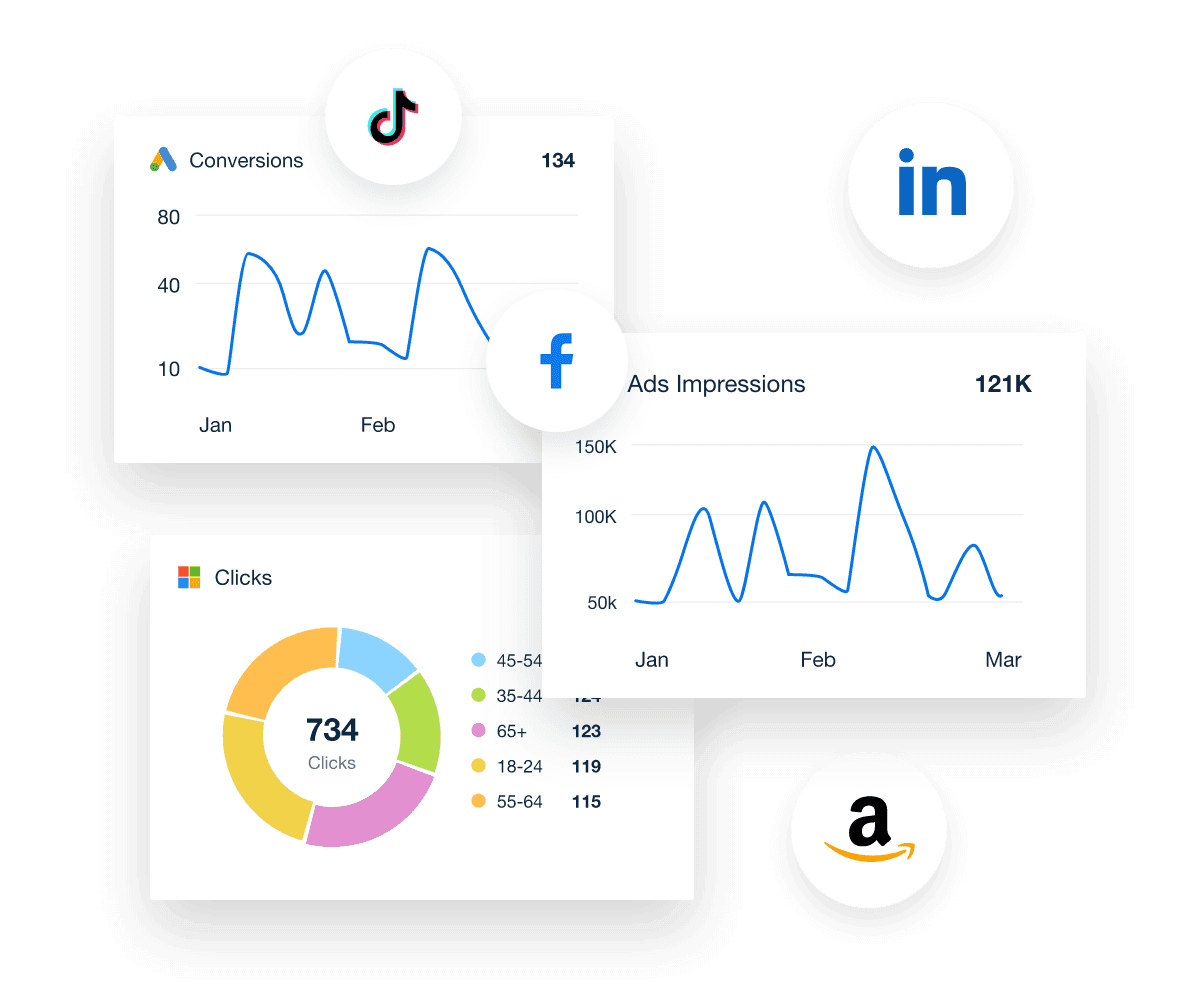
Use different graphs and tables to highlight different data sets, ensuring the brain can switch context. Highlight key information using different colors.
Tom Gibson, Founder, Pilot
Incorporate colors, annotations, or callouts to guide the client’s focus to critical findings and ensure your insights are easy to follow. Keep your visualizations concise and purposeful to avoid overwhelming your audience. Also remember to tailor visualizations to your audience. Executives may prefer simplified overviews, while marketing managers might appreciate detailed comparisons.
6. Present Your Data Story In A Professional Report
The way you present your data story is just as important as the insights themselves. A professional, polished report ensures your findings are clear, actionable, and easy for clients to reference whenever they need.
To create a strong client report, make sure it has:
Clear Structure: Organize the report with distinct sections, such as a summary of key insights, detailed performance data, and actionable recommendations.
Visual Engagement: Use diverse visualizations—graphs, tables, and infographics—to break up text-heavy sections and make the data more digestible.
Contextual Annotations: Add annotations to charts or key metrics to explain trends and guide clients through the data story.
Custom Branding: Include your agency’s logo, colors, and style to create a cohesive, branded presentation.
Actionable Insights: Conclude with clear, prioritized next steps tied to the client’s goals.
We always support data with narrative elements. Many of our clients are extremely creative, so ensuring there are both visual and narrative elements is vital to all client engagements. We balance this by providing shorter narrative elements with technical data, highlighting the key parts clients need to read/understand rather than huge explanations.
Tom Gibson, Founder, Pilot
A well-prepared report isn’t just a one-time presentation—it’s a resource clients return to again and again. Whether they need to share insights with stakeholders, plan their next steps, or revisit campaign performance, your report should stand out as a reliable, easy-to-understand document.
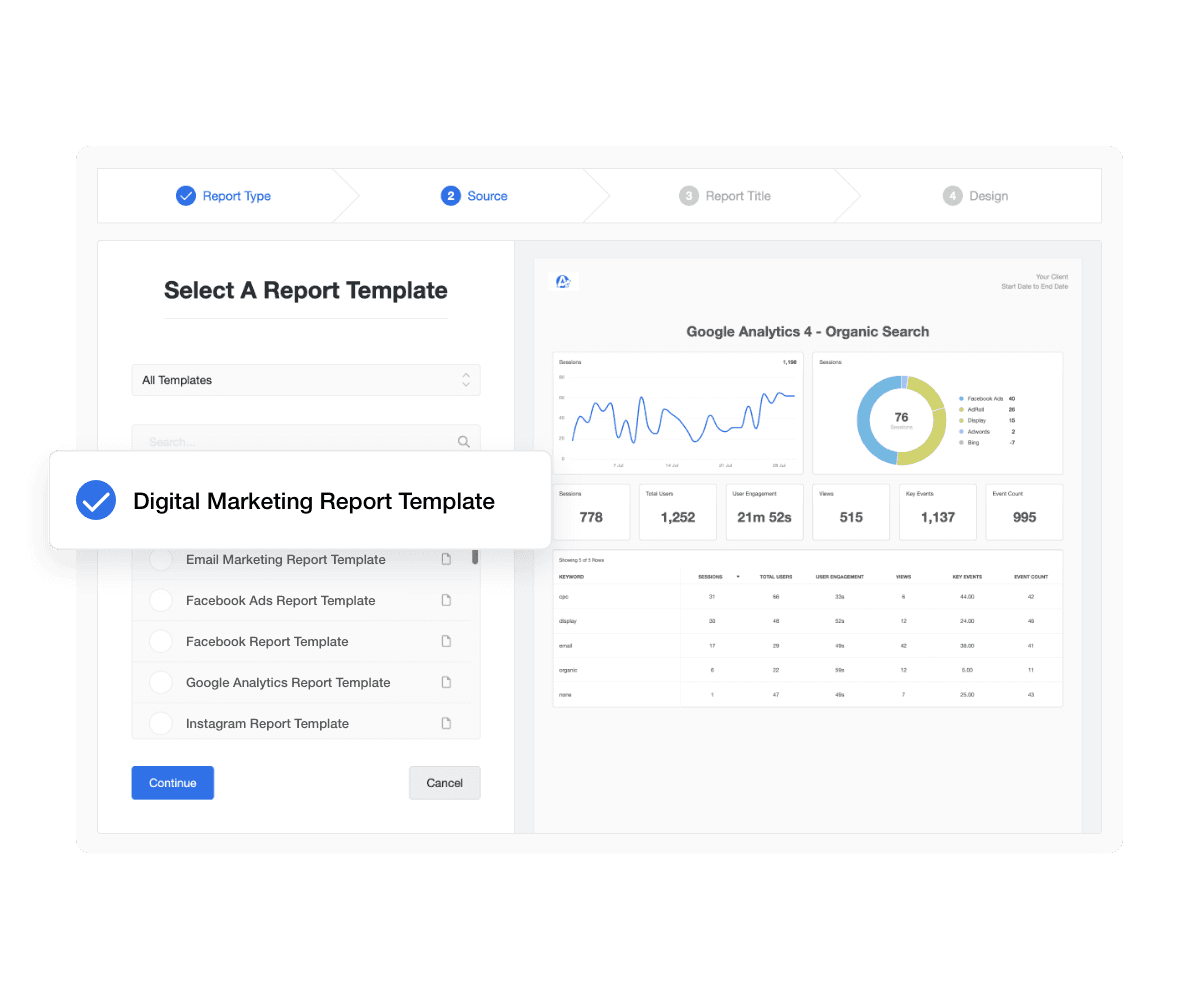
AgencyAnalytics’ client report templates help you streamline the reporting process without sacrificing quality. These templates save your agency time while ensuring every report is professional and easy to navigate. Use customization options to highlight the most relevant metrics, include annotations for added context, and even integrate your branding to reinforce your agency’s professionalism.
7. Refine and Iterate Your Data Storytelling Approach
Data storytelling isn’t a “set it and forget it” process—it requires continuous improvement to ensure your approach remains impactful and resonates with your clients. Treat each data story as a learning opportunity to enhance your three elements. Take note of what worked, what didn’t, and how to improve for next time. By experimenting with different techniques and iterating based on feedback, you refine your storytelling process, making your reports even more effective.
Test Different Story Structures: For example, you might use a straightforward chronological format to show progress over time or a problem-solution framework to highlight how your efforts addressed a specific challenge.
Adapt Narratives to Your Audience: CEOs may prefer high-level summaries, while marketing managers might appreciate detailed insights.
Try Different Story Formats: Some clients may respond well to interactive live presentations, while others prefer static reports they can review at their own pace.
Ask For Direct Feedback: After each presentation or report, ask clients what resonated with them, what felt unclear, and what they’d like to see in future reports. This feedback is invaluable for refining your storytelling process.
Monitor How Clients Engage With Reports and Presentations: Do they revisit certain sections more often? Are there questions or follow-ups that indicate gaps in understanding? Use these insights to refine your approach.
Make Data Meaningful
Data storytelling is necessary for agencies looking to prove value, build trust, and drive results. By combining analytics, visuals, and narratives, you transform raw numbers into compelling stories that resonate with clients every time.
Tools like AgencyAnalytics make the process seamless, allowing your agency to focus on strategy while delivering impressive reports. Start turning your client data into powerful stories today, and watch your client relationships flourish!

Written by
Sylva is an expert content writer with over 10 years of experience in tech and SaaS, offering first-hand insight into agency needs from her background in advertising.
Read more posts by Sylva SivzattianSee how 7,000+ marketing agencies help clients win
Free 14-day trial. No credit card required.


