Table of Contents
QUICK SUMMARY:
Analytical reports dive into data beyond numbers, offering insights for informed decision-making and strategic marketing actions. These reports showcase an agency's credibility while empowering clients with data-driven recommendations to enhance marketing ROI. This article covers seven best practices for crafting analytical reports.
Analytical reporting is about much more than presenting data and metrics. These comprehensive reports offer detailed insights into what the data means, how it should be interpreted, and learnings to be gleaned from it.
The analytical report format not only establishes the credibility of your agency, but also offers your clients clear, data-driven recommendations on their marketing efforts.
Analytical reports help agencies quantify the impact of campaigns, identify areas for improvement, and guide future strategies. By presenting clear, relevant data and actionable recommendations, analytical reports enhance transparency, support more informed decisions, and ultimately optimize marketing ROI for both your agency and your clients.
Let's take a deeper dive into what sets a great analytical report apart, and how to improve reporting practices to offer the most relevant, actionable insights to clients.
What Makes a Great Analytical Report?
Unlike standard reporting that simply presents data and metrics, analytical reports delve deeper into the numbers to pinpoint patterns, draw correlations, and identify causality within results. Bonus point? If your analytical reports are made with precision, they become an essential tool for client acquisition and retention, and building client trust.
What we have found is that AgencyAnalytics is a huge selling tool. Clients large and small see all of the integrations and the fact that you can house all of this data in one place and it's really easily digestible for them. It really is one of the main selling points that pushes them over the edge to become an actual client. It's an invaluable tool for helping us showcase the positive movement that we're making in the services that we offer. It's a great selling tool for our agency, and it's the primary way that we continue to showcase our positive results to the client.
Chris Burns, CEO, DigiSphere
Analytical reports don't just offer surface-level information, but provide strategic insights and recommendations based on the key performance indicators being measured and tracked. It's like the difference between a grocery list of basic items, and a meal kit box with pre-portioned ingredients and a step-by-step recipe card.
That said, it can be challenging to ensure that your agency's analytical reports are giving clients that added value. Great reporting starts with understanding the characteristics that make a report stand out. Effective analytical reports are clear, contextual, and customized:
Clear: Present data and analyses in a straightforward and comprehensive manner. This might involve data visualization, bulleted lists of recommended action items, or a written data analysis report that summarizes the key takeaways. It could also mean providing definitions for complex data points so that data remains accessible and digestible.
Contextual: Display data within a broader context so clients understand its significance. For example, connect performance data with predetermined campaign goals to underscore the business impact. Or, benchmark with historical data when analyzing current data to understand trends over time.
Customized: Each analytical report should be as unique as the client it's made for—and reflect the real value of your agency's hard work. Data and metrics should be selected with intention, insights and deductions should be thoughtfully outlined, and proposed solutions should balance the client's goals with your agency's expertise.
Ultimately, a successful analytical report is one that communicates the results of your agency's efforts, the business impact it has for your client, and most importantly, what to do with that information. Your clients should feel empowered to make data-driven decisions and implement learnings and recommendations outlined in the report.
Impress clients and save hours with custom, automated reporting.
Join 7,000+ agencies that create reports in minutes instead of hours using AgencyAnalytics. Get started for free. No credit card required.
Types of Data To Include in an Analytical Report
In the agency world, there are a ton of data types that might fit into an analytical report. So how should your agency decide which data should make the cut?
Keep the report's audience at the forefront—the choice will ultimately depend on the client's goals, their business strategy, and the work your agency has done for them.
Provide them with a document, a once a month touch point that accomplishes all of that. It informs their decision making, updates them on campaign statuses, tells them that what they're paying us to do is actually worth the money. So, that one report has to do all of that, because, as we grow our client list we can't be on the phone with every client every other day; there's not enough hours in the week for that.
Michael Gasser, Co-Owner/Partner, Squeeze Marketing
To help get the ball rolling, consider using the following types of data to create well-rounded and valuable analytical reports:
Audience Insights
This includes things like demographics, behaviors, and preferences of your client's target audience, whether it's within the context of the work your agency has done or more general market research.
Measuring audience insights across various channels or campaigns makes for an insightful analytical report that focuses on how marketing efforts are landing with certain user profiles through different efforts or initiatives. This will inform the client on whether they're effectively reaching their intended audience.
Campaign Performance Data
When your marketing agency creates specific campaigns for clients, it's important to track performance insights like engagement metrics, leads generated, conversion rates, and other indicators of success.
What we do as a retention method is we report detailed analytics and data every month. And then do the analysis for each individual client to explain what all of that means. Assess the effectiveness of campaigns, tell them what's working and what's not working. Use the data as an indicator on other strategies that might work right there's so much information. You can gather from all of the data available, and if you know what you're looking at, you can draw some very accurate conclusions about customer behavior momentum, and the direction of individual campaigns. So, the report and analysis that we give every client every month, that's our retention and what we found is that our retention is about three and a half times longer than other agencies locally, without using any time based contracts.
Michael Gasser, Co-Owner/Partner, Squeeze Marketing
This type of data may be evaluated as static or dynamically, for example by tracking trends over time or comparing one campaign's performance against another's. Setting clear goals for campaigns from the outset will help narrow the focus of the report, and serve as a guidepost for the report's purpose.
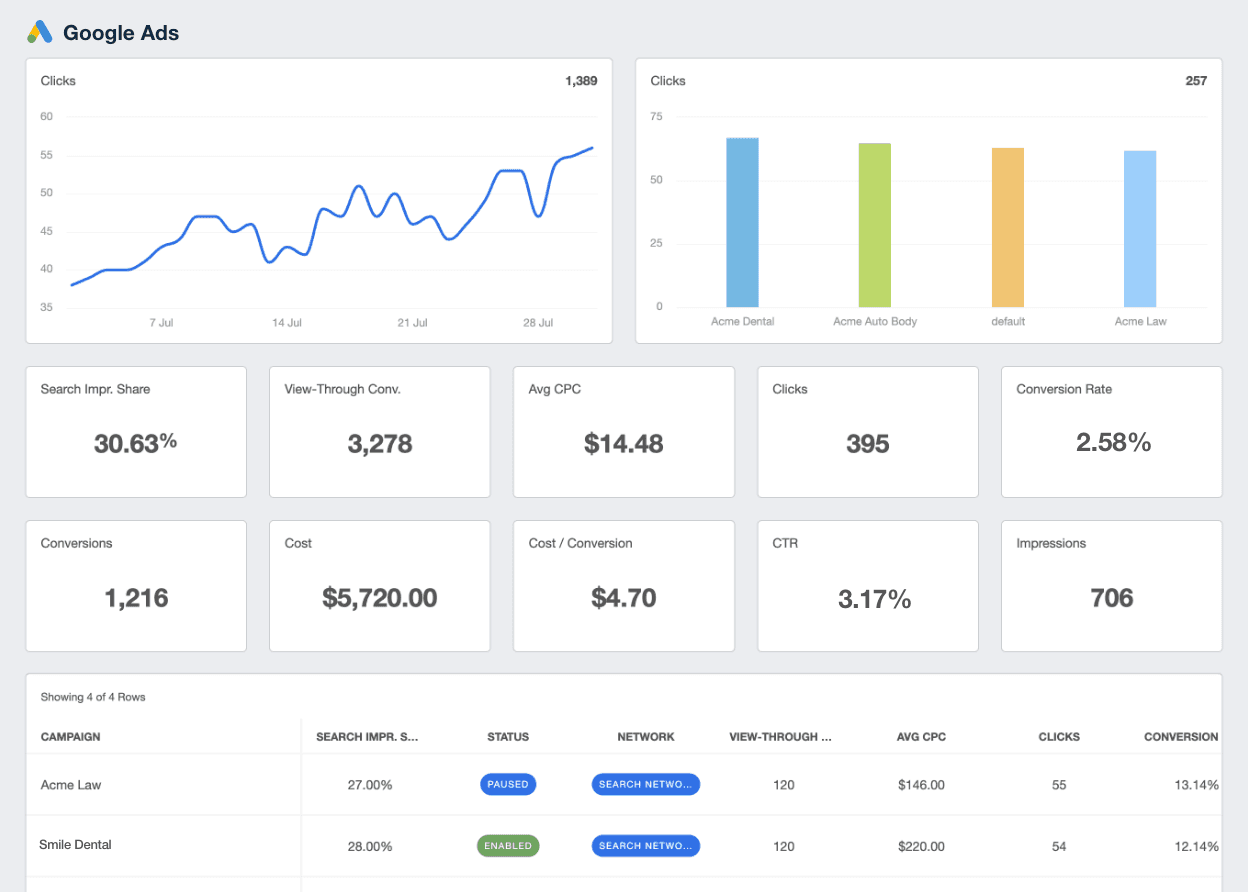
Track and display campaign data from more than 80 marketing platform integrations. Try AgencyAnalytics free for 14-days.
Market Trends Analysis
Digging into industry and market trends like market share, consumer spending trends, and market growth rates gives clients valuable insights into the field they're playing within, and how to stand out.
A strong industry report offers data-driven insights into how to stay ahead of the curve, jump on emerging opportunities, and adapt strategies to suit changing consumer preferences. This type of analytical report is a great way to inform clients on the value your agency provides, and to demonstrate your agency's savvy.
Competitor Intelligence
Similar to market and industry analysis, competitor intelligence like competitors' customer satisfaction rates, prices, or market share helps your clients evaluate how they stack up against other leaders in their space.
This is another way to pack a punch and show what your agency has to offer. Analyzing your client's competitors helps you bring an outside perspective to their position within their niche. Your agency will point out whitespace opportunities, key differentiators, and more with this type of analysis.
Customer Journey Mapping
Customer journey maps provide a holistic view of how customers interact with your client’s brand, from initial awareness to conversion and beyond. By analyzing this data, your agency identifies key touchpoints and pain points in your client's customer journey and provides recommendations for improving the overall customer experience.
Focusing on enhancing the customer journey is a great way to break out of basic performance reporting, and offer more comprehensive guidance to clients that prioritizes long-term customer satisfaction and loyalty.
Content Performance Metrics
This encompasses engagement metrics, click-through, and conversion rates on content across multiple channels, such as your clients' social media accounts, website and landing pages, ecommerce store, email campaigns, and advertisements.
In terms of a client's website or blog, web content performance metrics will also cover SEO analytics and web analytics. Comparing different content and channels is a powerful way to point out successful elements of your clients' content strategies as well as opportunities and areas for improvement.
Sales and Revenue Data
Sales and revenue data like revenue attributed to campaigns and ad conversion rates provide a direct measure of the impact of marketing and advertising efforts on the client’s business outcomes. By analyzing how sales and revenue metrics connect back to marketing activities, your agency better demonstrates the ROI you're providing for clients.
This focus on bottom-line impact sets your agency apart as a strategic partner committed to driving success for your clients. Now that's a win-win!
Each of these data types serves a unique purpose and offers distinct value for your clients. Different decision makers will want to see different information in their reports, so it's useful to be aware of all the styles and types of analytical reports you might create. What's most important is that the data selected tells a story about the efforts made and the outcomes achieved.
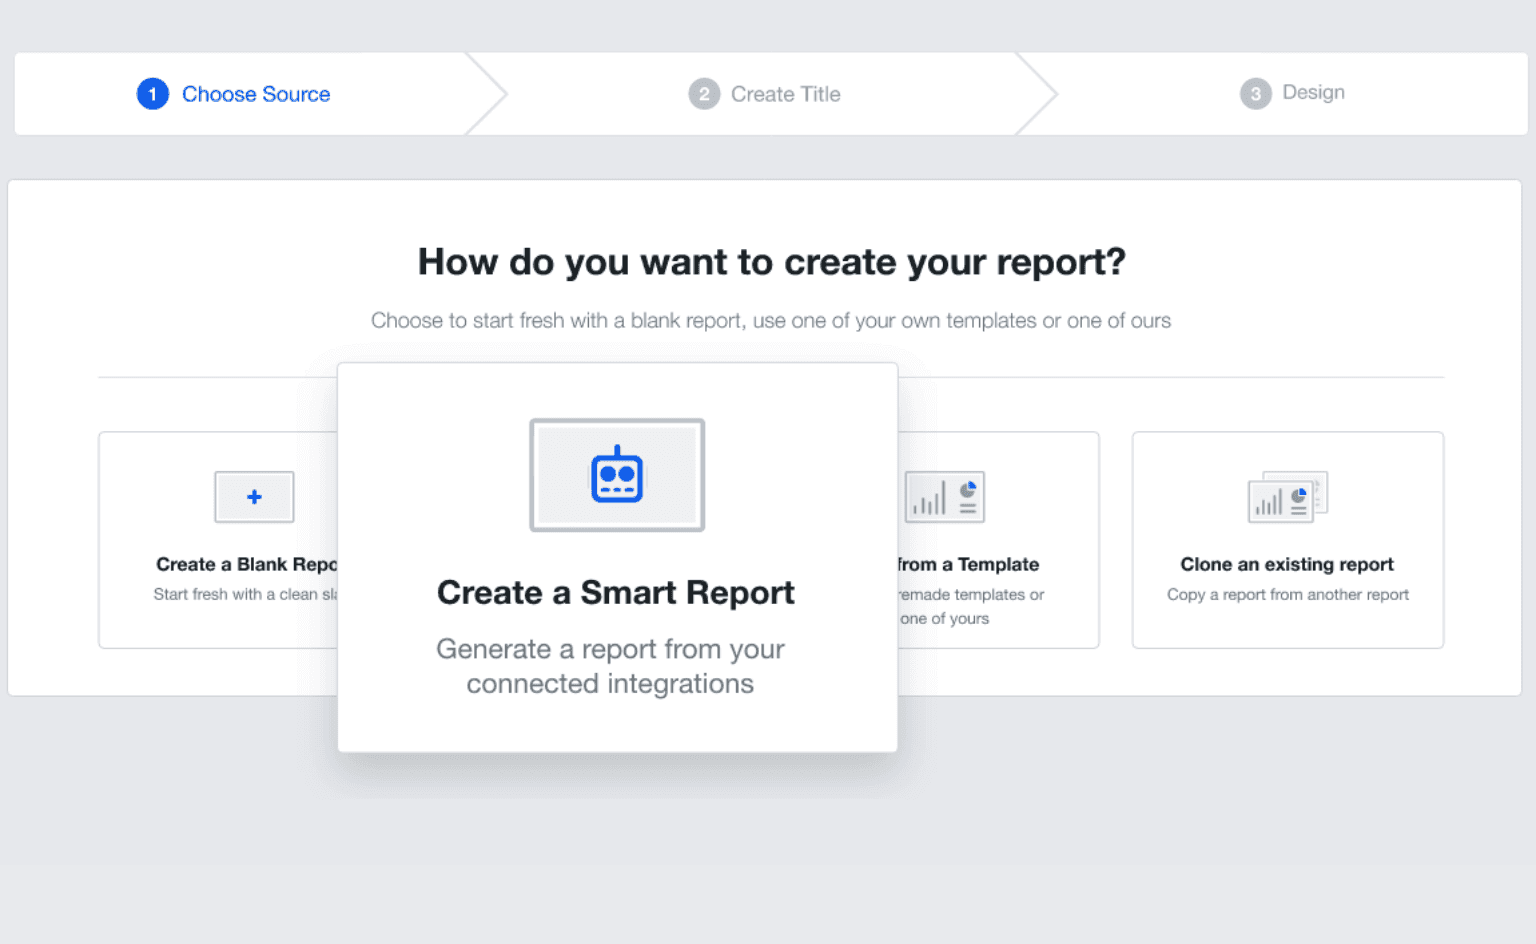
Create reports in 11 seconds flat using the AgencyAnalytics Smart Reports feature. Try it free for 14 days.
4 Common Challenges of Creating Analytical Reports (And How To Address Them)
There are many reasons why agencies struggle with producing high value analytical reports for their clients. Pinpointing the challenge or challenges your agency is grappling with is the first step towards a solution, and a better business report! Let's dive into some common challenges of analytical reporting, and ways to address each one:
1. Data Fragmentation
Siloed systems like social media channels, Google Analytics, email marketing platforms, and customer relationship management (CRM) software make it difficult to gather data in a consolidated report. If your agency can't bring the right data together, it'll be even harder to draw meaningful analyses—let alone provide a comprehensive and accurate overview of key metrics.
How To Address It: Implementing the right data integration tools helps your agency centralize all the data from different sources creating a unified dataset for analysis. To take this a step further, a complete reporting solution like AgencyAnalytics not only centralize all the data from different sources, but provides a platform for digital analytical reporting.
2. Poor Data Quality
Inaccuracies, inconsistencies, and missing data hinders your agency's ability to derive meaningful insights and back up proposed solutions. This undermines the credibility of an analytical report, and might lead to mistrust from clients if they spot reporting errors or find that relevant information is missing.
How To Address It: Establishing data governance protocols, implementing data validation processes, and investing in data cleansing tools are all great ways to ensure data accuracy and reliability. While setting up a data infrastructure is sometimes a time consuming process, there are lots of business intelligence (BI) tools and client reporting solutions available that offer a friendly interface for non-technical users.
3. Limited Access to Data
Agencies in particular often face limitations in accessing relevant data due to data privacy regulations, contractual restrictions, or proprietary data owned by clients or third-party vendors. This makes it harder for your agency to conduct thorough analyses, and may result in incomplete or skewed insights.
How To Address It: Your agency might opt to negotiate better data access agreements with clients, leverage anonymized data sources where applicable, or invest in data partnerships to augment internal datasets. Be sure to effectively communicate to clients why data access is important, and how it will help your agency provide more actionable insights and recommendations.
4. Difficulty Prioritizing Insights
On the flip side, when there's a ton of data available, marketing agencies may find it challenging to prioritize which insights to track and include in analytical reports. This may end up leading to information overload and confusion for clients, ultimately diluting the impact of the analytics report and diminishing its effectiveness in guiding strategic decision-making.
How To Address It: Aligning early with clients to understand their specific business objectives and information needs is essential. Deciding on KPIs and metrics to track from the outset is even better. Focus on delivering insights that are actionable, relevant, and aligned with a client's priorities.
7 Best Practices for Building Analytical Reports
Now that we've covered the various types of data to include in an analysis report and how to troubleshoot some of the common challenges agencies face in analytical reporting, it's time to shift into best practices.
When your agency is working on analytics reports, it's important to have some common ground on how to go about it. That way, different team members and departments will be able to produce similar reporting outputs, creating consistency for clients and assuring high-quality reporting practices.
Here are a few best practices for analytical reporting that you might consider having everyone at your agency adhere to:
1. Establish KPIs and Goals Upfront
This was briefly covered in the challenges section, but it bears repeating. Discussing key performance indicators (KPIs) and objectives with clients as early into the process as possible sets your agency up to deliver results that are aligned with a client's vision.
Not only that, but this step helps to manage expectations on the client's side. If they have an objective that simply won't be attainable with their budget or strategy, this will be an opportunity to discuss that and find a compromise or make adjustments as needed.
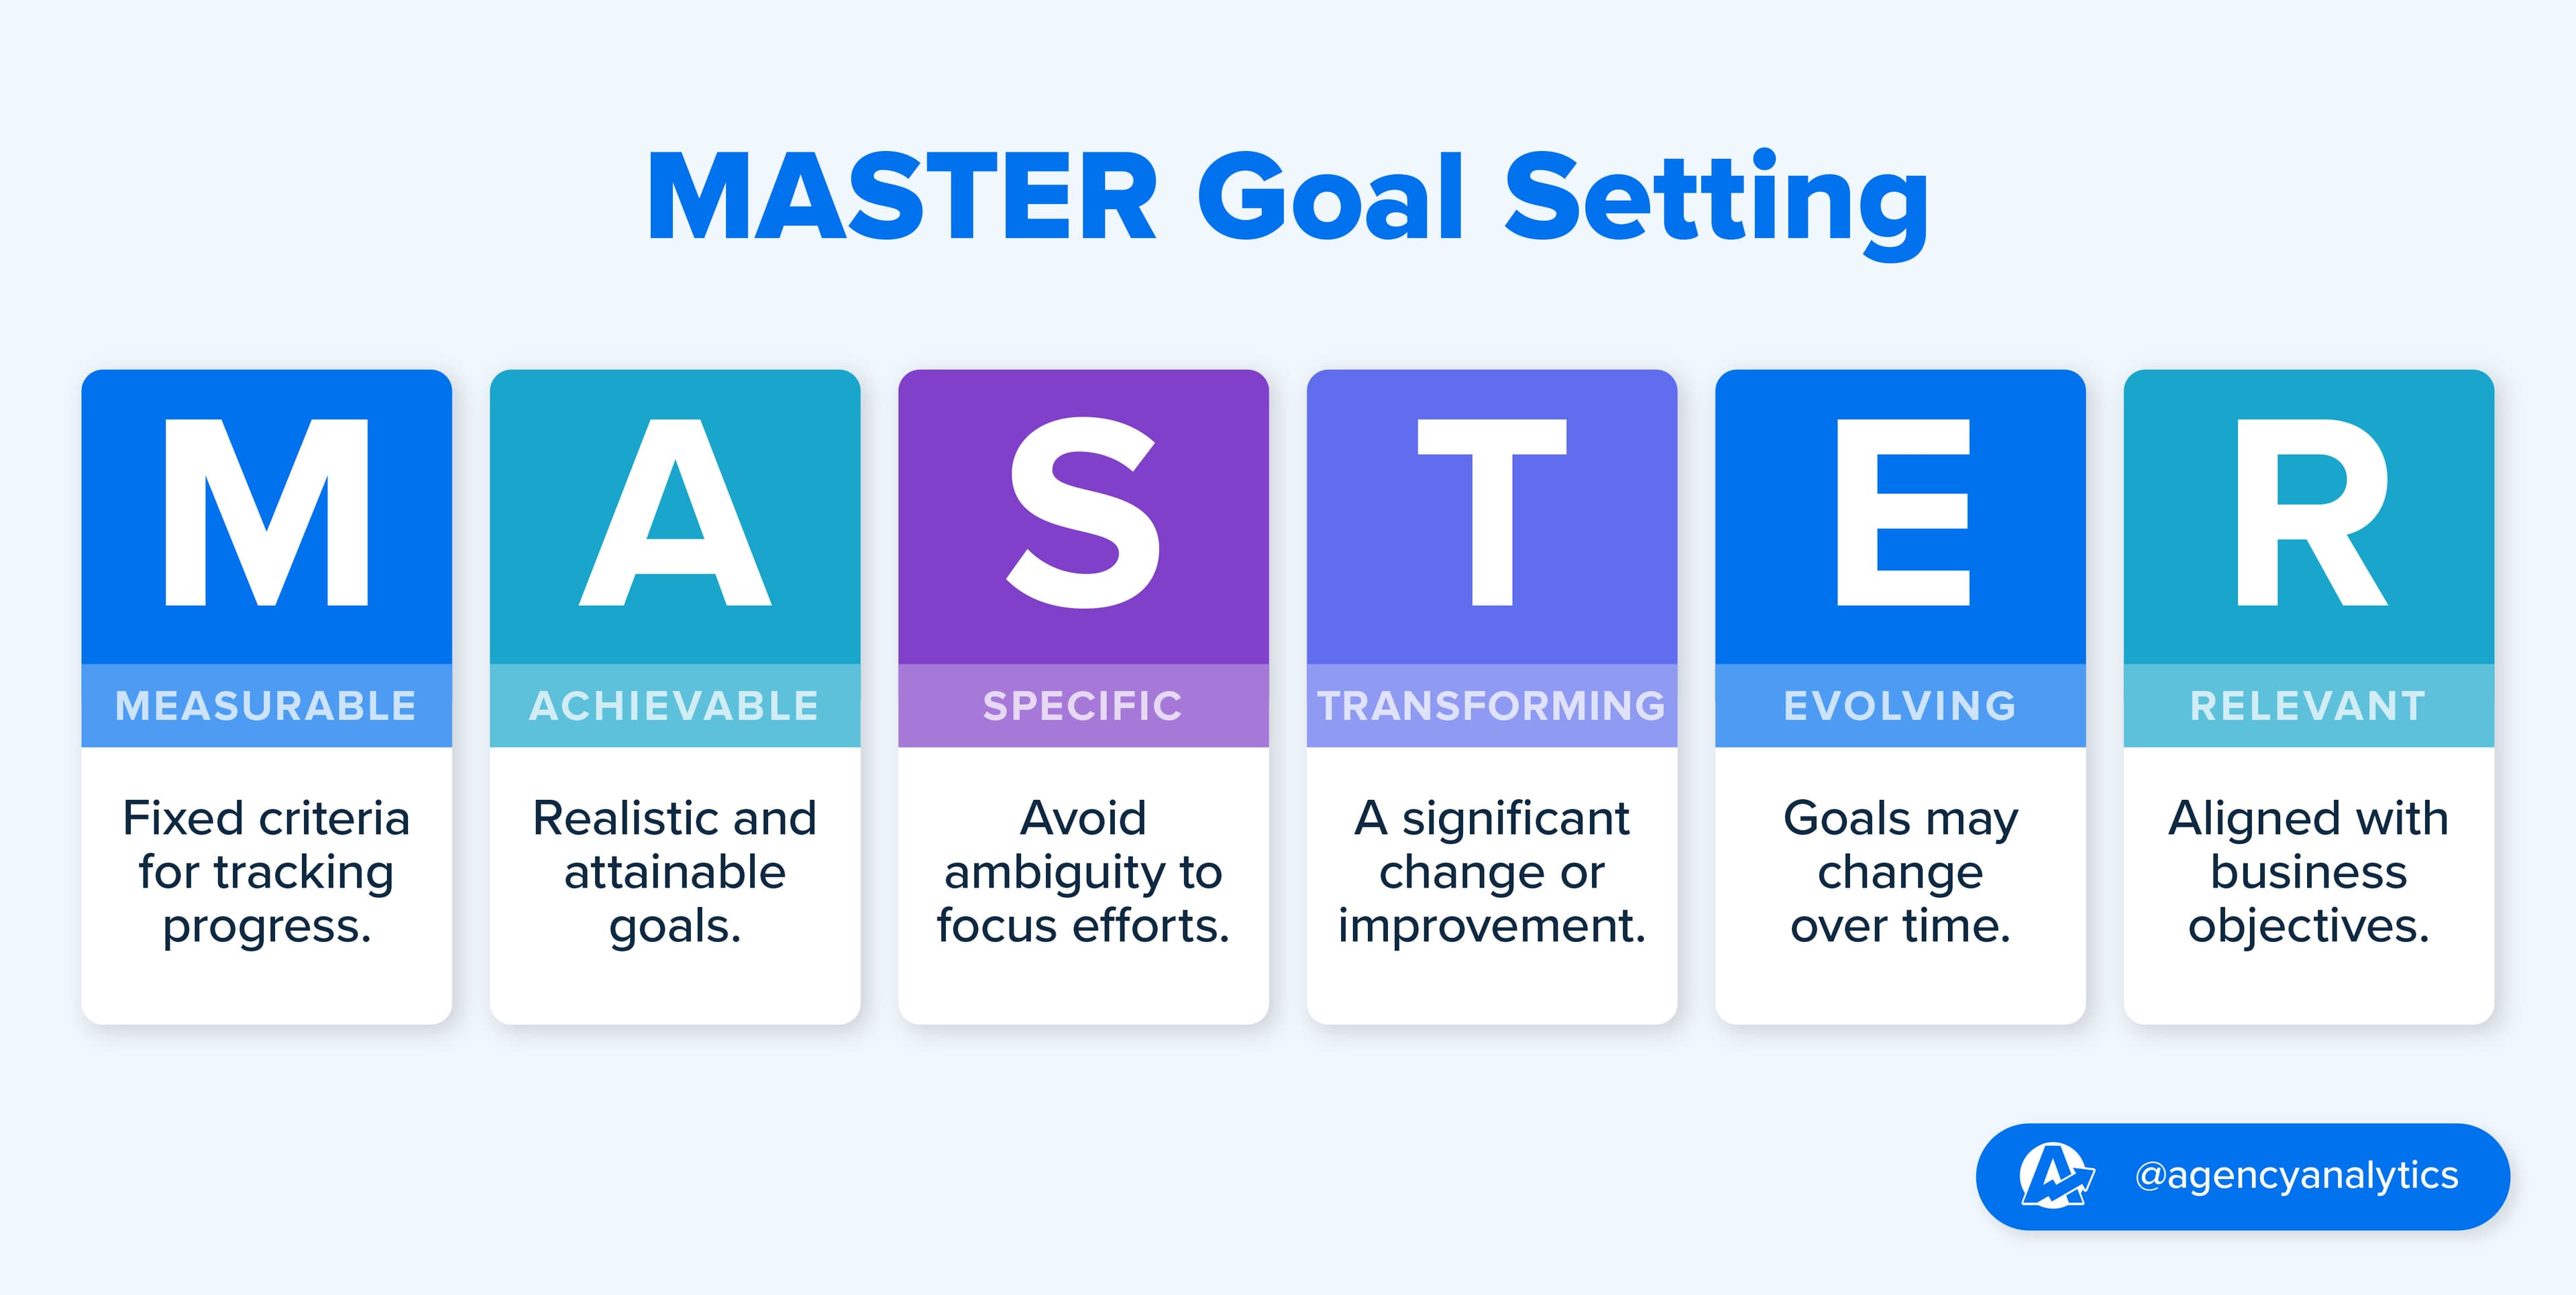
To establish goals, consider leveraging the MASTER framework:
2. Select Which Metrics to Track
Once objectives are established, your team and your client should narrow down specific metrics to quantify those goals. An informational report does more than just display data, but you'll still need some numbers to inform the analysis process!
This is also a great time to be sure your agency has access to the relevant data and will be able to track the selected metrics. If not, find ways to gain access to this essential data so that come reporting time there won't be any surprises or scrambling.
The last thing we want to do is overwhelm our clients with too many numbers, too many metrics, and that can easily happen today. If you log into really any sort of analytical tool, you're just got numbers and charts and everything kind of right in your face. It can be very challenging to kind of analyze all that stuff. We want to be very specific about what we share with the client, and that way they can truly analyze the ROI versus just looking at a bunch of numbers. So we do help coach along the way with what they should really be caring about and also what they want to see as far as results go.
Matt Sullivan, Founder & CEO, Torro Media
3. Choose Your Reporting Frequency
Some reporting is done on an ad hoc basis, but most clients prefer regular updates on progress and performance. According to the AgencyAnalytics Marketing Agency Benchmarks Survey, 58% of agencies send reports to clients monthly. Others choose to report weekly, biweekly, quarterly, or annually.
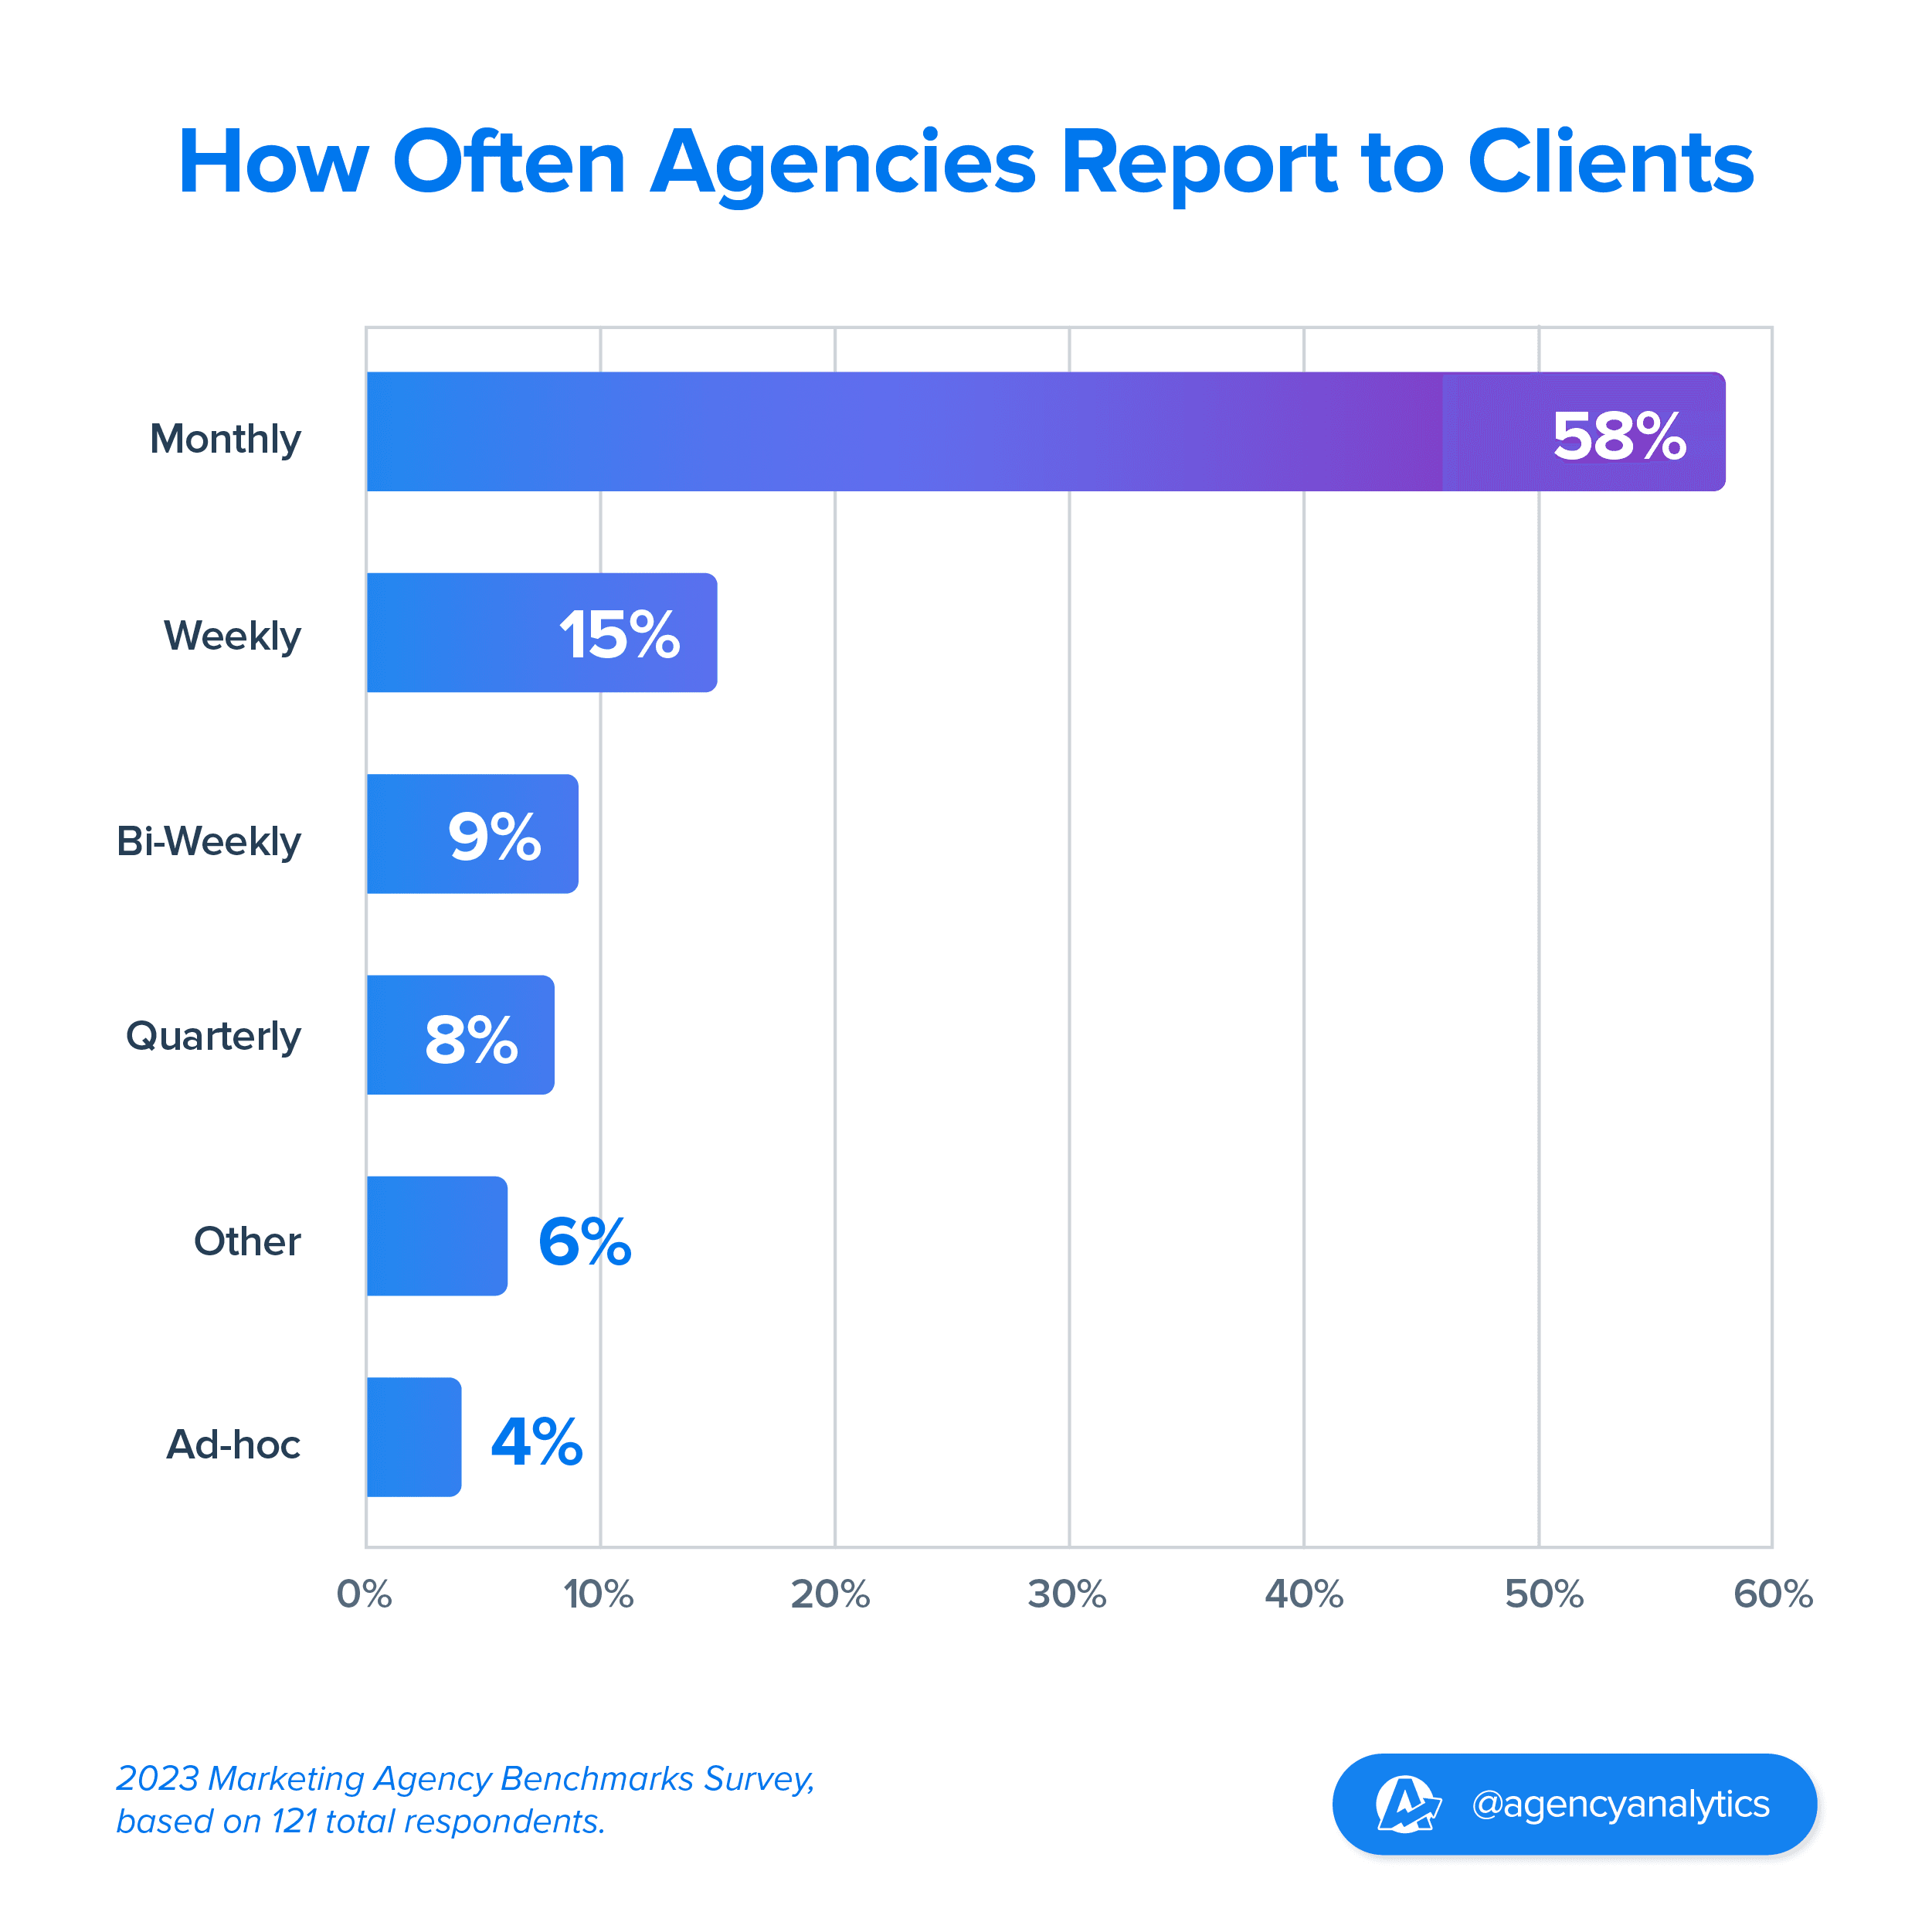
Deciding on a reporting frequency is important, because it not only helps your agency know when reports are due but also alleviates random requests from clients for up-to-date data, pronto. Dashboard-based reporting that updates on a regular schedule or in real-time is also a great option to supplement with scheduled analytical reporting.
4. Leverage a Template
A template to create analytical reports is super helpful because it not only speeds up the process but also creates consistency and ensures no important information gets missed.
This isn't to say every analysis report should be exactly the same. Rather, having defined report sections and a clear understanding of what goes into each one empowers your agency's staff to create better, more valuable analytical reports.
When you're customizing your template, you’ll want to:
Use real-time data
White label to wrap reports up in your agency's branding
Choose the type of data visualization that best serves the context
5. Decide on the Right Chart Types
There are tons of different data visualization methods, and even more data visualization tools to choose from. Coming up with set standards for which visualization techniques are best suited to certain types of data ensures every analytical business report will present data in the most effective way.
For example, a line graph works well to chart detailed spikes and drops in progress over time. A bar graph might work best to illustrate high level annual performance.
Especially if not every team member at your agency is highly skilled in data reporting and analysis, a chart type guide is a helpful asset for your team to follow.

6. Add Goals and Annotations To Provide Additional Insight
Analytical reporting requires a nuanced understanding of your client's business strategy and objectives. Tying back key metrics to their bottom line should be a given in an analysis report, and one of the best ways to do that is by referencing goals and adding annotations throughout the report.
We decided early that the only metric that matters to us, the only key performance indicator, is client revenue. I think we took a different approach with that, because typically social media agencies focus on impressions, clicks, engagement, visibility.... And what we found is that those are just preliminary data points, those aren't the ones that matter, you can't run a business based on impressions, you have to have revenue.
Michael Gasser, Co-Owner/Partner, Squeeze Marketing
This also helps pack in useful information without creating an overwhelming and messy report. These notes help break down complex information, provide updates on any changes, or celebrate ongoing success.
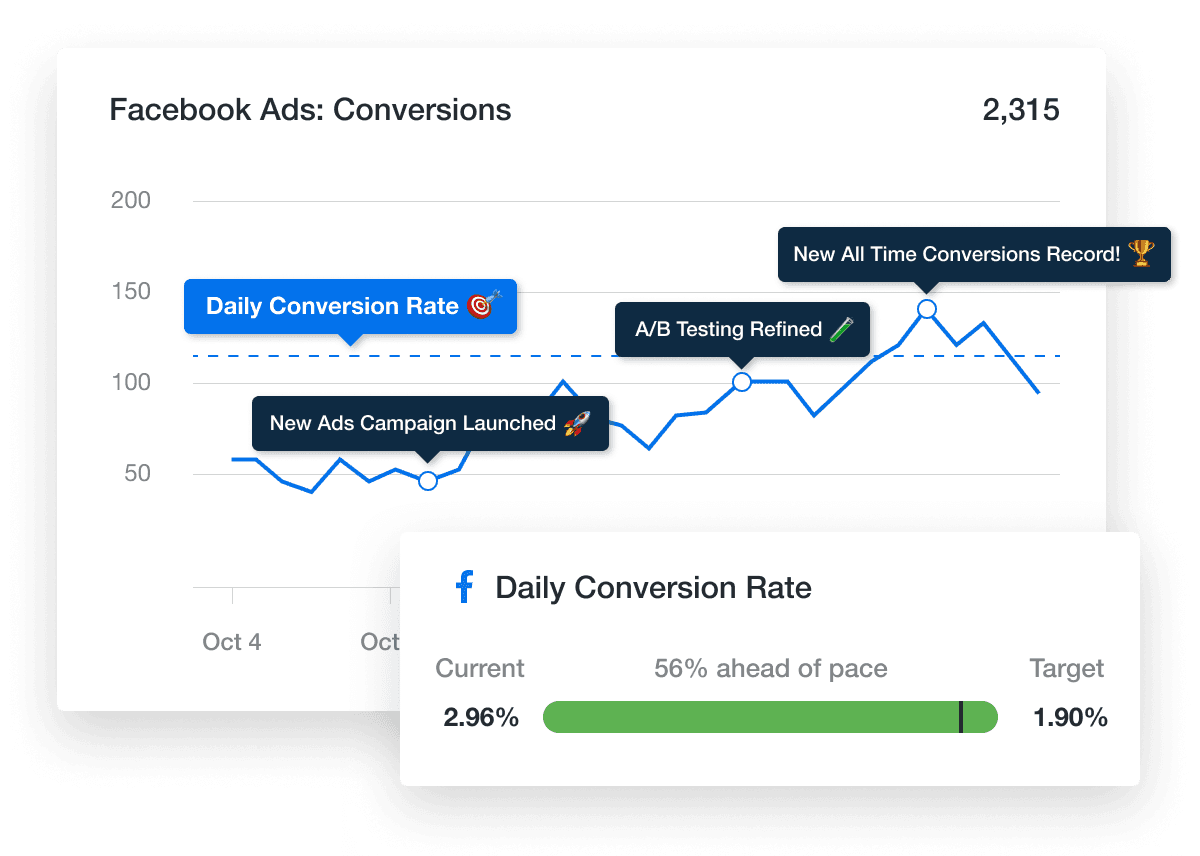
Add context and business insights to reports with the AgencyAnalytics annotations and goals feature. Try it free for 14 days.
7. Remain Agile and Make Adjustments as Needed
Remember that reporting is an iterative process. Your agency might spend time setting up digital dashboards intended to provide real-time data to your clients, but that doesn't mean reports won't also need tending to. As your client's business priorities shift and goalposts move, your agency should remain agile and responsive to ensure reports are providing the most relevant data and information.
Another thing to keep in mind is that especially with analytical reporting, the goal is to create a nuanced overview of performance outcomes. Sometimes, unexpected results will crop up and your agency may decide to include metrics that weren't initially a part of the reporting plan in order to provide valuable insights for your client. This is a good thing, and shows that your agency is paying close attention to the results you're producing.
Our clients are busy and don't understand marketing, so having key metrics they can agree have a relationship to business growth is key to making their lives easier and allows them to make good decisions quickly.
Lane Rizzardini , Co-Owner, Marion Relationship Marketing
Analytical Reports Take Client Insights to the Next Level
Analytical reporting has multiple benefits, beyond just communicating the progress of client campaigns.
If your agency is in talks with a big client that would be an incredible addition, an analytical business report might just help to win them over. Market and competitor analyses are a great way to show that your agency is passionate about getting to know each client's unique needs—and averse to one-size-fits-all solutions.
Reports are also a great tool for upsells. Michael Gasser, Co-Owner of Squeeze Marketing has shared that his agency makes a practice of not only reporting on the services they’re currently providing for their clients, but also the services that other vendors are providing those clients. This enables the client to re-evaluate whether their current partner is delivering enough value–and hopefully make the switch over to Squeeze.
Use the best practices and examples outlined in this article to inspire your team to create high-value analytical reports for your clients. To see for yourself how AgencyAnalytics supercharges your agency's reporting, try it free for 14 days!

Written by
Kyra Evans is the Manager of Content Marketing at AgencyAnalytics. She has over 15 years of experience writing content for SaaS, tech, and finance brands. Her work has been featured by HuffPost and CBC, and she serves an engaged social media readership of over 30,000 community members.
Read more posts by Kyra EvansSee how 7,000+ marketing agencies help clients win
Free 14-day trial. No credit card required.


