Table of Contents
Table of Contents
- How Often Do Agencies Send Reports?
- How Much Time Agencies Spend Creating Client Reports
- Do Agencies Charge for Client Reports?
- Which Metrics Matter Most to Clients?
- How Many KPIs Do Agencies Track for Each Client
- How Many Data Sources Do Agencies Pull For Client Reports?
- How Detailed Are Agency Client Reports?
- How Agency Teams Review Client Campaign Results
- How Do Clients Prefer To View Their Campaign Results?
- What Do Clients Like Most About Their Agency’s Reporting?
- How Often Do Clients Actually Read Their Reports?
- Building a Foundation of Trust and Transparency
7,000+ agencies have ditched manual reports. You can too.
Free 14-Day TrialWhen it comes to agency-client relationships, transparency and communication reign supreme. Client reports serve as more than just a display of outcomes; they are a testament to an agency's dedication, expertise, and keen grasp of client aspirations.
Yet, the final report is but the tip of the iceberg. What processes, decisions, and strategies lie beneath its creation? And when it reaches the client, how does it influence their perception and actions? That's exactly what this part explores.
And if you're interested in how these trends materialized over time, explore the latest 2025 Marketing Agency Benchmarks Report.
2023 Agency Participant Breakdown
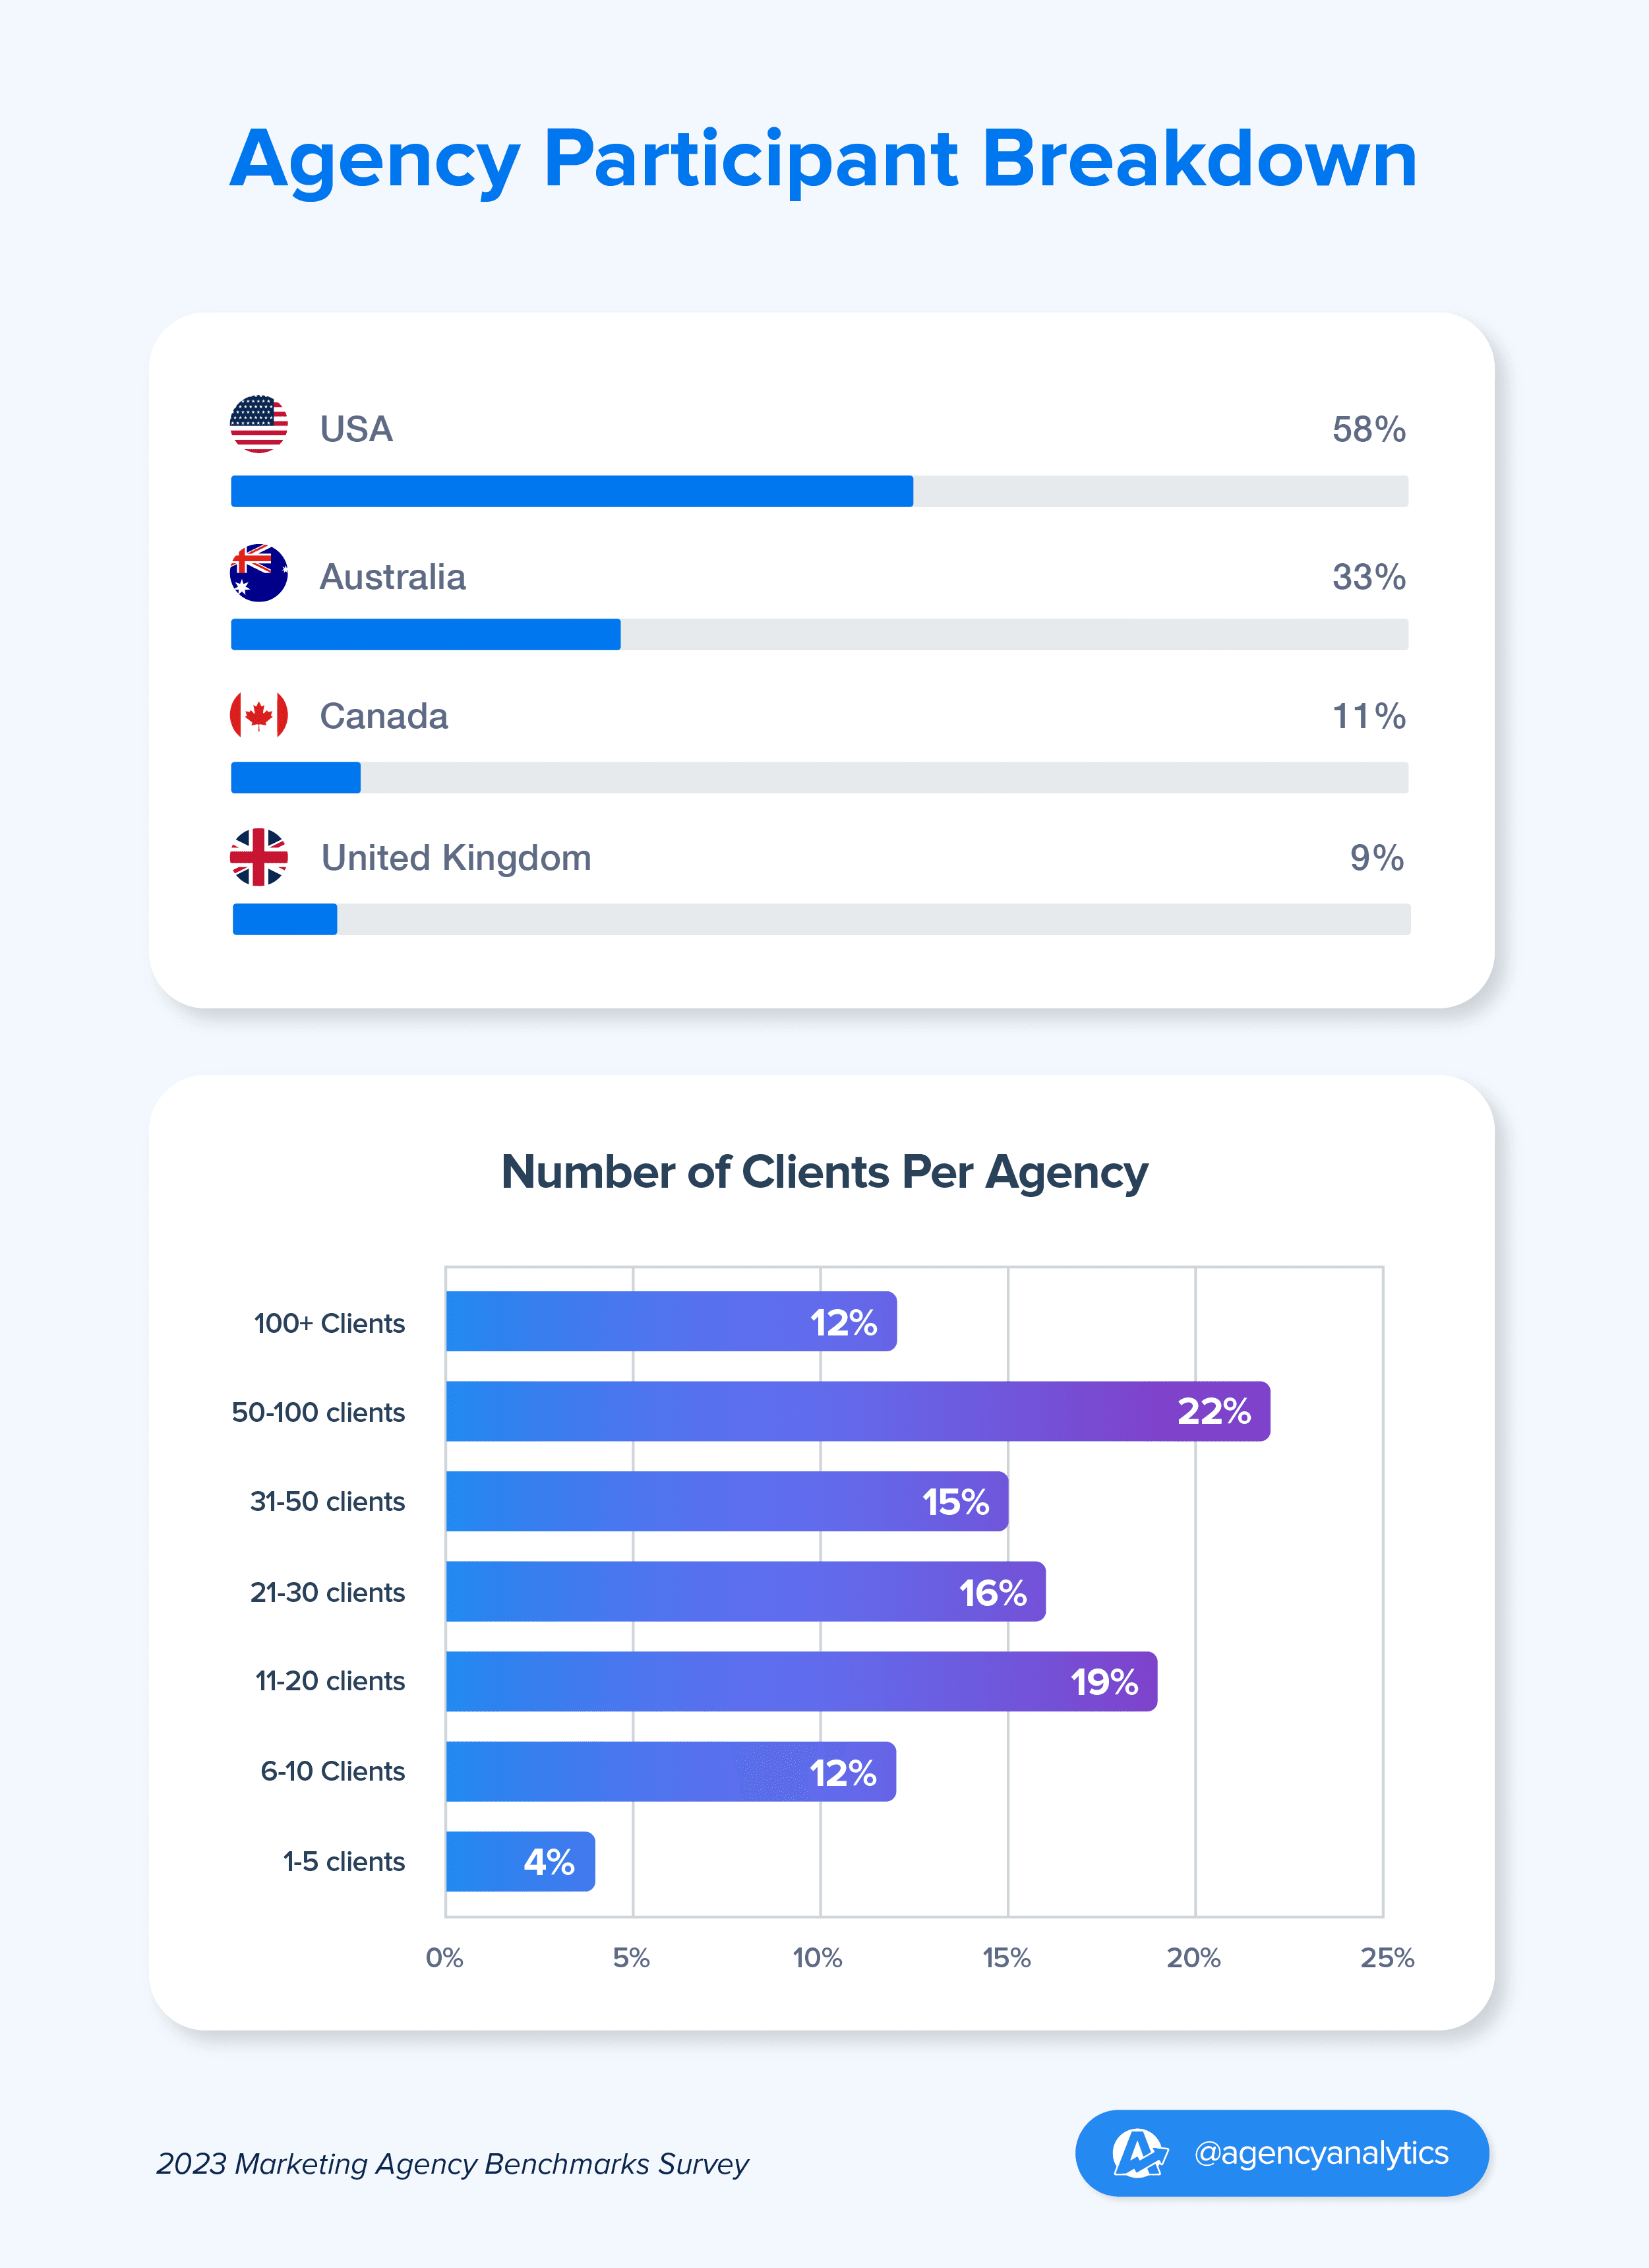
Out of 121 agencies surveyed in the 2023 Agency Benchmarks Survey are primarily located in the US (58%), Australia (33%), Canada (11%), and the United Kingdom (9%).
Meanwhile, 46% of agencies surveyed have 6-20 full-time employees, and 22% serve 50-100 clients.
Let’s dive into Part Four of the Agency Benchmarks Report as we unravel the nuances of client reporting.
How Often Do Agencies Send Reports?
To kick things off, let’s gain insights into the frequency of client reporting. To truly understand the cost of client reporting, we need first to understand how often they’re sent, and how long they take.
This report will provide you with all this information and more to benchmark against. Let’s get started!
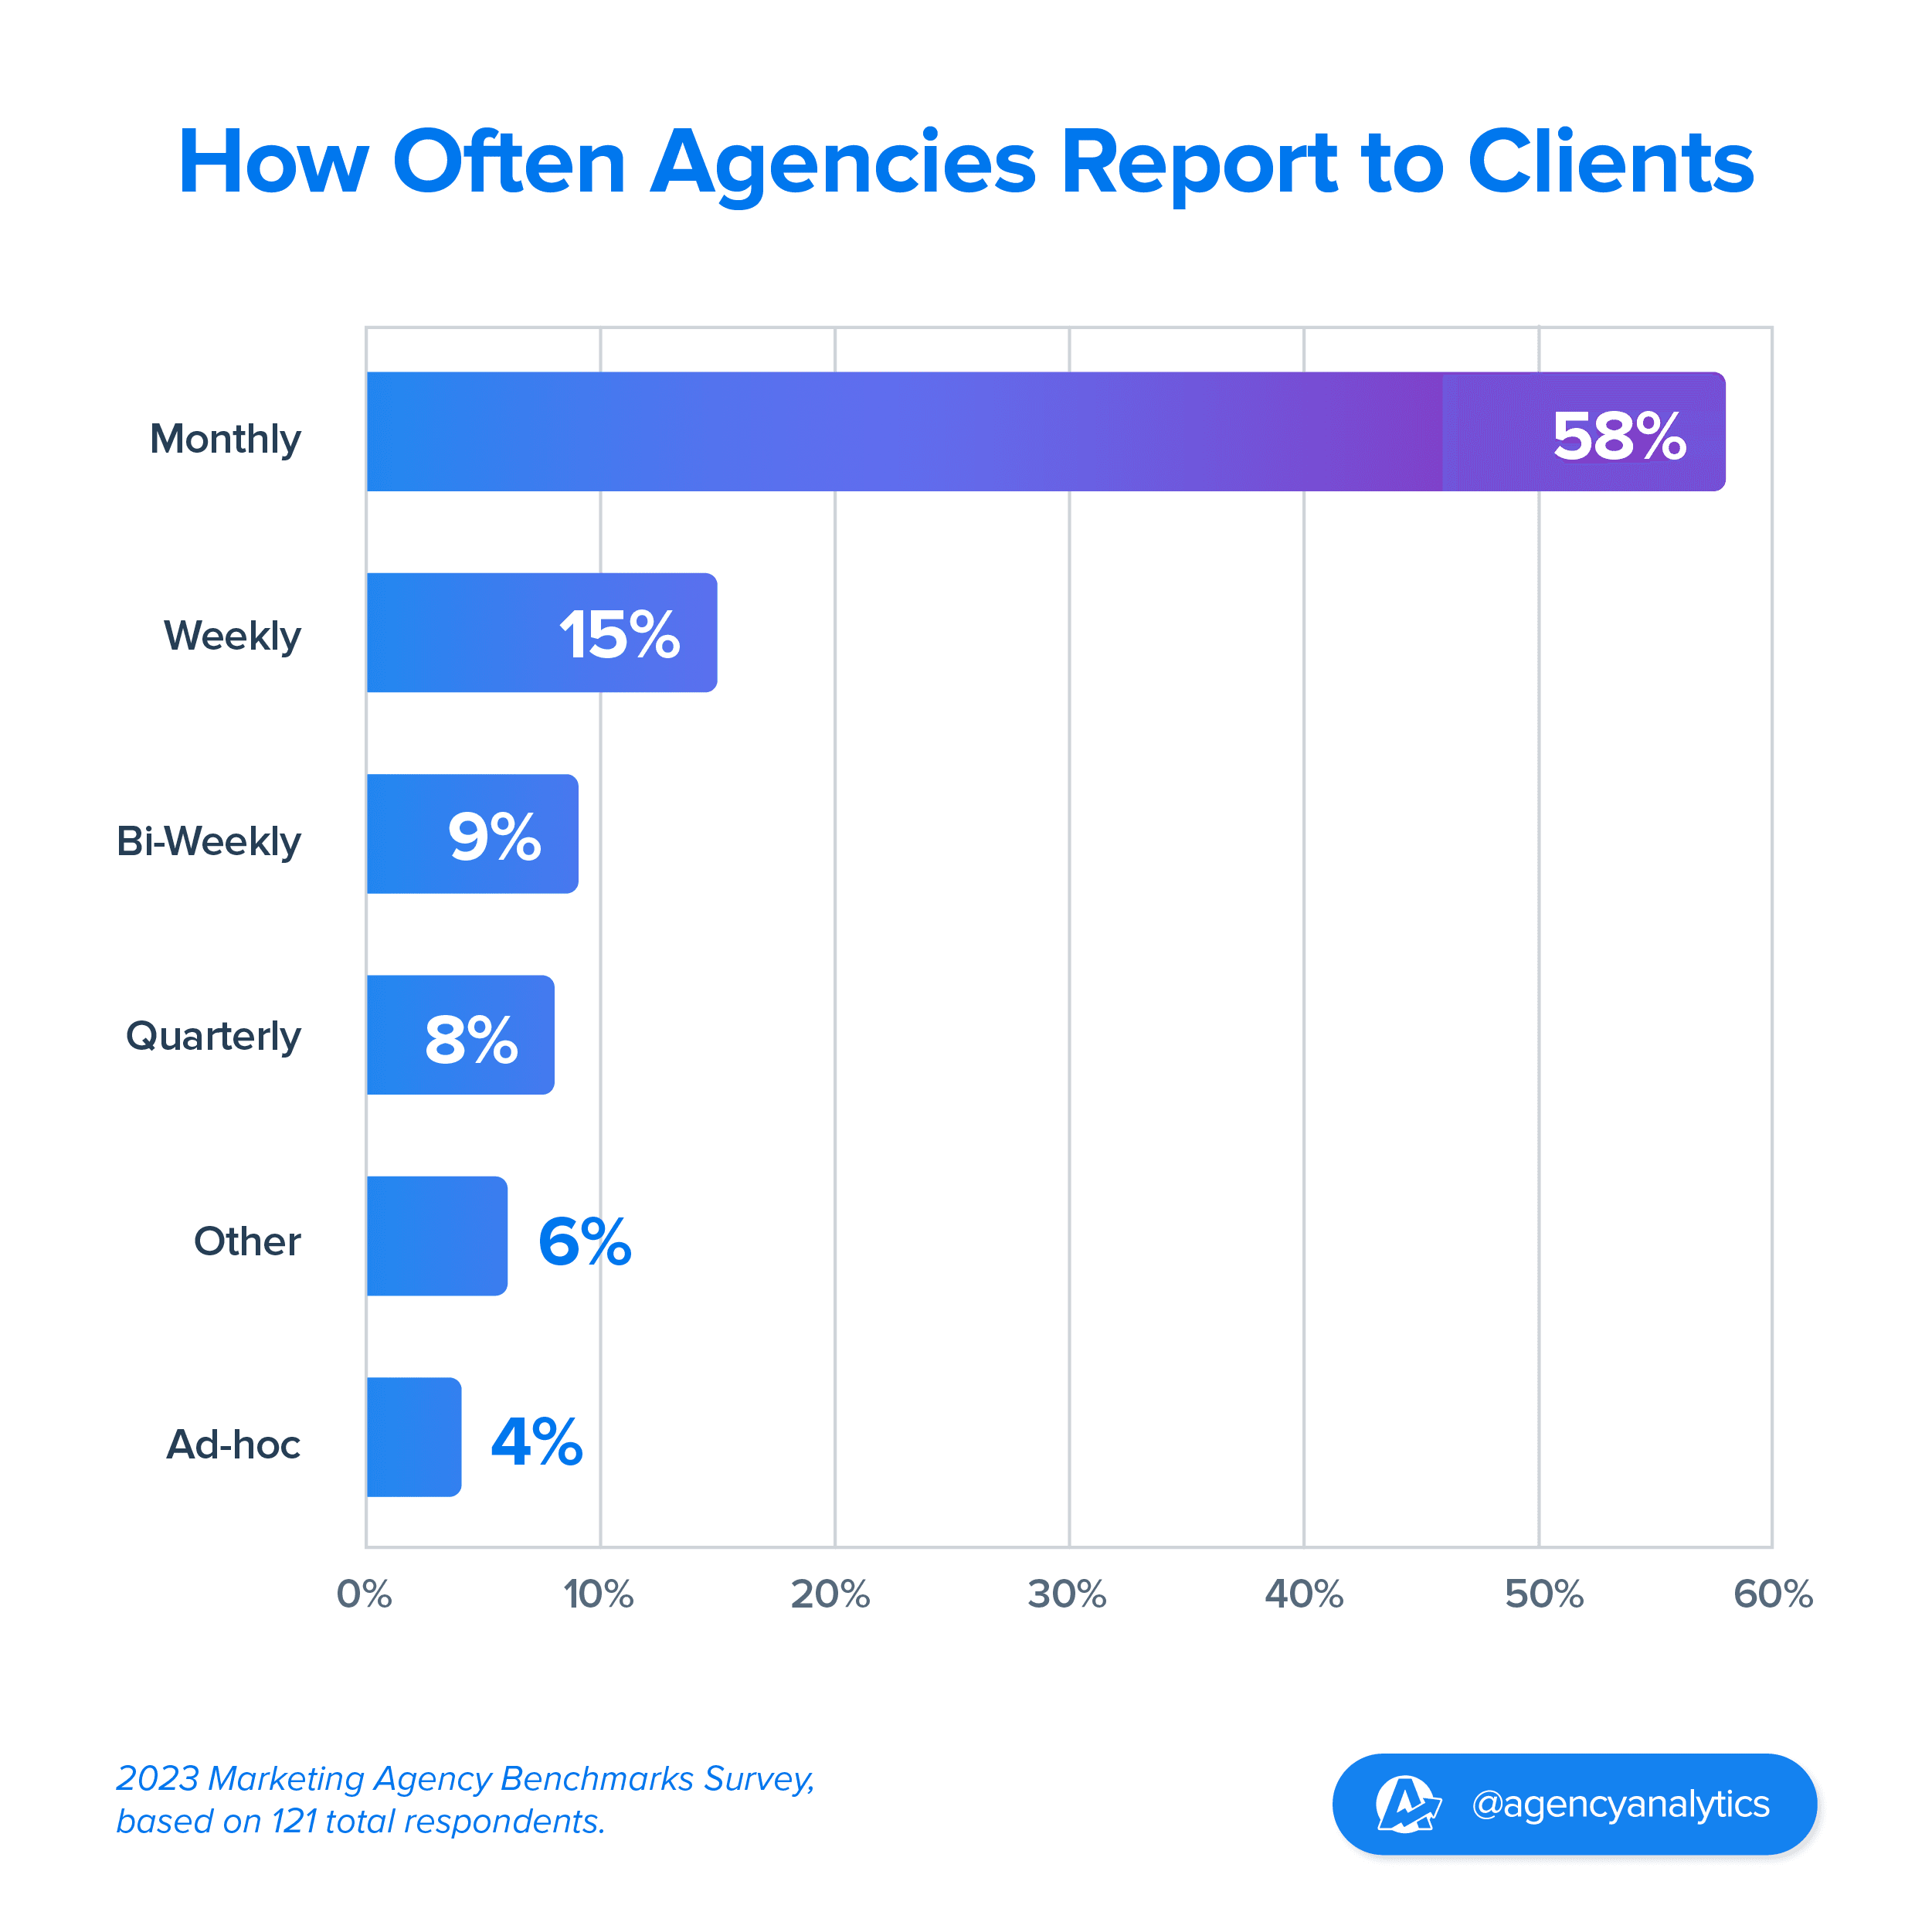
The data paints a clear picture of the popularity of monthly reports:
Monthly Reports: 58% of agencies surveyed send out reports every month, ensuring clients stay in the loop
Weekly Check-ins: Coming in second, 15% of agencies send out reports on a weekly basis
Bi-Weekly Reports: Another 9% of agencies distribute reports twice a week
Quarterly Check-Ins: 8% of agencies provide reports on a quarterly basis
The remaining agencies surveyed report to clients with the following frequency:
4% on an ad-hoc basis
4% annually
1% daily
1% never send out any reports
While there's a clear trend favoring monthly reports, successful agency-client partnerships can flourish with varied reporting frequencies. The key is finding the cadence that aligns best with client expectations and campaign objectives.
For instance, agencies that opt for ad-hoc reporting tailor their reporting frequency and often mold their report timings to each client's distinct needs, giving them a competitive advantage against other agencies.
However, this could also be influenced by the communication style of the agency! Maybe they're the type to reach out only when there's a notable shift in campaign metrics or when there's a tangible insight to share–like tipping off an eCommerce client about trending products, ensuring they're well-stocked for the season's demands.
💡 According to the Client Reporting Benchmarks report, which analyzed data from 3.8M active reports, 143.5K campaigns, and 7,000 agencies, it's evident that Premier-level agencies issue nearly five times as many reports as their mid-sized counterparts.

58% of agencies send clients reports once a month, providing a consistent touchpoint that clients can rely on, fostering trust and a sense of partnership.
It’s likely that monthly reporting is a sweet spot for so many agencies because it’s frequent enough to keep clients engaged and informed without overwhelming or confusing them with too many correspondences.
Sending monthly reports not only helps provide clients with an overview of what was achieved and the progress made within a month but also gives campaigns time to set up and normalize. Although it is nice to check in on a campaign weekly, sometimes it is better to get a macro perspective of how the campaign went in order to determine its success.
Ariene Dionela, Digital Media Account Director at Connections Marketing
The predictability of a monthly update ensures that clients remain connected to their campaign's progress, even amidst their busy schedules. For agencies, this regularity not only showcases their commitment to transparency but also serves as an opportunity to address concerns, recalibrate strategies, and celebrate successes.
💡 The best time to send a client Report is between 9:00 - 9:30 AM on a Tuesday or Thursday (Source: Client Reporting Benchmarks report).
Given its widespread adoption, agencies would do well to prioritize monthly reporting, fine-tuning their approach to deliver meaningful insights that truly resonate with their clients' aspirations and business objectives.
How Much Time Agencies Spend Creating Client Reports
As we’ve illustrated, crafting client reports is an integral part of an agency's routine–but it shouldn't turn into a dreaded time-sucking recurring task. By understanding the time investment, agencies can gauge their own efficiencies, ensuring better resource allocation and tech stack updates.
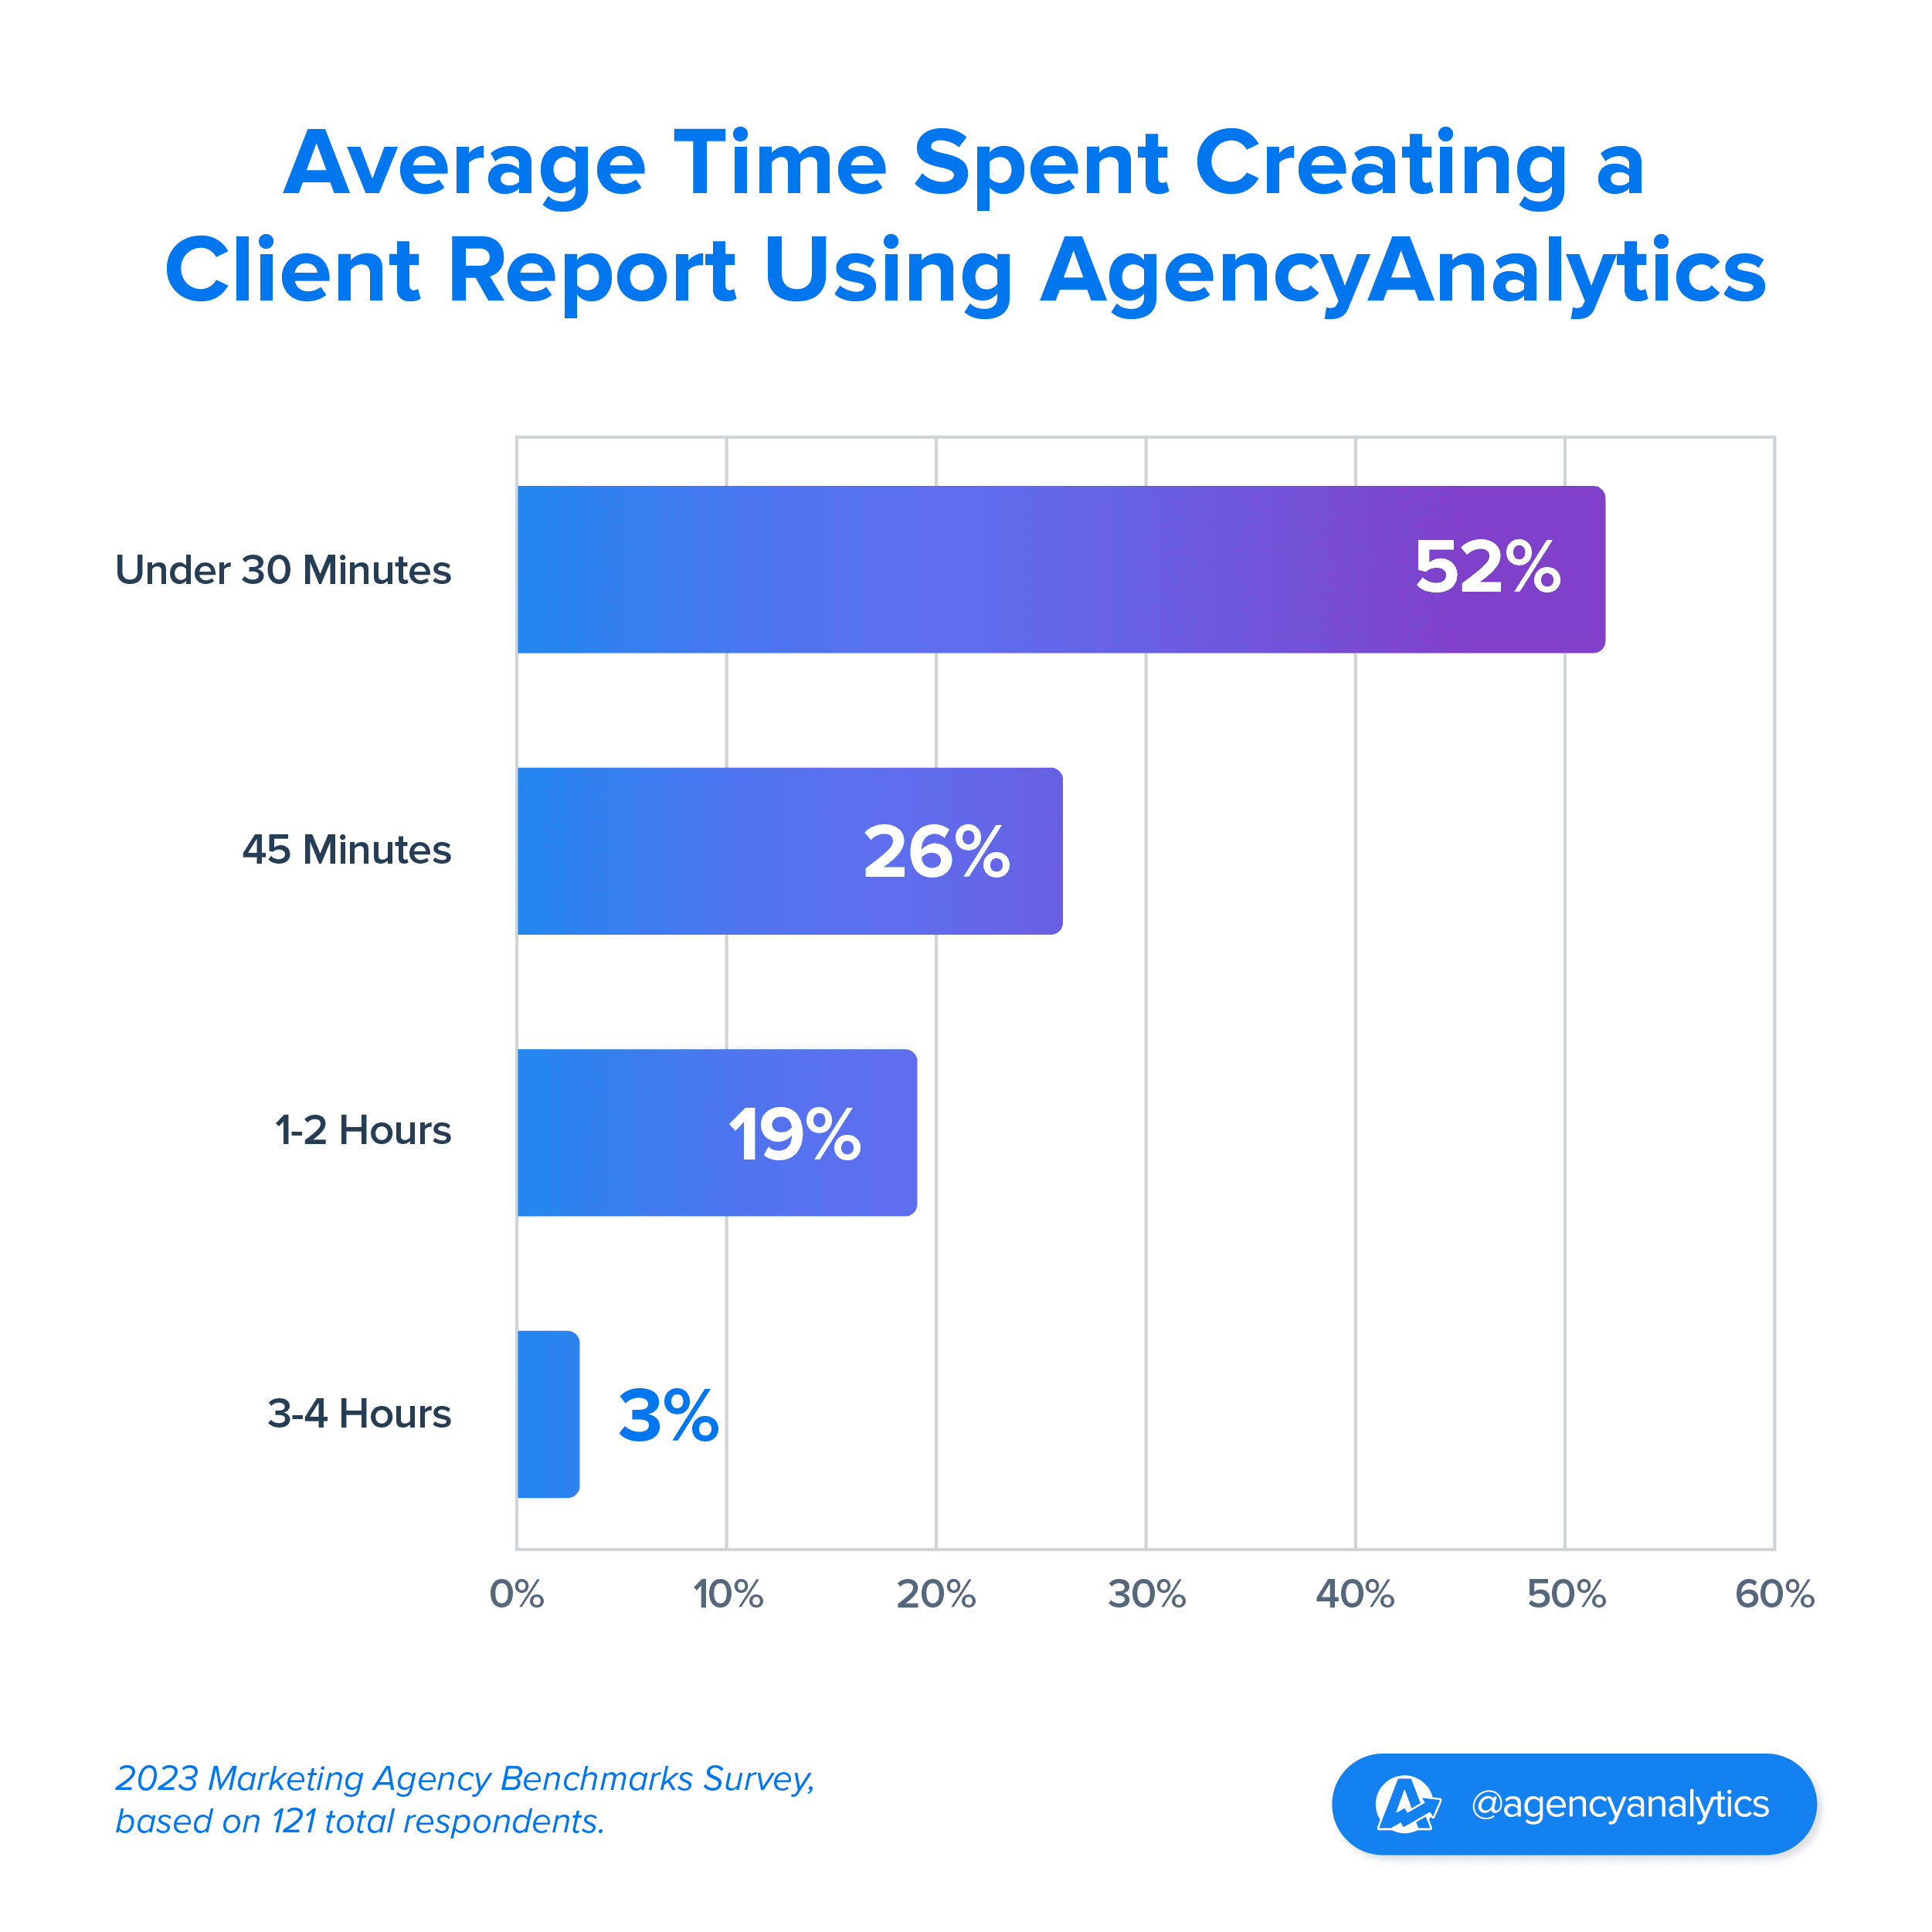
It turns out that if your team is dedicating over an hour to produce just one report, it's time to reassess the process.
Of the AgencyAnalytics customers surveyed:
52% of agencies report spending less than 30 minutes on client reporting
26% of agencies spend about 45 minutes creating a single report
19% of marketing agencies spend 1-2 hours on a client report
Only 3% spend 3-4 hours creating a client report

The data underscores a remarkable efficiency gain: 78% of agencies spend 45 minutes or less on client reporting with AgencyAnalytics. Before transitioning to this automated platform, many agencies faced manual reporting times spanning 2.5 to 5 hours per report. The shift isn't just about speed—it's a game-changer.
Gathering disparate data and presenting it seamlessly is necessary for showcasing marketing efforts. But the true magic happens when agencies layer on their strategic insights atop automated data. Market-leading agencies also leverage reporting templates along with the data consolidation and presentation capabilities of robust tools like AgencyAnalytics to bring it all together.
Do Agencies Charge for Client Reports?
At the heart of an agency's operations are its business model and revenue streams, both of which significantly influence its decision on whether or not to charge for client reports.
This isn't just about the direct implications to your agency margins, but also about positioning, perceived value, and establishing a sustainable client relationship.
Knowing how competitors navigate this terrain is invaluable. It can inform and even reshape an agency's own pricing strategy, determining if client reporting becomes a complimentary service, a premium offering, or a blend of the two.
When agencies make the choice to bill for their reports, it communicates the value of the deep analysis, insights, and expertise that goes into each one. Conversely, including it as part of the package might be seen as a gesture of good faith, a commitment to transparent communication without any additional costs.
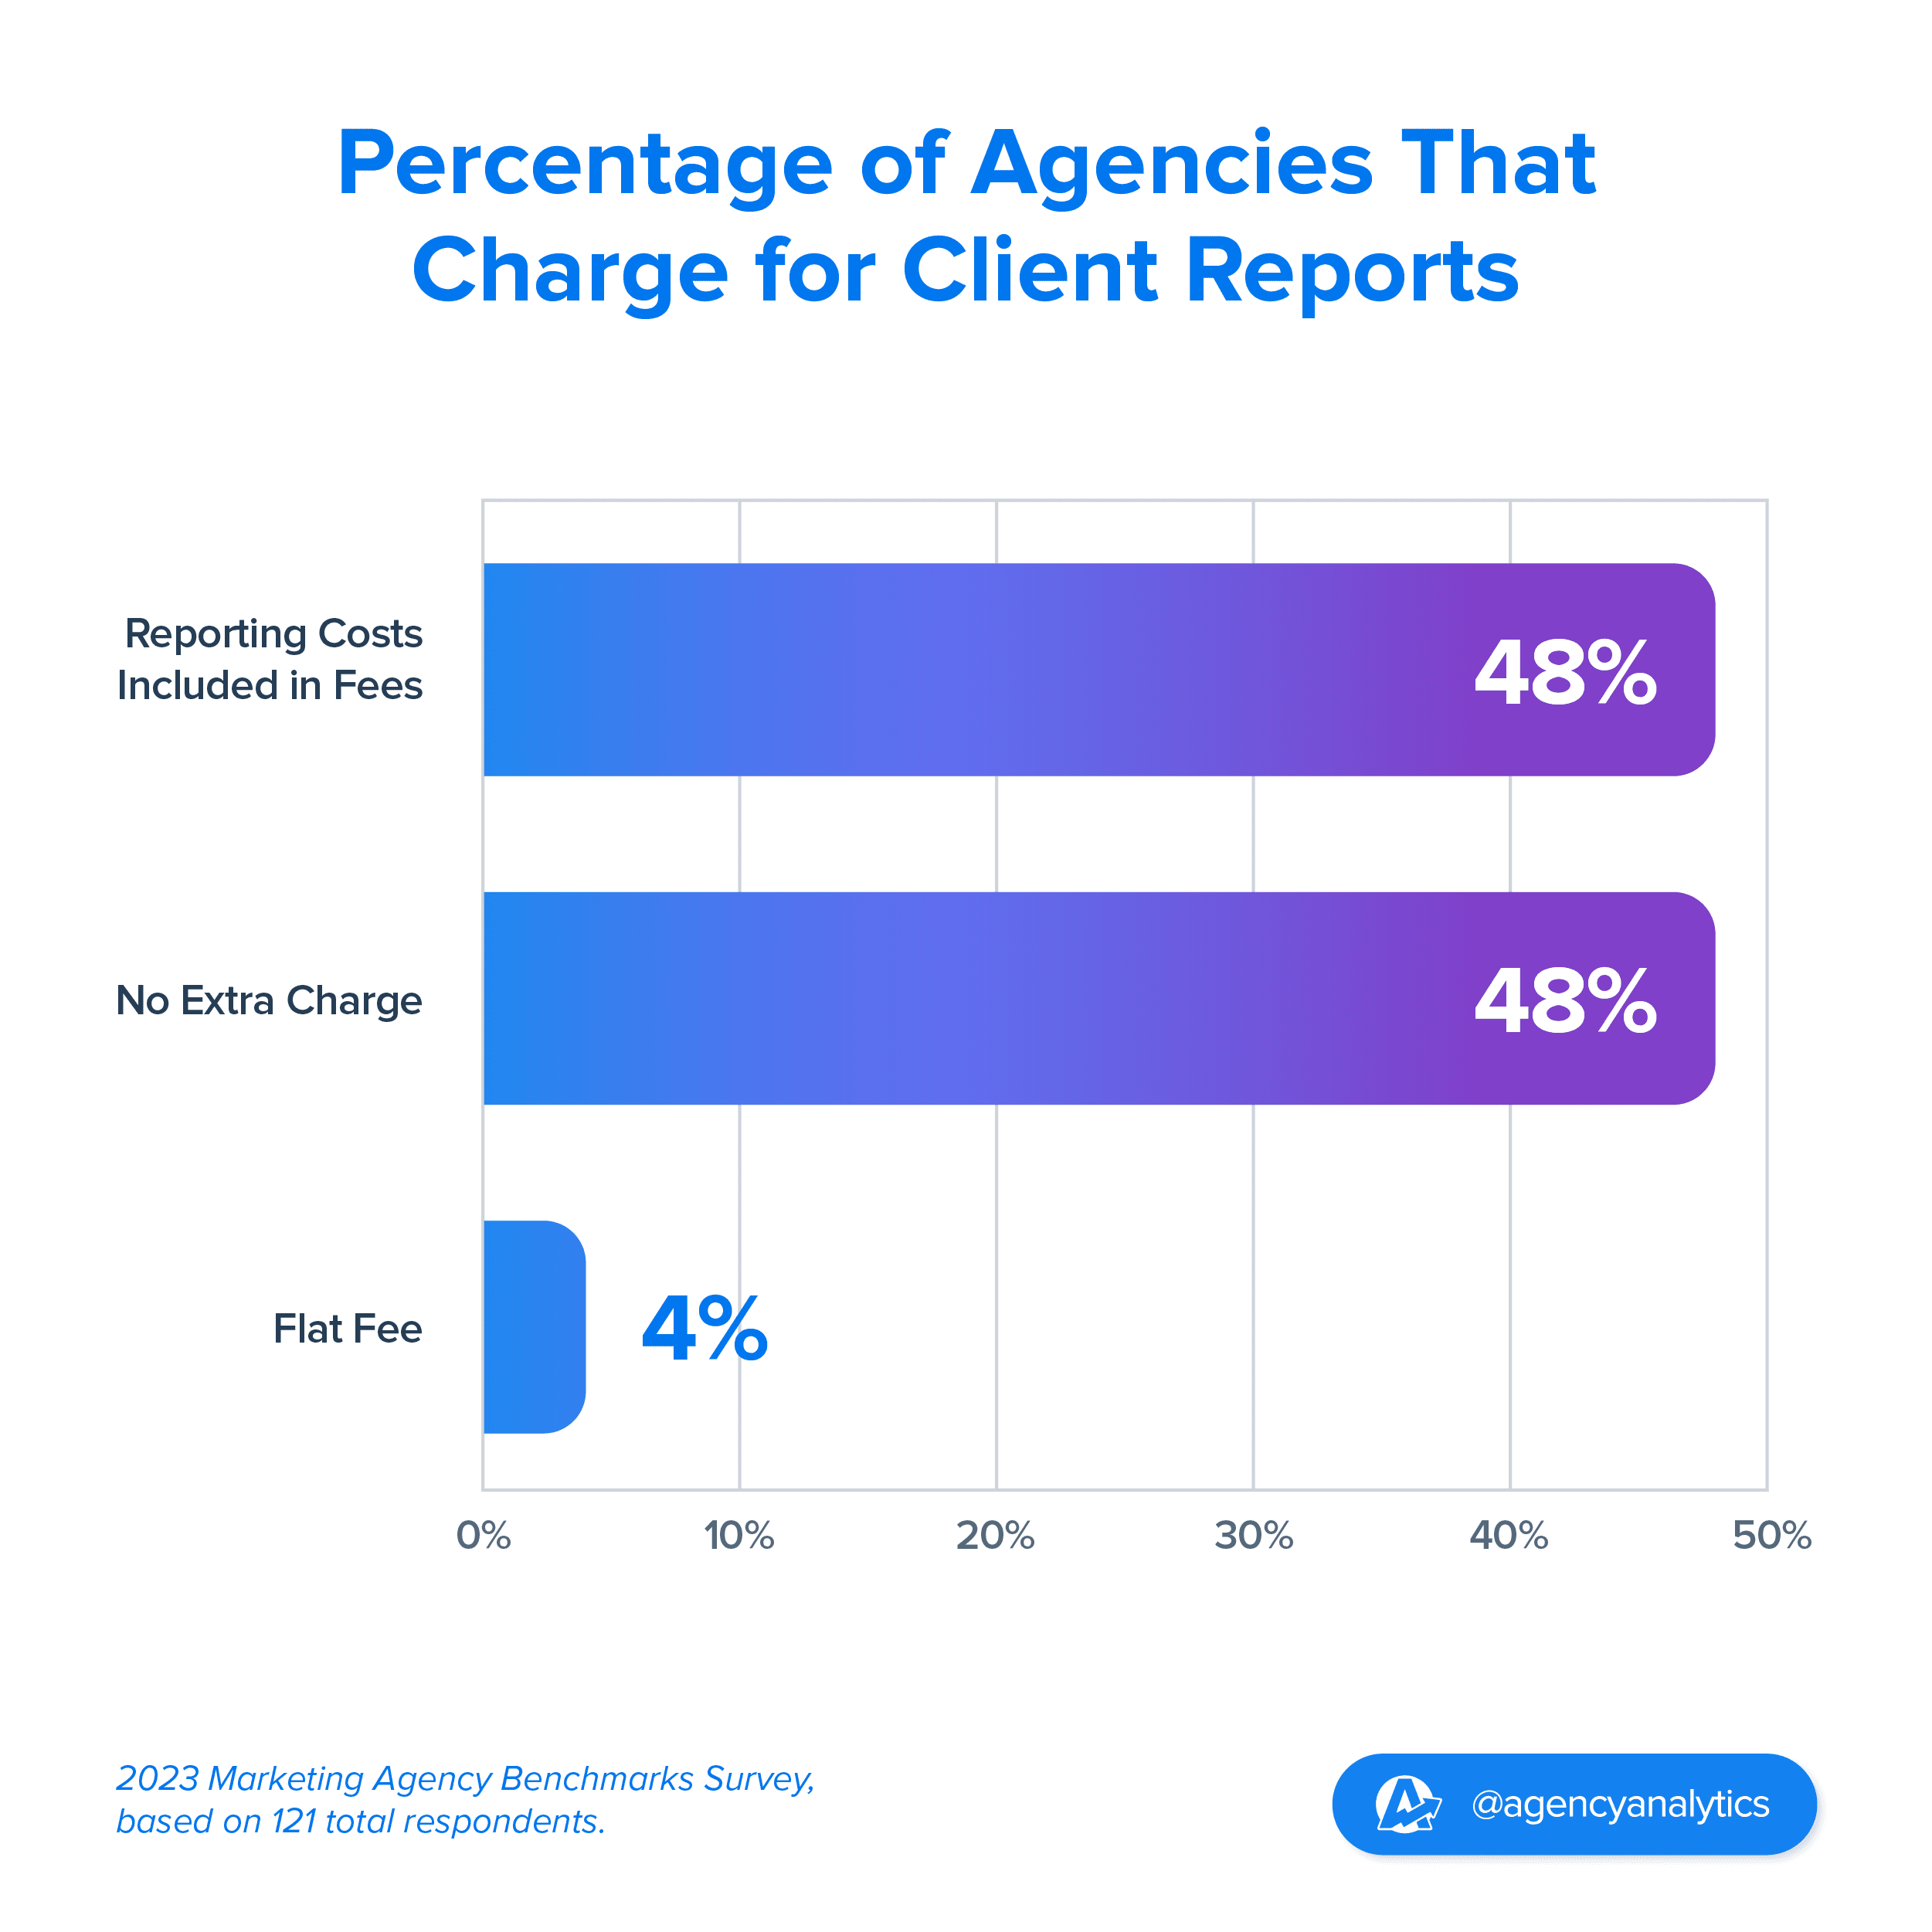
Interestingly, a significant 48% of agencies opt not to charge extra for their reports. This approach emphasizes that these reports are not just an add-on service but a testament to the ROI they deliver to their clients. It's a way of saying, 'Our work speaks for itself, and here's the proof.’
Here’s the breakdown of what agencies had to say:
48% of agencies said they do not charge anything extra for client reports
Another 48% of agencies said that reporting costs are included in agency fees
Only 4% said they charge a flat fee per report

Looking at the data, the vast majority of agencies (96%) do not charge their clients separately for reporting. They either absorb the cost of reporting or include it as part of their overall agency fees. This suggests that for most agencies, reporting is seen as an integral part of their service offering rather than an additional or optional service.
Such a trend could stem from the belief that transparent communication and regular updates on campaign performance are foundational to building and maintaining trust with clients.
Our clients appreciate the transparency and consistent communication so they know what they're getting for their money. It helps them feel confident.
Lane Anderson, Founder & CEO, London Road Marketing
By incorporating reporting within their standard pricing, these agencies emphasize its importance and potentially enhance the perceived value of their service package.
Which Metrics Matter Most to Clients?
For agencies, understanding client priorities goes beyond delivering a service–it's about forging a meaningful business partnership. As we’ve explored, a key aspect of this partnership is recognizing the metrics that clients value most and aligning marketing efforts with business objectives to drive meaningful outcomes and enhance customer retention.
So, which marketing metrics tend to be most relevant to clients?
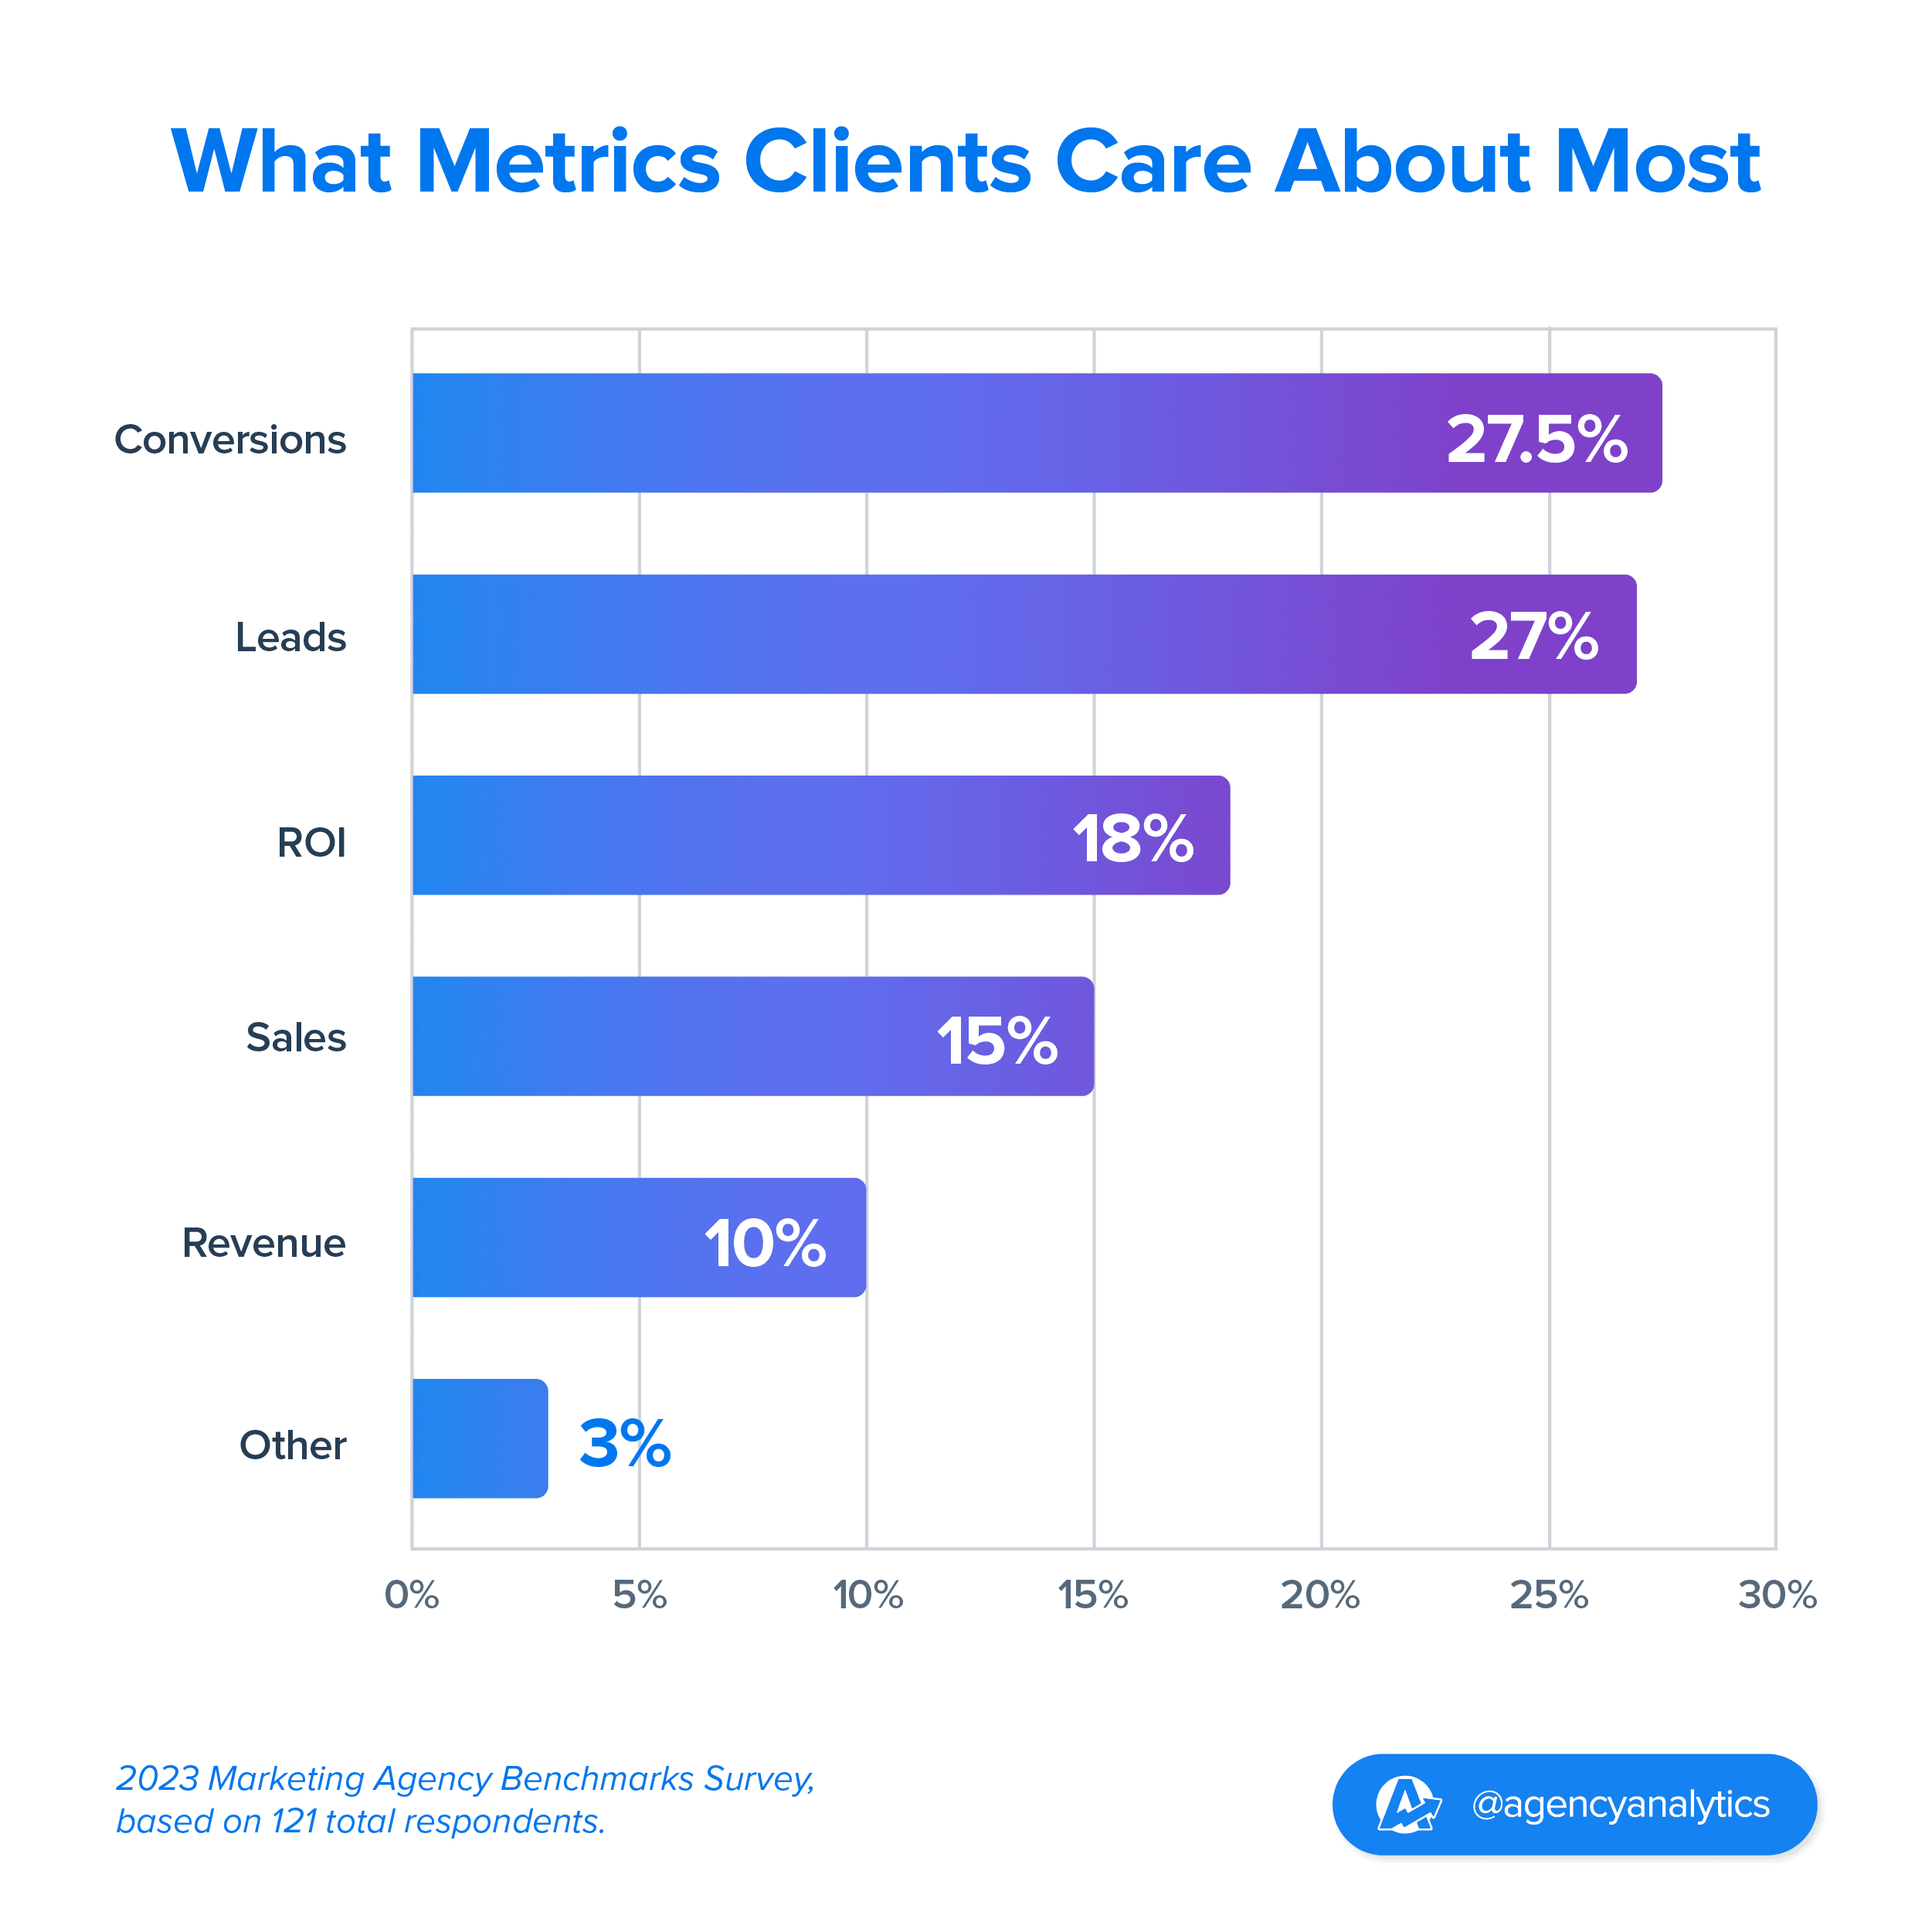
The survey results show the following metrics–most of which have a direct impact on their bottom line–matter most to clients:
27.5% of agencies say clients care most about Conversions
27% of agencies say clients prioritize Leads
18% of marketing agency clients care most about ROI
15% of agencies report Sales as being the most important metric for clients
10% of agencies say Revenue is the top metric to track
Another 3% mark other metrics as most important for clients, ranging from Rankings to Followers, Traffic, and Social Engagement.
We sell SEO and PPC Services, but our clients don't care about how they work, they care about calls and their bottom line. I can show them beautiful numbers, traffic patterns, increases in rankings, etc. But at the end of the day, they're paying us for a service to increase their revenue.
Ruben Roel, President, Investigator Marketing
Looking at this data, it's evident that the later stages of the buyer's journey are of utmost importance for agency clients. Conversions and leads are both indicators of how effectively a marketing strategy is drawing potential customers and sparking interest.

Together, conversions and leads account for over half of the client priorities, showing that the sales funnel is vital for many businesses.
Aligning marketing efforts with your clients’ sales teams becomes crucial here. The emphasis on conversions and leads underscores the importance of not just attracting potential customers but doing so in a way that aligns with your clients’ sales objectives, ensuring these prospects are well-positioned to turn into real customers.

18% of clients mark ROI as their top concern. This highlights the importance of not just spending marketing dollars but ensuring they yield profitable results by offering a clear perspective on the effectiveness of marketing campaigns.
However, for long-term strategies like Social Media Management or SEO, demonstrating immediate ROI can be challenging without the right kind of reporting.

Sales and revenue are closely intertwined metrics in the eyes of clients. In fact, 15% of agencies indicate that their clients view sales as the paramount metric, while 10% highlight revenue.
Together, these metrics account for 25% of client priorities, underscoring a significant segment of clients who prioritize tangible financial outcomes over funnel engagement.
Given this emphasis on financial results, the role of integrative tools that pull comprehensive data from multiple sources (like AgencyAnalytics’ 80 marketing integrations) becomes crucial for agencies to paint the picture from diverse channels, processes and campaigns, and attribute specific dollar values to marketing activities.
Read More: Track Progress Against Key Objectives With Custom Goals
How Many KPIs Do Agencies Track for Each Client
With the myriad of data points available from numerous platforms and tools, are agencies juggling a staggering number of KPIs for each client? In reality, you’ll see them focusing on a more distilled set of key metrics that communicate progress and align with client goals.
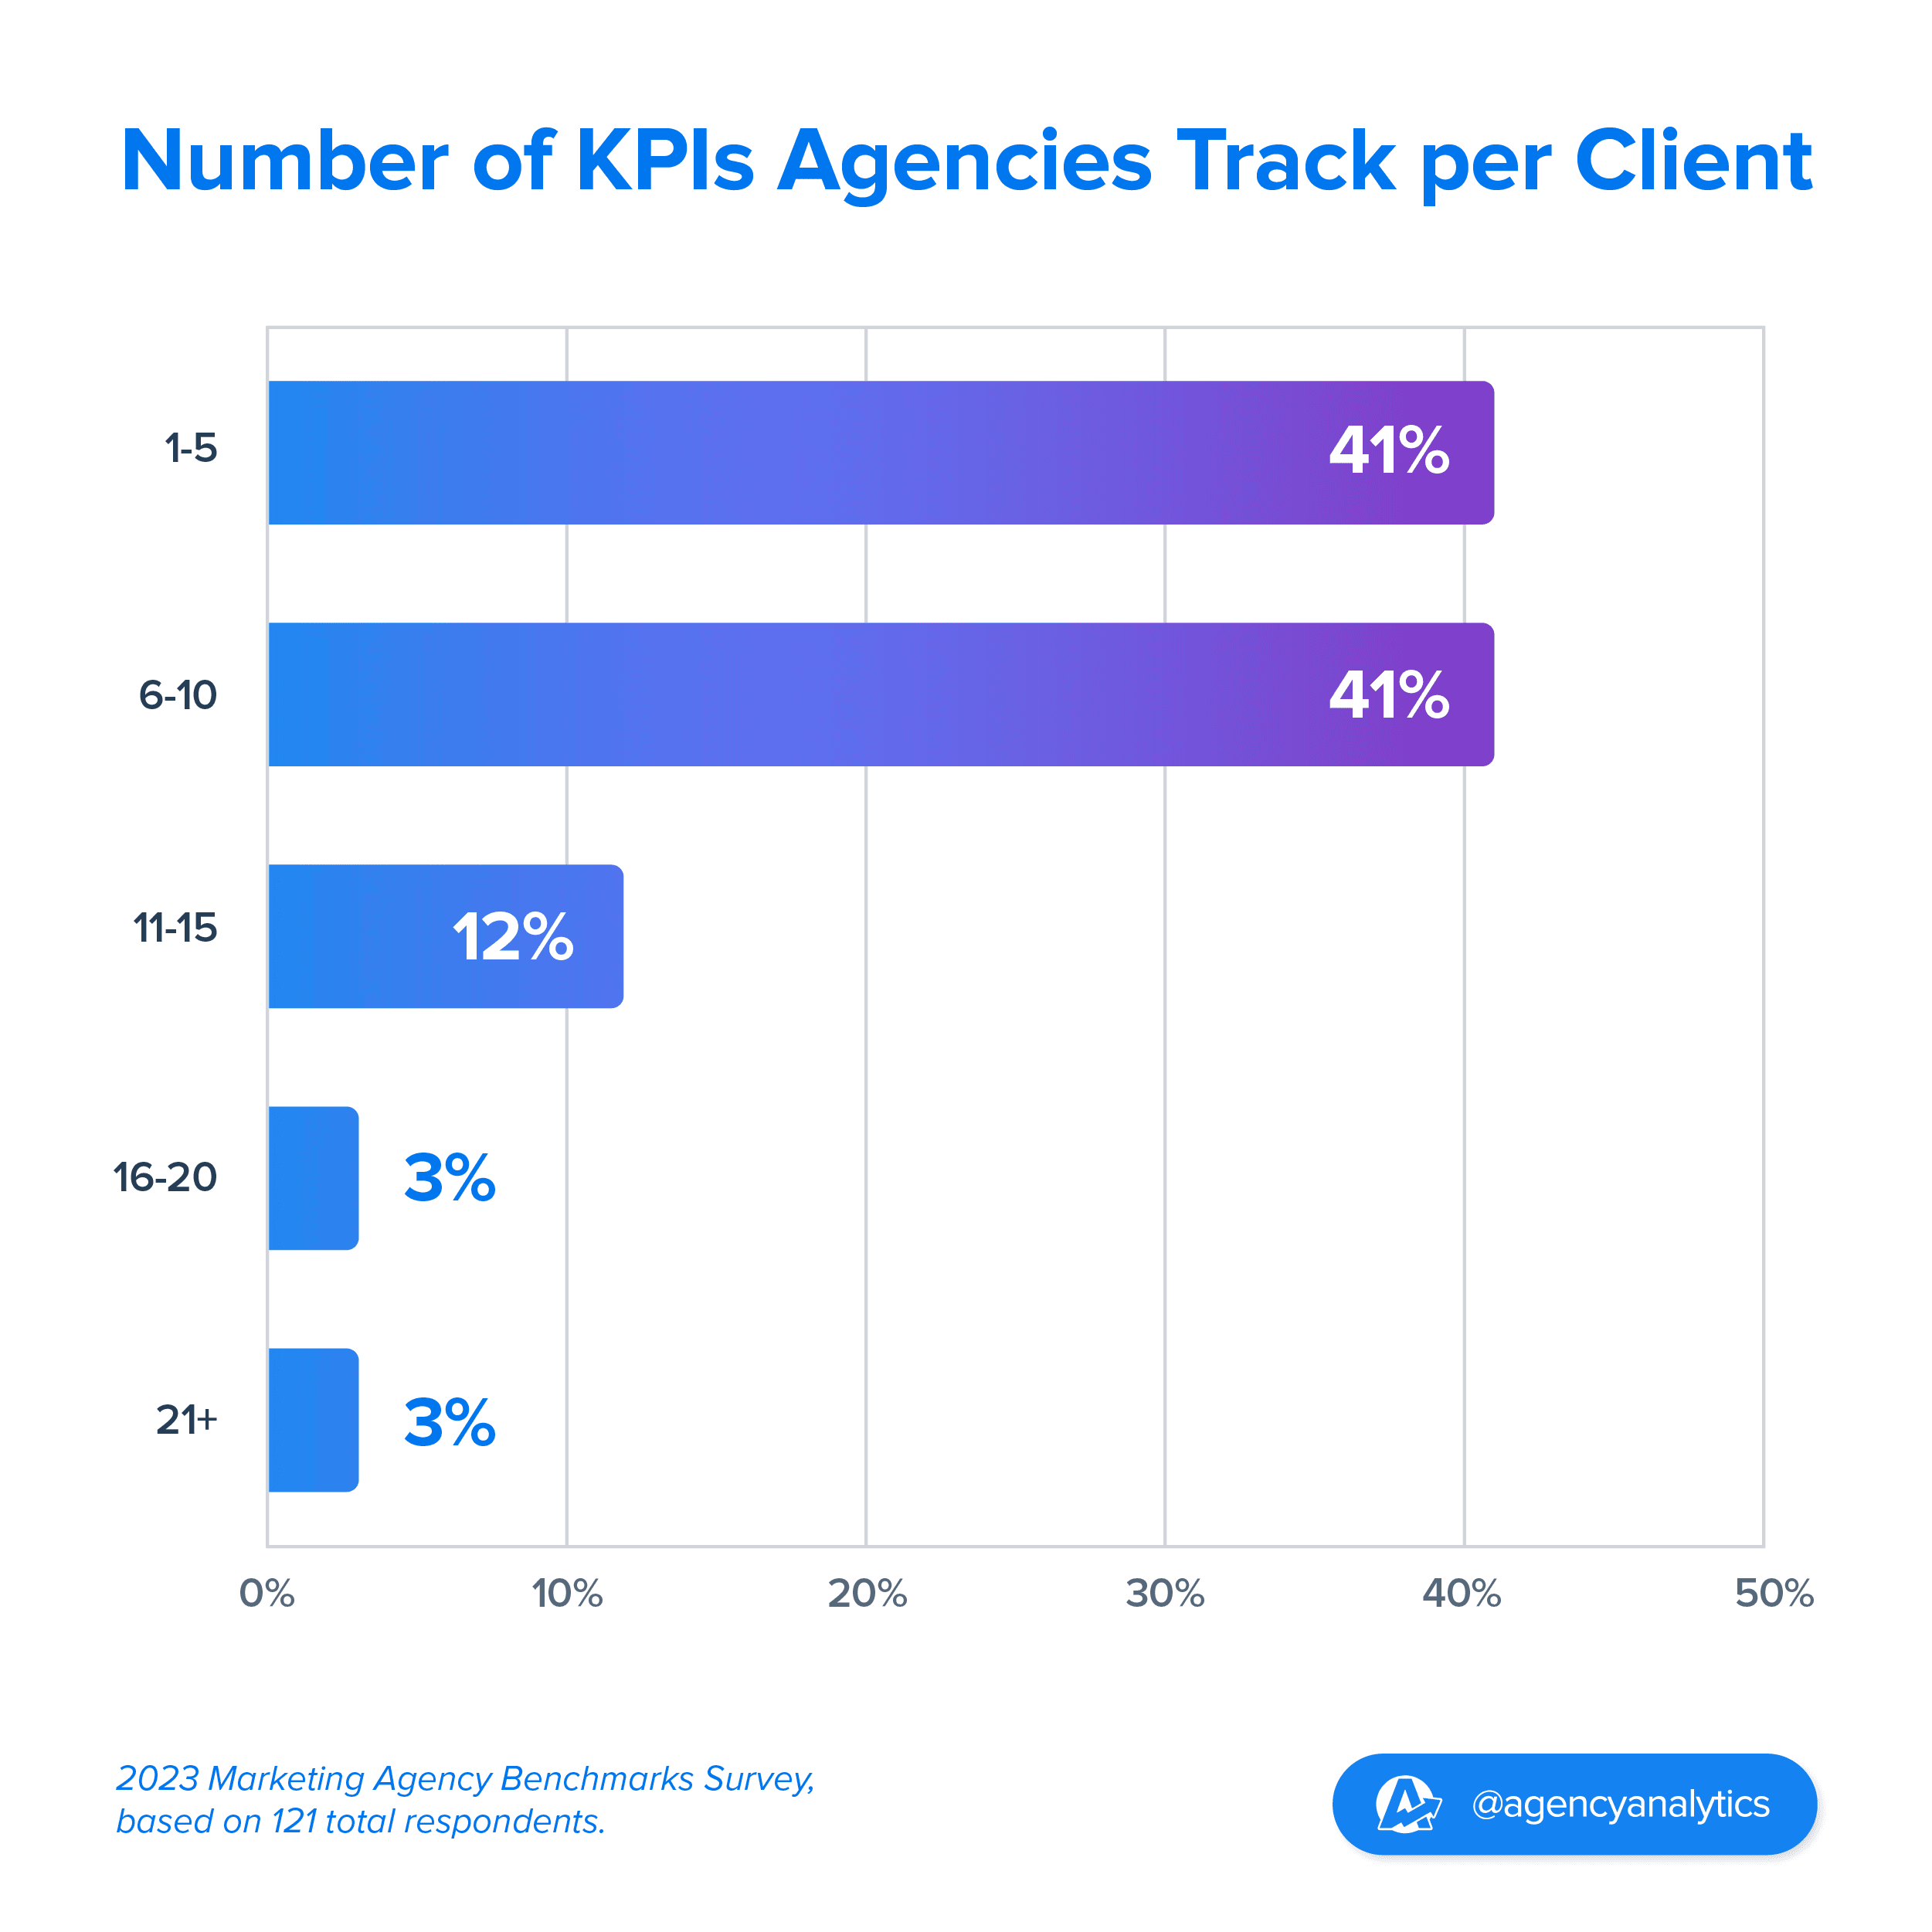
According to the survey results, the majority of agencies hone in on ten KPIs or less for each client:
41% of marketing agencies track 1-5 KPIs per client
Another 41% of agencies track 6-10 KPIs for each client
12% of agencies track 11-15 KPIs per client
3% of marketing agencies track 16-20 KPIs per client
3% of agencies track over 21 KPIs for each client
KPIs are important to clients because they want to understand how much they are spending, what they are spending it on, and most importantly, what is the return on their spend.
Jacob Hicks, Owner, Magnyfi

82% of agencies surveyed opt to monitor 10 KPIs or fewer for each client. This approach seems to underscore a preference for concise, targeted data analysis to streamline communication, ensure clarity, and foster a deeper understanding of the key drivers impacting a client's campaign or strategy.
On the other hand, 12% of agencies choose a more granular approach, monitoring 11 or more KPIs. These agencies likely serve unique client demands or operate within industry sectors where detailed analytics are paramount. Such depth often maximizes every nuance to optimize campaigns more precisely and increase ROI.
💡 Interestingly, all of the agencies that report on 11+ KPIs for each client say that their client reporting takes 45 minutes or less with AgencyAnalytics.
Many forward-thinking agencies are now leveraging live dashboards. These dashboards spotlight top-level KPIs, giving clients an at-a-glance view of their performance. But they also come with the flexibility for clients to delve deeper into specific metrics as needed. This approach not only empowers clients with real-time insights but also fosters a sense of transparency and trust.
We utilize our dashboards for much more than reporting, we use them to keep our eyes on campaigns and their key performance indicators around the clock and think our clients should be able to as well. You can't hide behind dynamic data, so in a way, it pushes us to be the best we can.
Ashlee Brown, Campaign Performance Manager, i76 Solutions
How Many Data Sources Do Agencies Pull For Client Reports?
While the number of top-level KPIs agencies use may be purposefully focused, there is still a breadth of data sources to fuel these metrics. For instance, an agency might be reporting on social media conversions and pulling data from platforms like Instagram, TikTok, and Facebook.
So, how many of these platforms do agencies tap into to provide a comprehensive report for their clients?
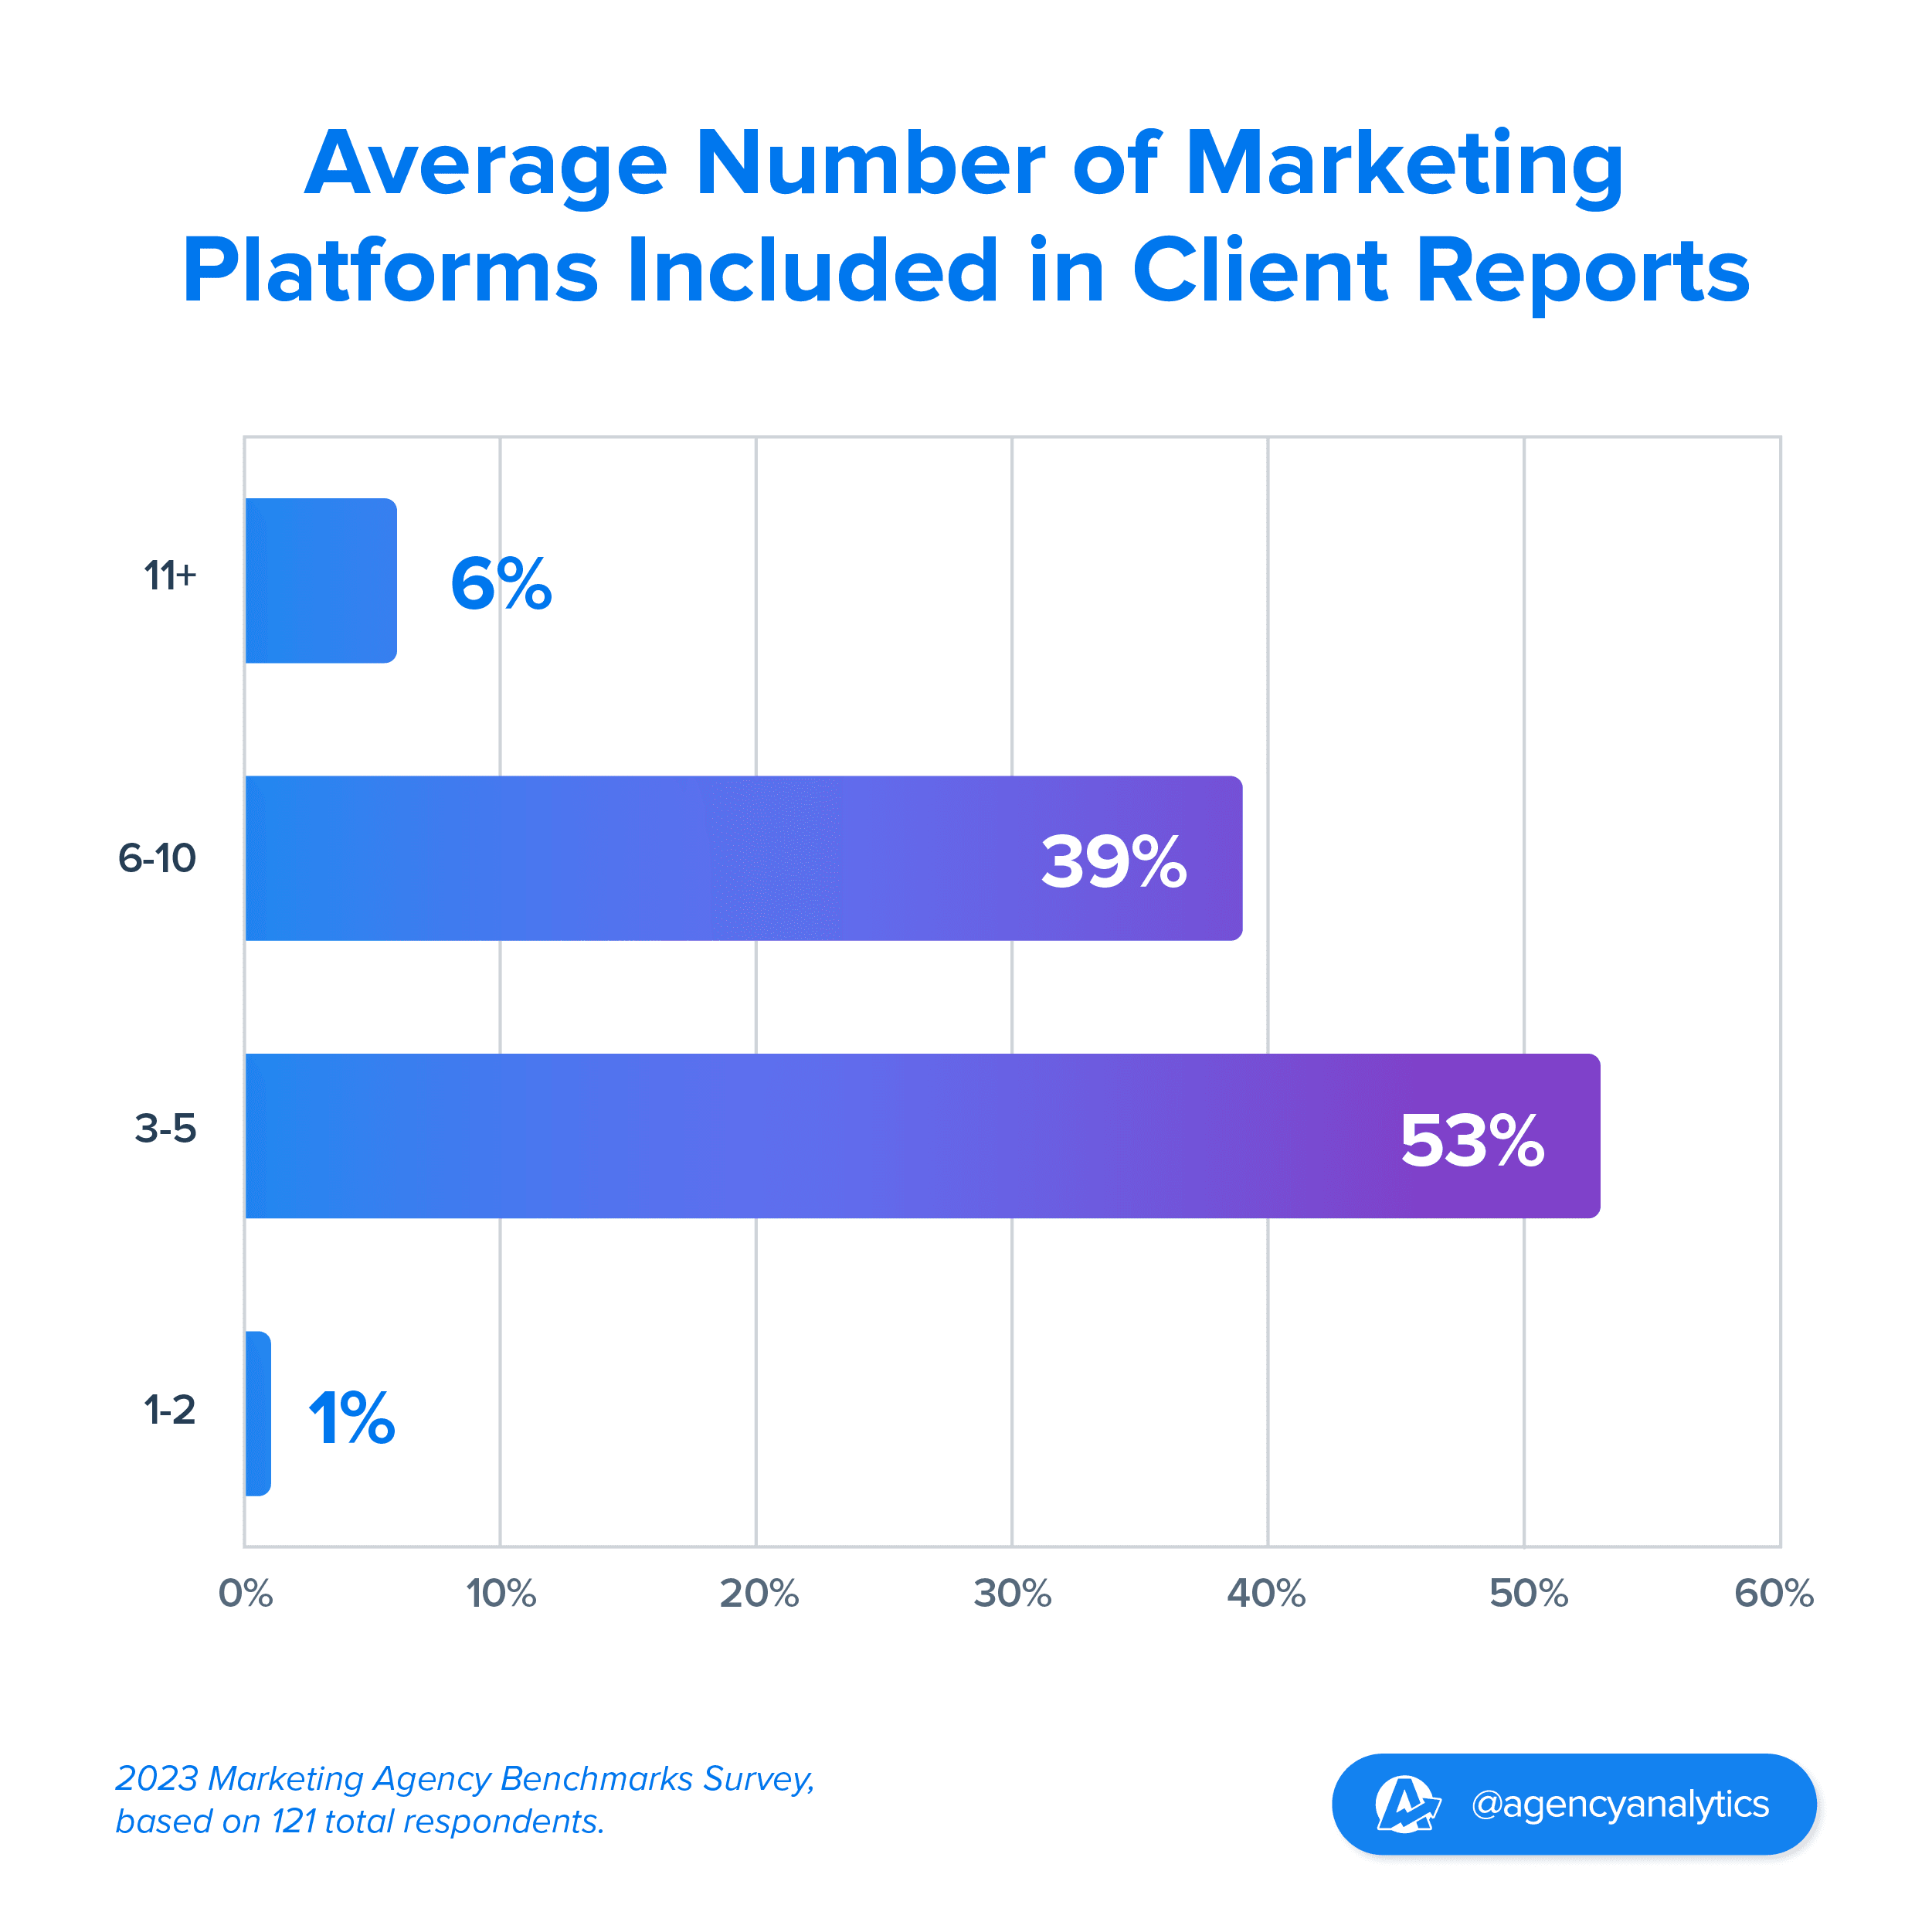
Based on the survey results, there are some patterns in how agencies approach data integration:
The majority of agencies, at 53%, pull from a moderate range of 3-5 data sources
39% of agencies delve deeper, integrating between 6 to 10 data sources
A smaller segment, 6% of agencies, go above and beyond, pulling from 11 or more data sources
On the other end of the spectrum, 2% of agencies rely on just 1-2 data sources
While agencies of all sizes generally prefer to focus on 3-5 key marketing channels, the data indicates that as agencies scale, they expand their service offerings across multiple platforms. However, this diversification is usually measured, rather than excessive. Agencies with 100+ clients have a fairly even split between using 3-5 data sources and 6-10 data sources.
However, there's a slight trend where agencies with a larger number of clients (50-100 and 100+) occasionally opt for a more focused approach (11+ data sources), but this is not overwhelmingly common.
💡This diversity in data source integration underscores the importance of a flexible and scalable reporting tool like AgencyAnalytics. The ideal client reporting tool should adapt seamlessly as an agency's requirements change, no matter the variety of data sources involved.
Those integrating with more platforms are likely full-service agencies or are catering to enterprise-level or a broader range of clients with multifaceted marketing campaigns spanning multiple platforms and channels. Likewise, agencies reporting from one to two data sources are focusing on niche markets or specific marketing channels, offering specialized services.

Over half of the respondents use between 3-5 data sources for their client reporting, which aligns with AgencyAnalytics’ data usage findings from over 7,000 agencies:

Meanwhile, there is still a significant number of agencies (39%) that use between 6-10 data sources in their client reports. Agencies must access and integrate data from all platforms relevant to a specific client. By consistently reporting on these KPIs, they demonstrate a combined data approach and a targeted emphasis on measuring success.
As agencies juggle more data sources, the demand for a robust automated reporting tool becomes evident. It's essential for efficiently gathering and showcasing KPIs and crucial metrics.
💡The average AgencyAnalytics customer includes data from 5.6 marketing platform integrations in client reports or dashboards.
Leading the pack among AgencyAnalytics integrations favored by marketing agencies are Google Analytics and Google Search Console, edging out key players in social media and SEO such as Instagram and Ahrefs:
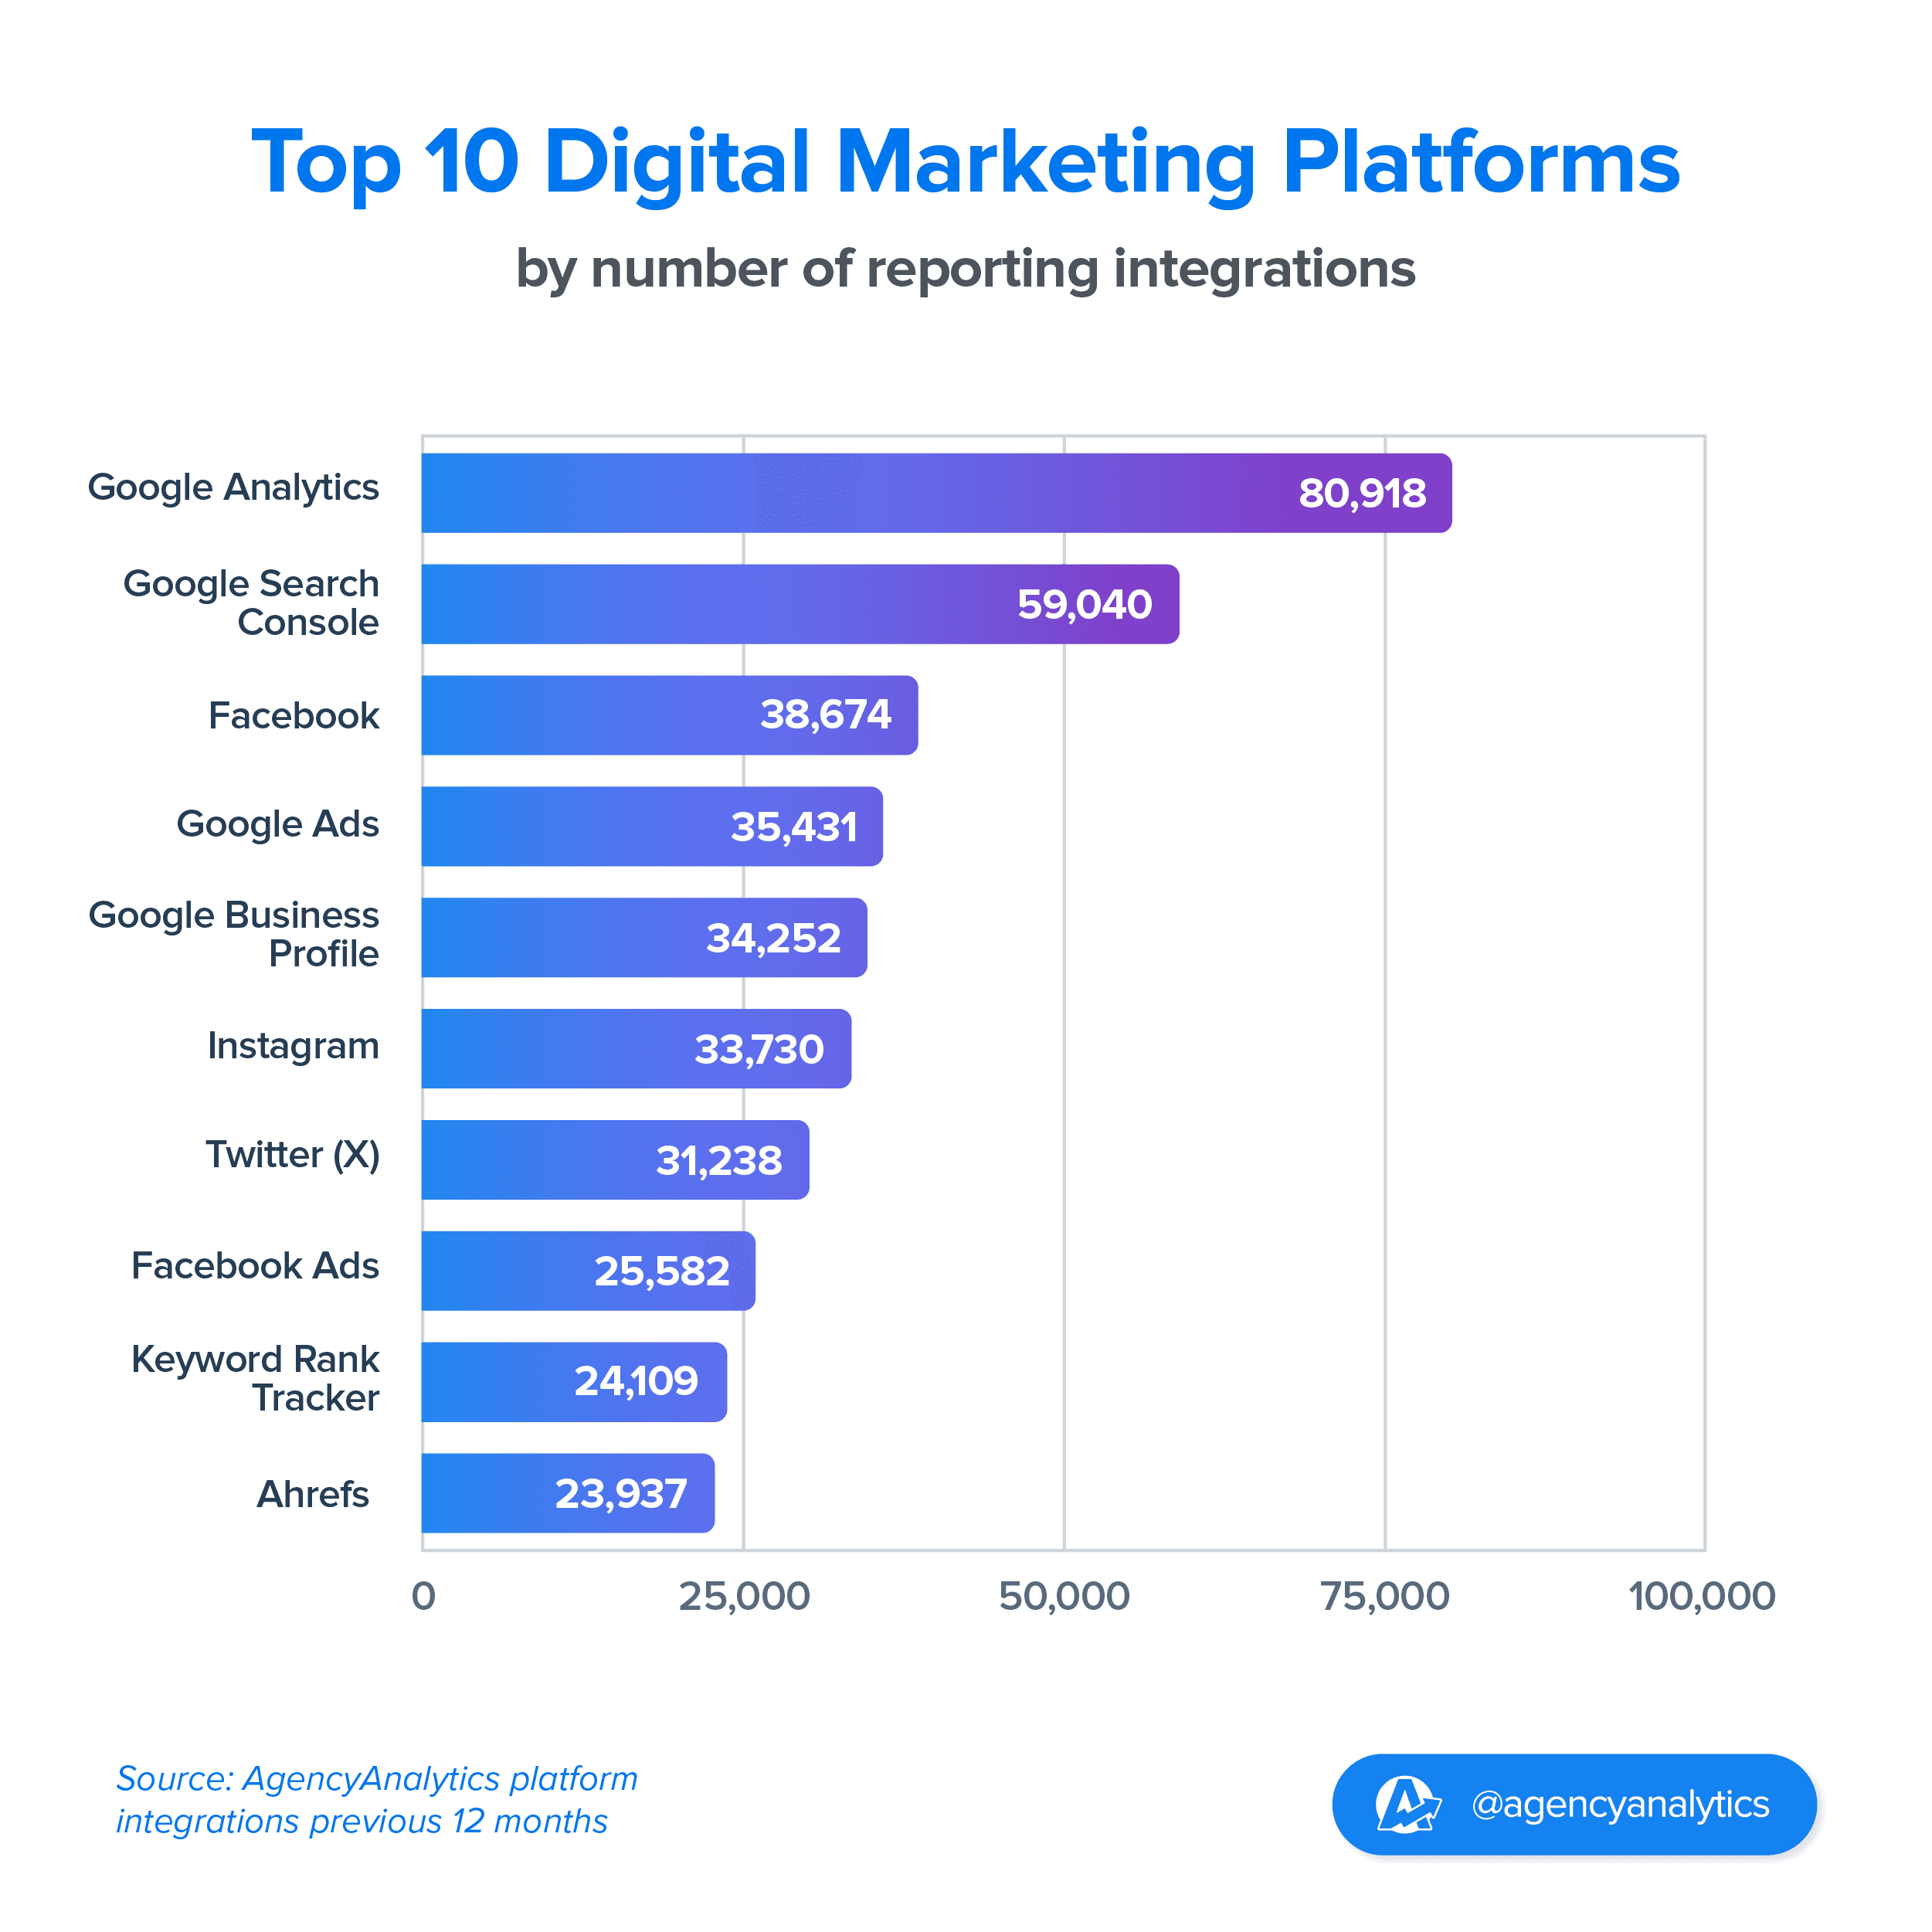
As agencies navigate varying degrees of data integration, one element remains paramount: the ability to visualize this data cohesively.
AgencyAnalytics has played an instrumental role in the growth and retention of our client portfolio. The combination of a sleek interface, dozens of native integrations, and tools that can be leveraged to win business and not just report on business make AgencyAnalytics a must-have for agencies small and large.
Adam Allen, CEO, LeaseMyMarketing
Whether an agency is pulling from three sources or ten, the true value lies in presenting these diverse data streams in a unified, comprehensible manner. Centralized data visualization software not only streamlines the reporting process but also enhances the client's ability to grasp complex insights at a glance.
The trend towards moderate data integration underscores the importance of balance. While it's crucial to capture a broad spectrum of insights, it's equally vital to present them in a way that's digestible and actionable. By centralizing and effectively visualizing data, agencies ensure that their reports are not just comprehensive but also clear, driving informed decision-making and fostering a deeper understanding between the agency and its clients.
How Detailed Are Agency Client Reports?
When it comes to agency client reports, the level of detail can vary widely. To better understand this spectrum, we asked agencies a simple yet revealing question: 'How Much Detail Do You Include, From Top-Level Summaries to In-Depth Analyses?'
The feedback highlighted the diverse expectations of clients and emphasized the critical role of adaptability in agency reporting practices.
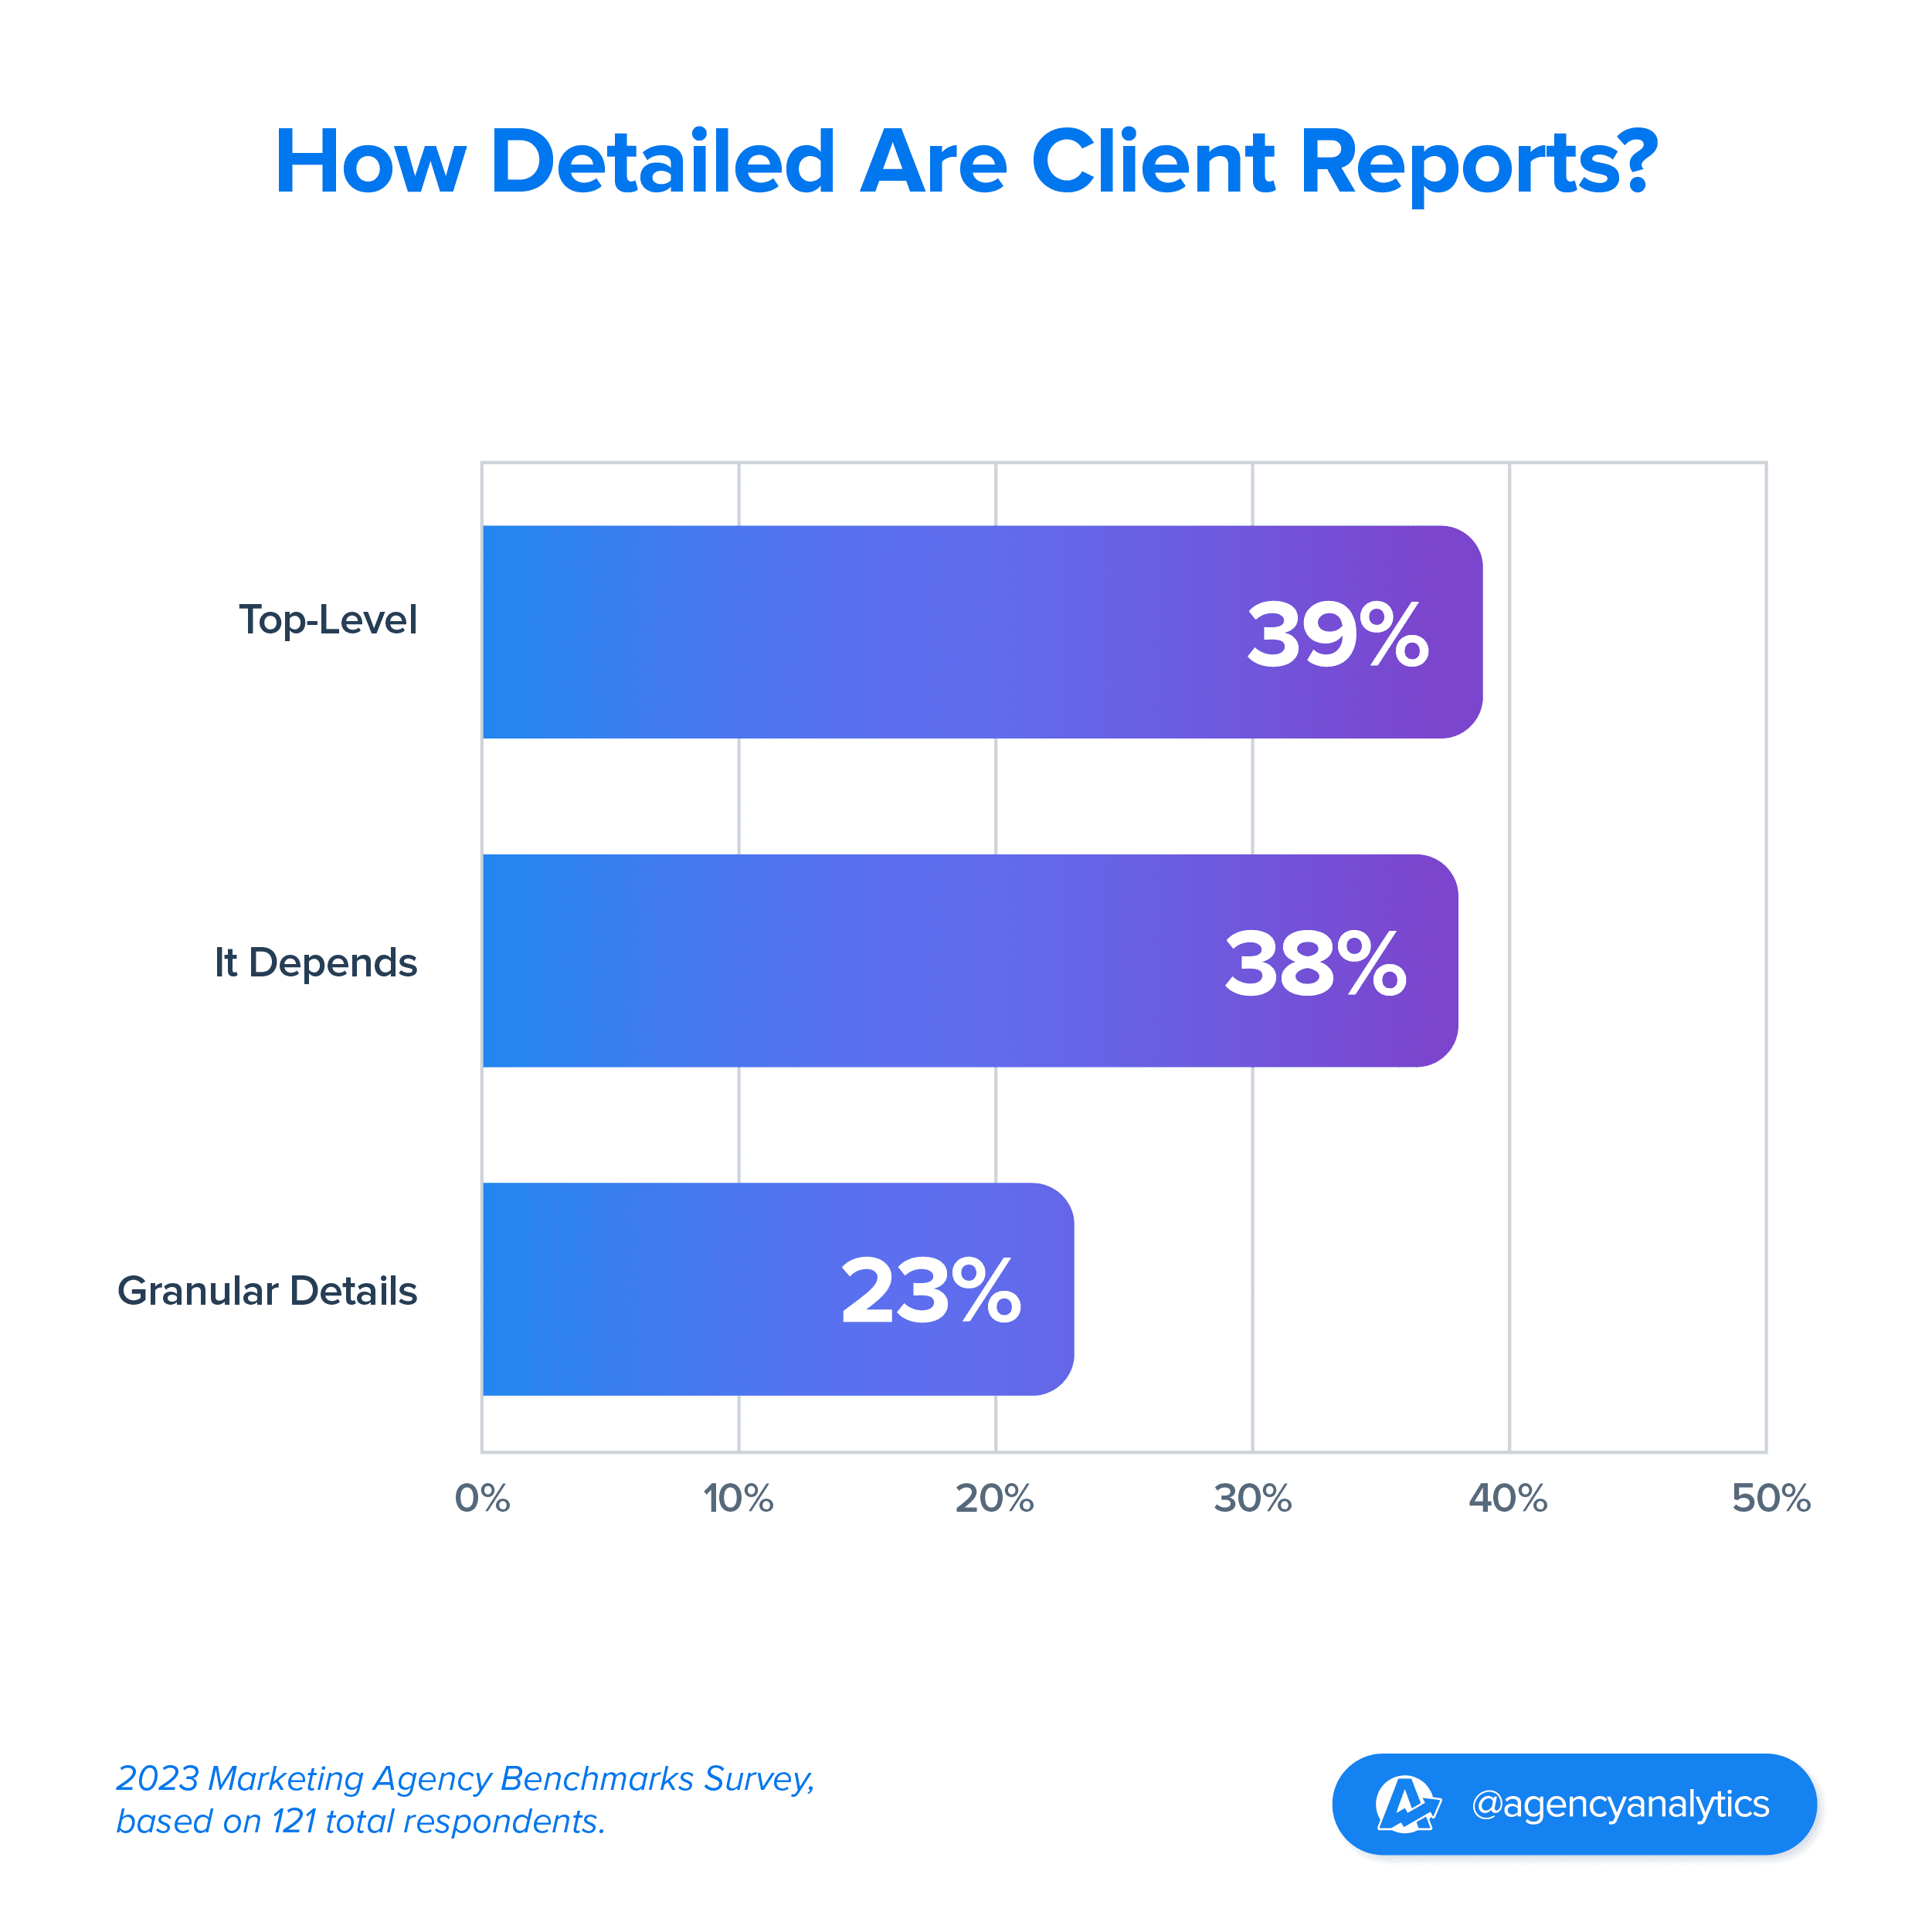
The survey results point to an interesting distribution in the ways agencies approach client reporting:
39% of agencies send their clients top-level, big-picture reports that cover the main KPIs
23% of agencies get granular in their client reports, with detailed metrics for each individual channel/campaign
38% of agencies say that it depends on what the client wants
The near-even breakdown reveals that while there's a slight preference for top-level reporting, there's no overwhelming majority leaning towards any one style, leaving room for client-centric flexibility.
Ask the client what they want to receive and what the most important metric is for them! Many digital marketers get carried away looking to dive deep into the data and spend hours creating a report. Some clients only care about how many times the phone has rang or where they appear on Google. You can save yourself hours just by asking a client what they want to see on a report.
Guy Hudson, Founder, Bespoke Marketing Plans
This highlights the need for a diverse toolkit that allows agencies to craft customized reports according to their desired level of detail–from broad strokes to granular detail.

Flip live dashboards into insightful client reports in minutes. Start your free 14-day trial today and see why over 7,000 agencies use AgencyAnalytics to manage their clients’ marketing metrics.
How Agency Teams Review Client Campaign Results
Diving into the heart of agency operations, we explore the methods that teams employ to assess client campaign outcomes. This journey not only reveals the analytical tools at play but also uncovers the strategic thinking that drives agency success.
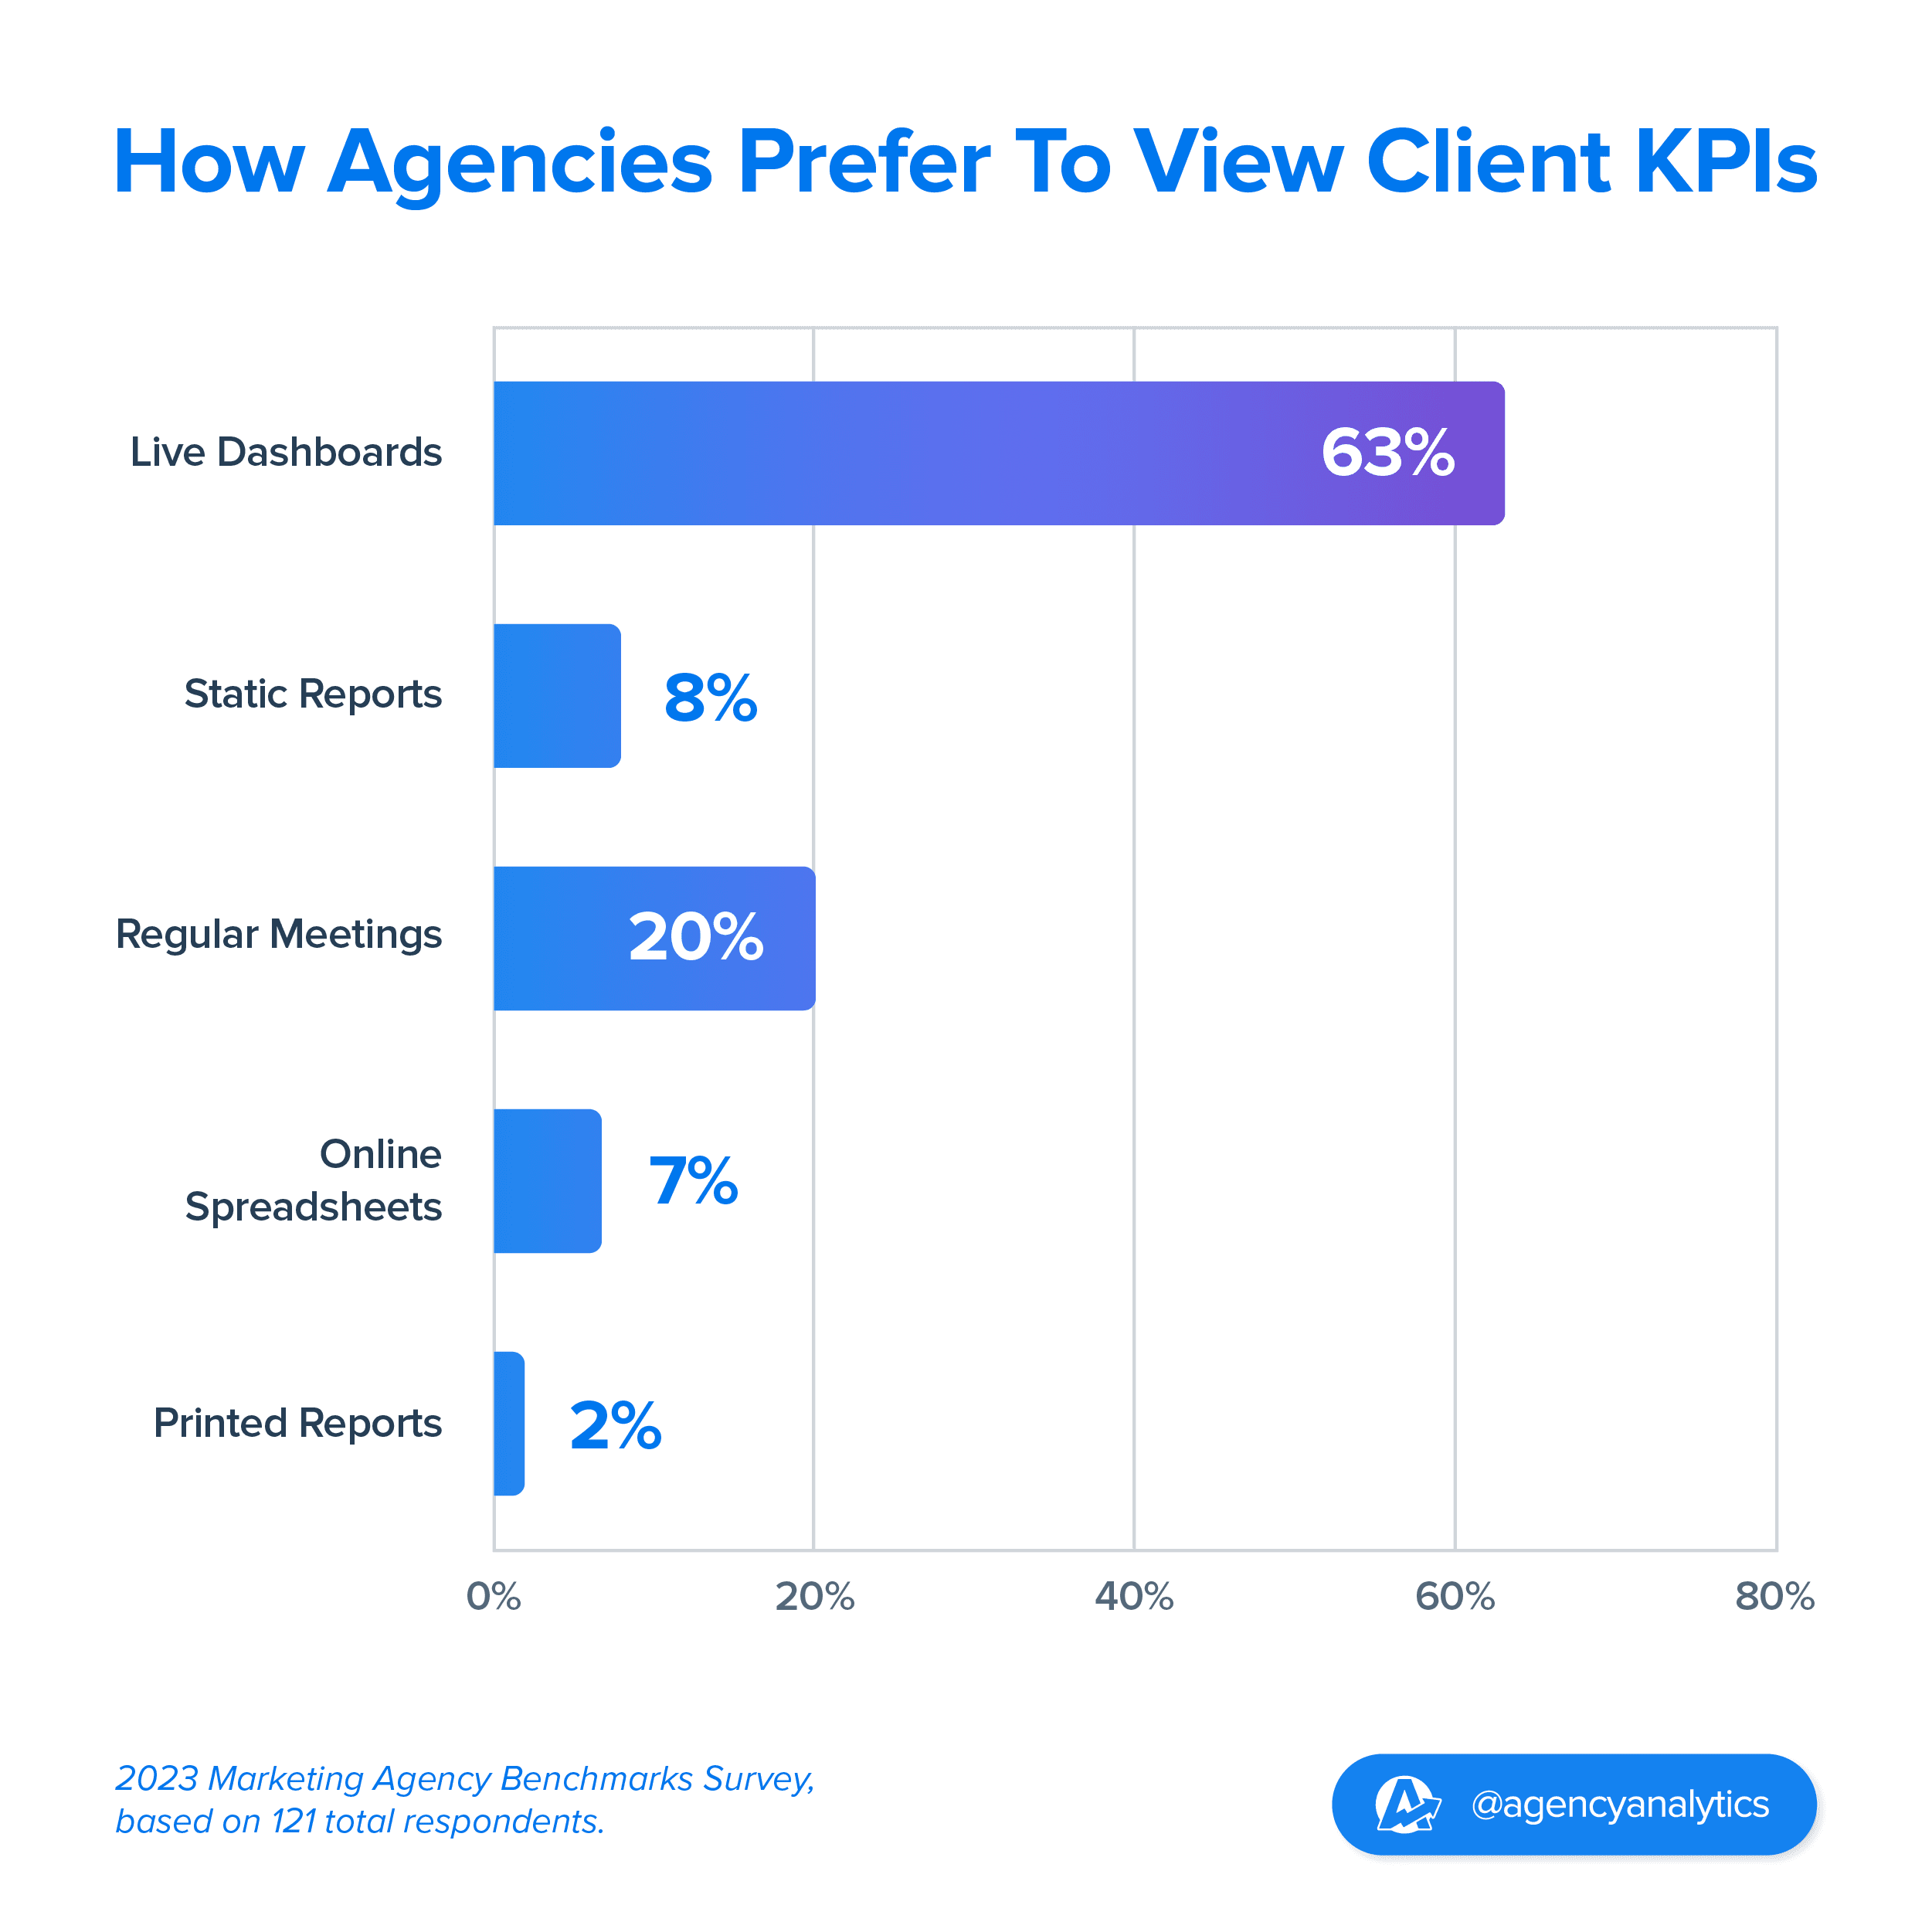
The survey results point to the top ways agencies report KPIs internally:
64% of agencies primarily use live dashboards for internal KPI reporting
8% opt for static reports to review client KPIs internally
20% lean towards regular meetings to check on client KPI progress
Live dashboards offer the flexibility of zooming out for a big-picture overview and drilling down to granular details with just a click. Moreover, having these dashboards accessible at all times ensures that teams make informed decisions promptly, capitalizing on emerging trends or addressing issues as they arise.
Static reports are especially beneficial when presenting distilled insights to agency managers or stakeholders. By focusing on key data points without the distractions of real-time fluctuations, static reports provide a clear, concise snapshot of performance, making them ideal for strategic reviews and high-level decision-making.
In-person discussions offer a platform for teams to align on recent developments, interpret the implications of the reported data, and strategize for future campaigns. By using the reports as a foundation, these meetings foster collaboration, ensuring that all team members are on the same page and working towards unified goals.
Meanwhile, a smaller subset of agencies use:
Online spreadsheets to review their clients’ KPIs: 7% of agencies surveyed might prefer a more hands-on approach to data blending (which is where the Google Sheets data export app comes in very handy)
Printed reports for internal reporting (1%)
Other methods for KPI presentation (2%)
While the majority of agencies might lean towards more modern or conventional methods of KPI presentation, agencies will always find the best fit for their specific needs.

A significant 63% of agencies have adopted live dashboards as their primary tool for presenting clients KPIs internally. This shift towards real-time marketing data visualization techniques not only streamlines the reporting process but also reduces the need for frequent meetings.
By providing instant access to key performance indicators, live dashboards allow team members to stay informed without waiting for scheduled updates or discussions. This immediacy not only saves valuable company time but also ensures that all stakeholders remain aligned, fostering a cohesive understanding of client performance and objectives.
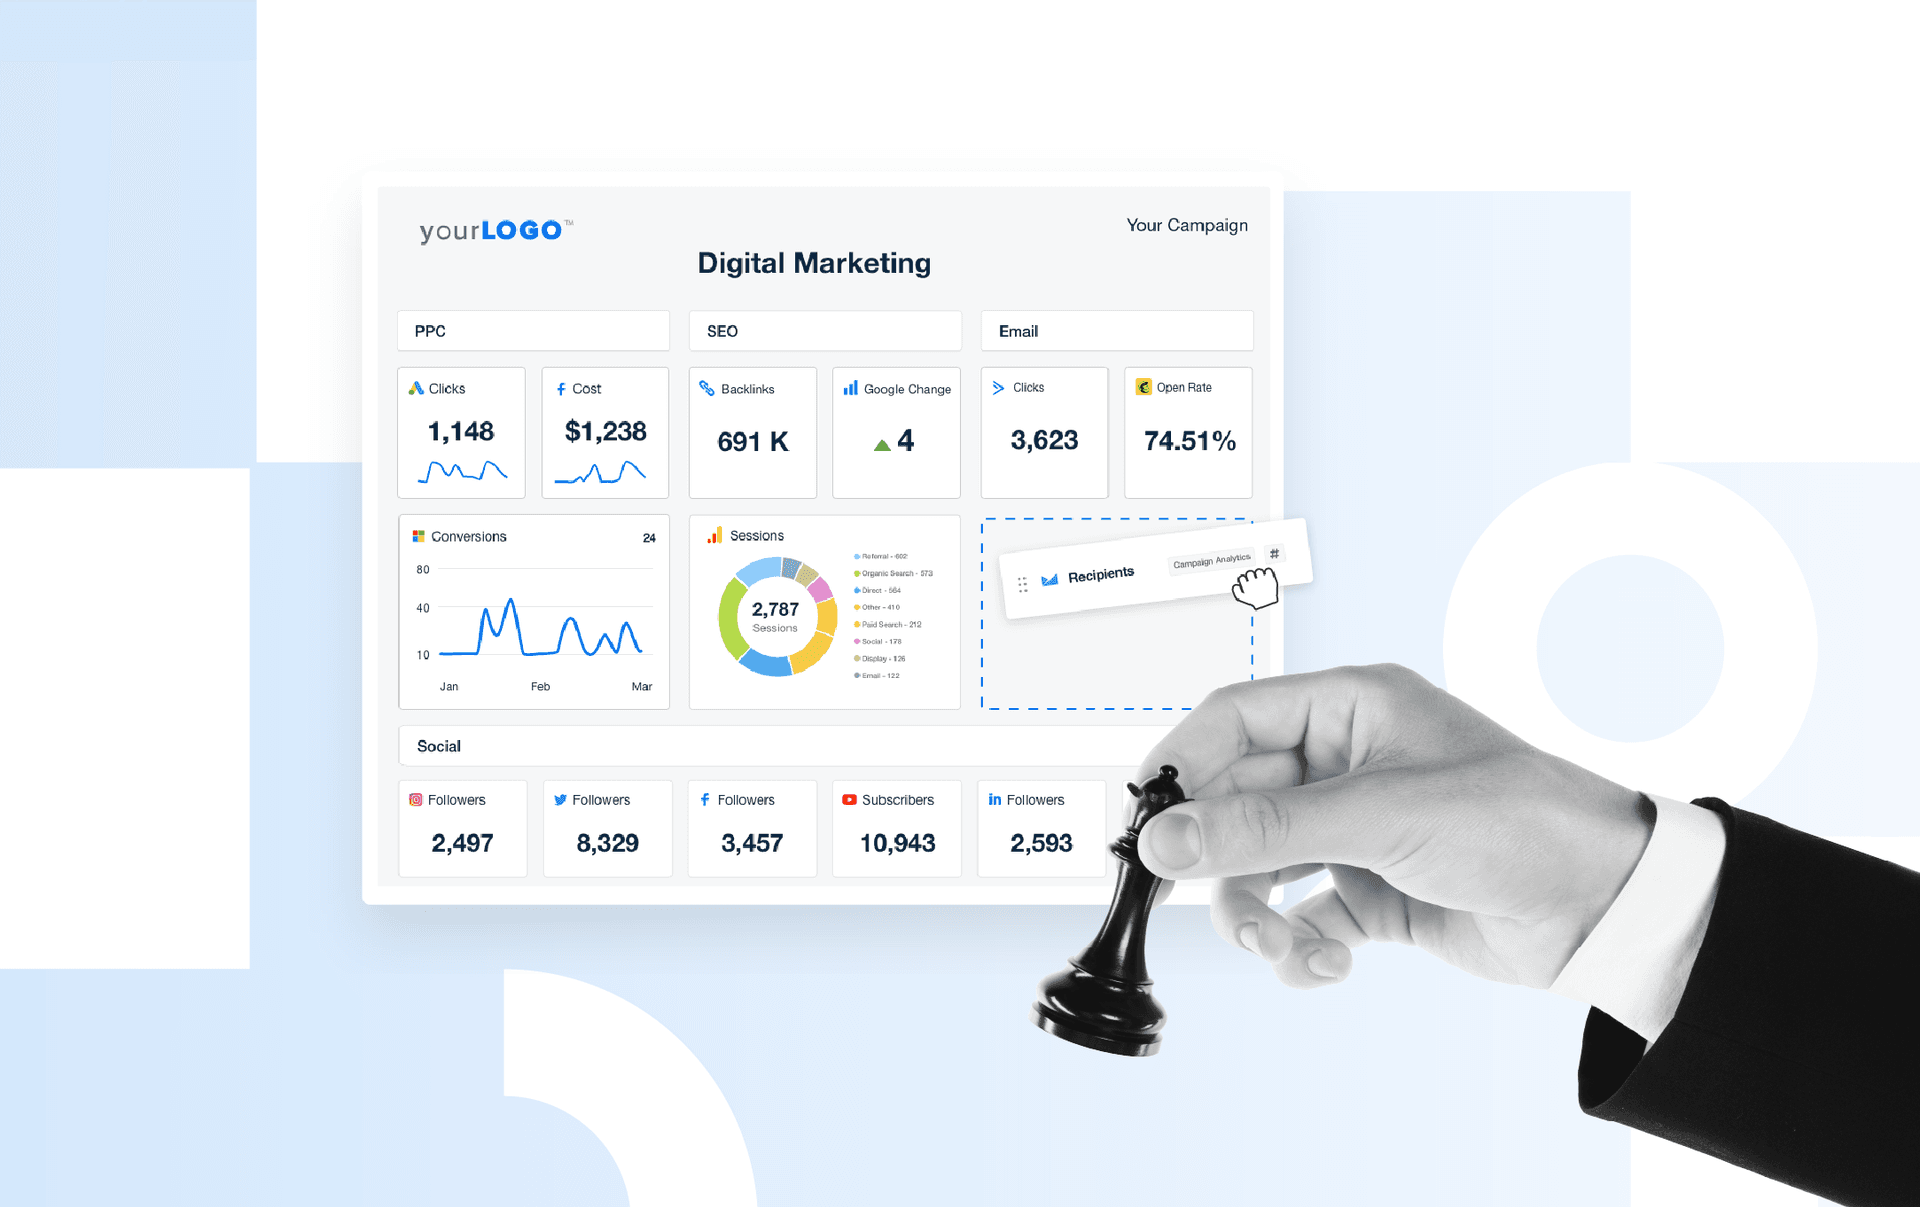
💡The most popular AgencyAnalytics dashboards among 7,000+ agencies are the SEO Dashboard, the Digital Marketing Dashboard, and the Google Ads Dashboard.
For agencies with hands-on clients who frequently seek access to their data, client-facing dashboards are a game-changer. Instead of fielding constant calls or emails, agencies set up dashboards using customizable templates. These tailored dashboards present key metrics in a clear format, granting clients immediate insights and fostering greater transparency and collaboration.
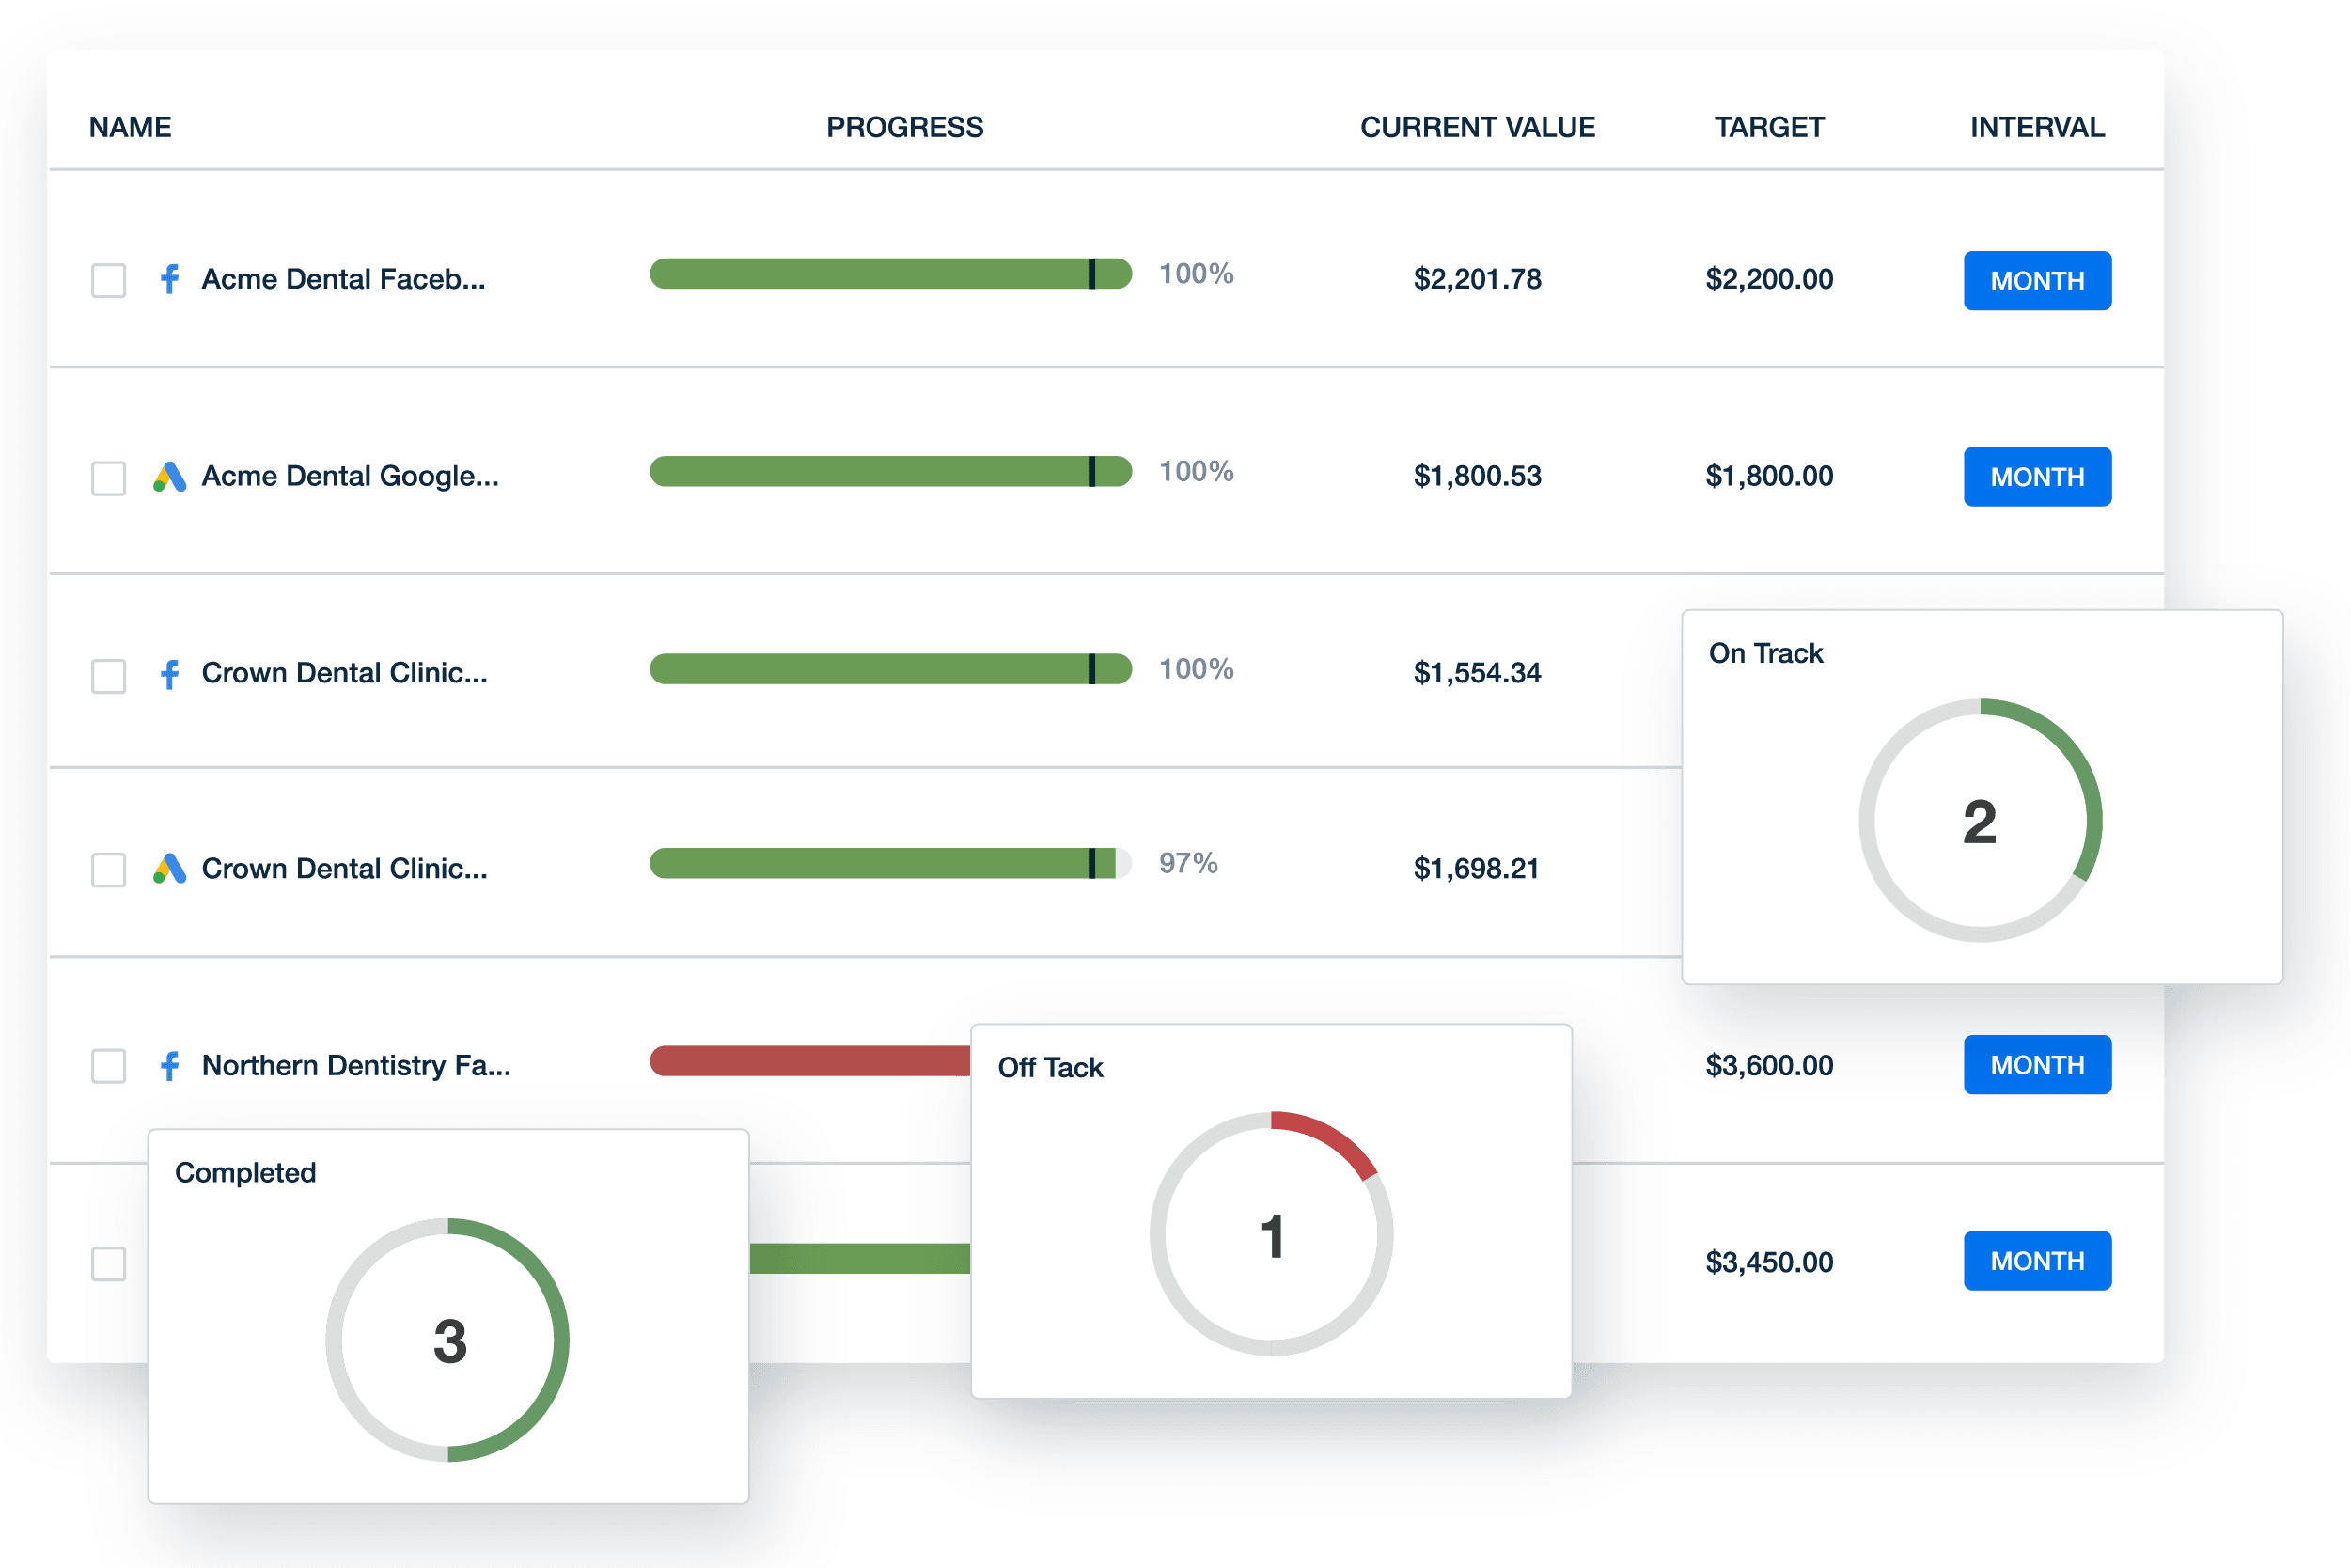
With AgencyAnalytics, tracking client ad budgets becomes straightforward and hassle-free, automating budget pacing reports and ensuring smooth, error-free operation. Try AgencyAnalytics free for 14 days.
How Do Clients Prefer To View Their Campaign Results?
At the heart of every agency's efforts lies one fundamental goal: keeping clients satisfied. Tailoring your reporting methods isn't just about presenting data; it's about presenting it in a way that resonates, is easily digestible, and actionable for your clients.
Let’s see what agencies have to say about their clients’ preferences between dashboards vs. static reports.
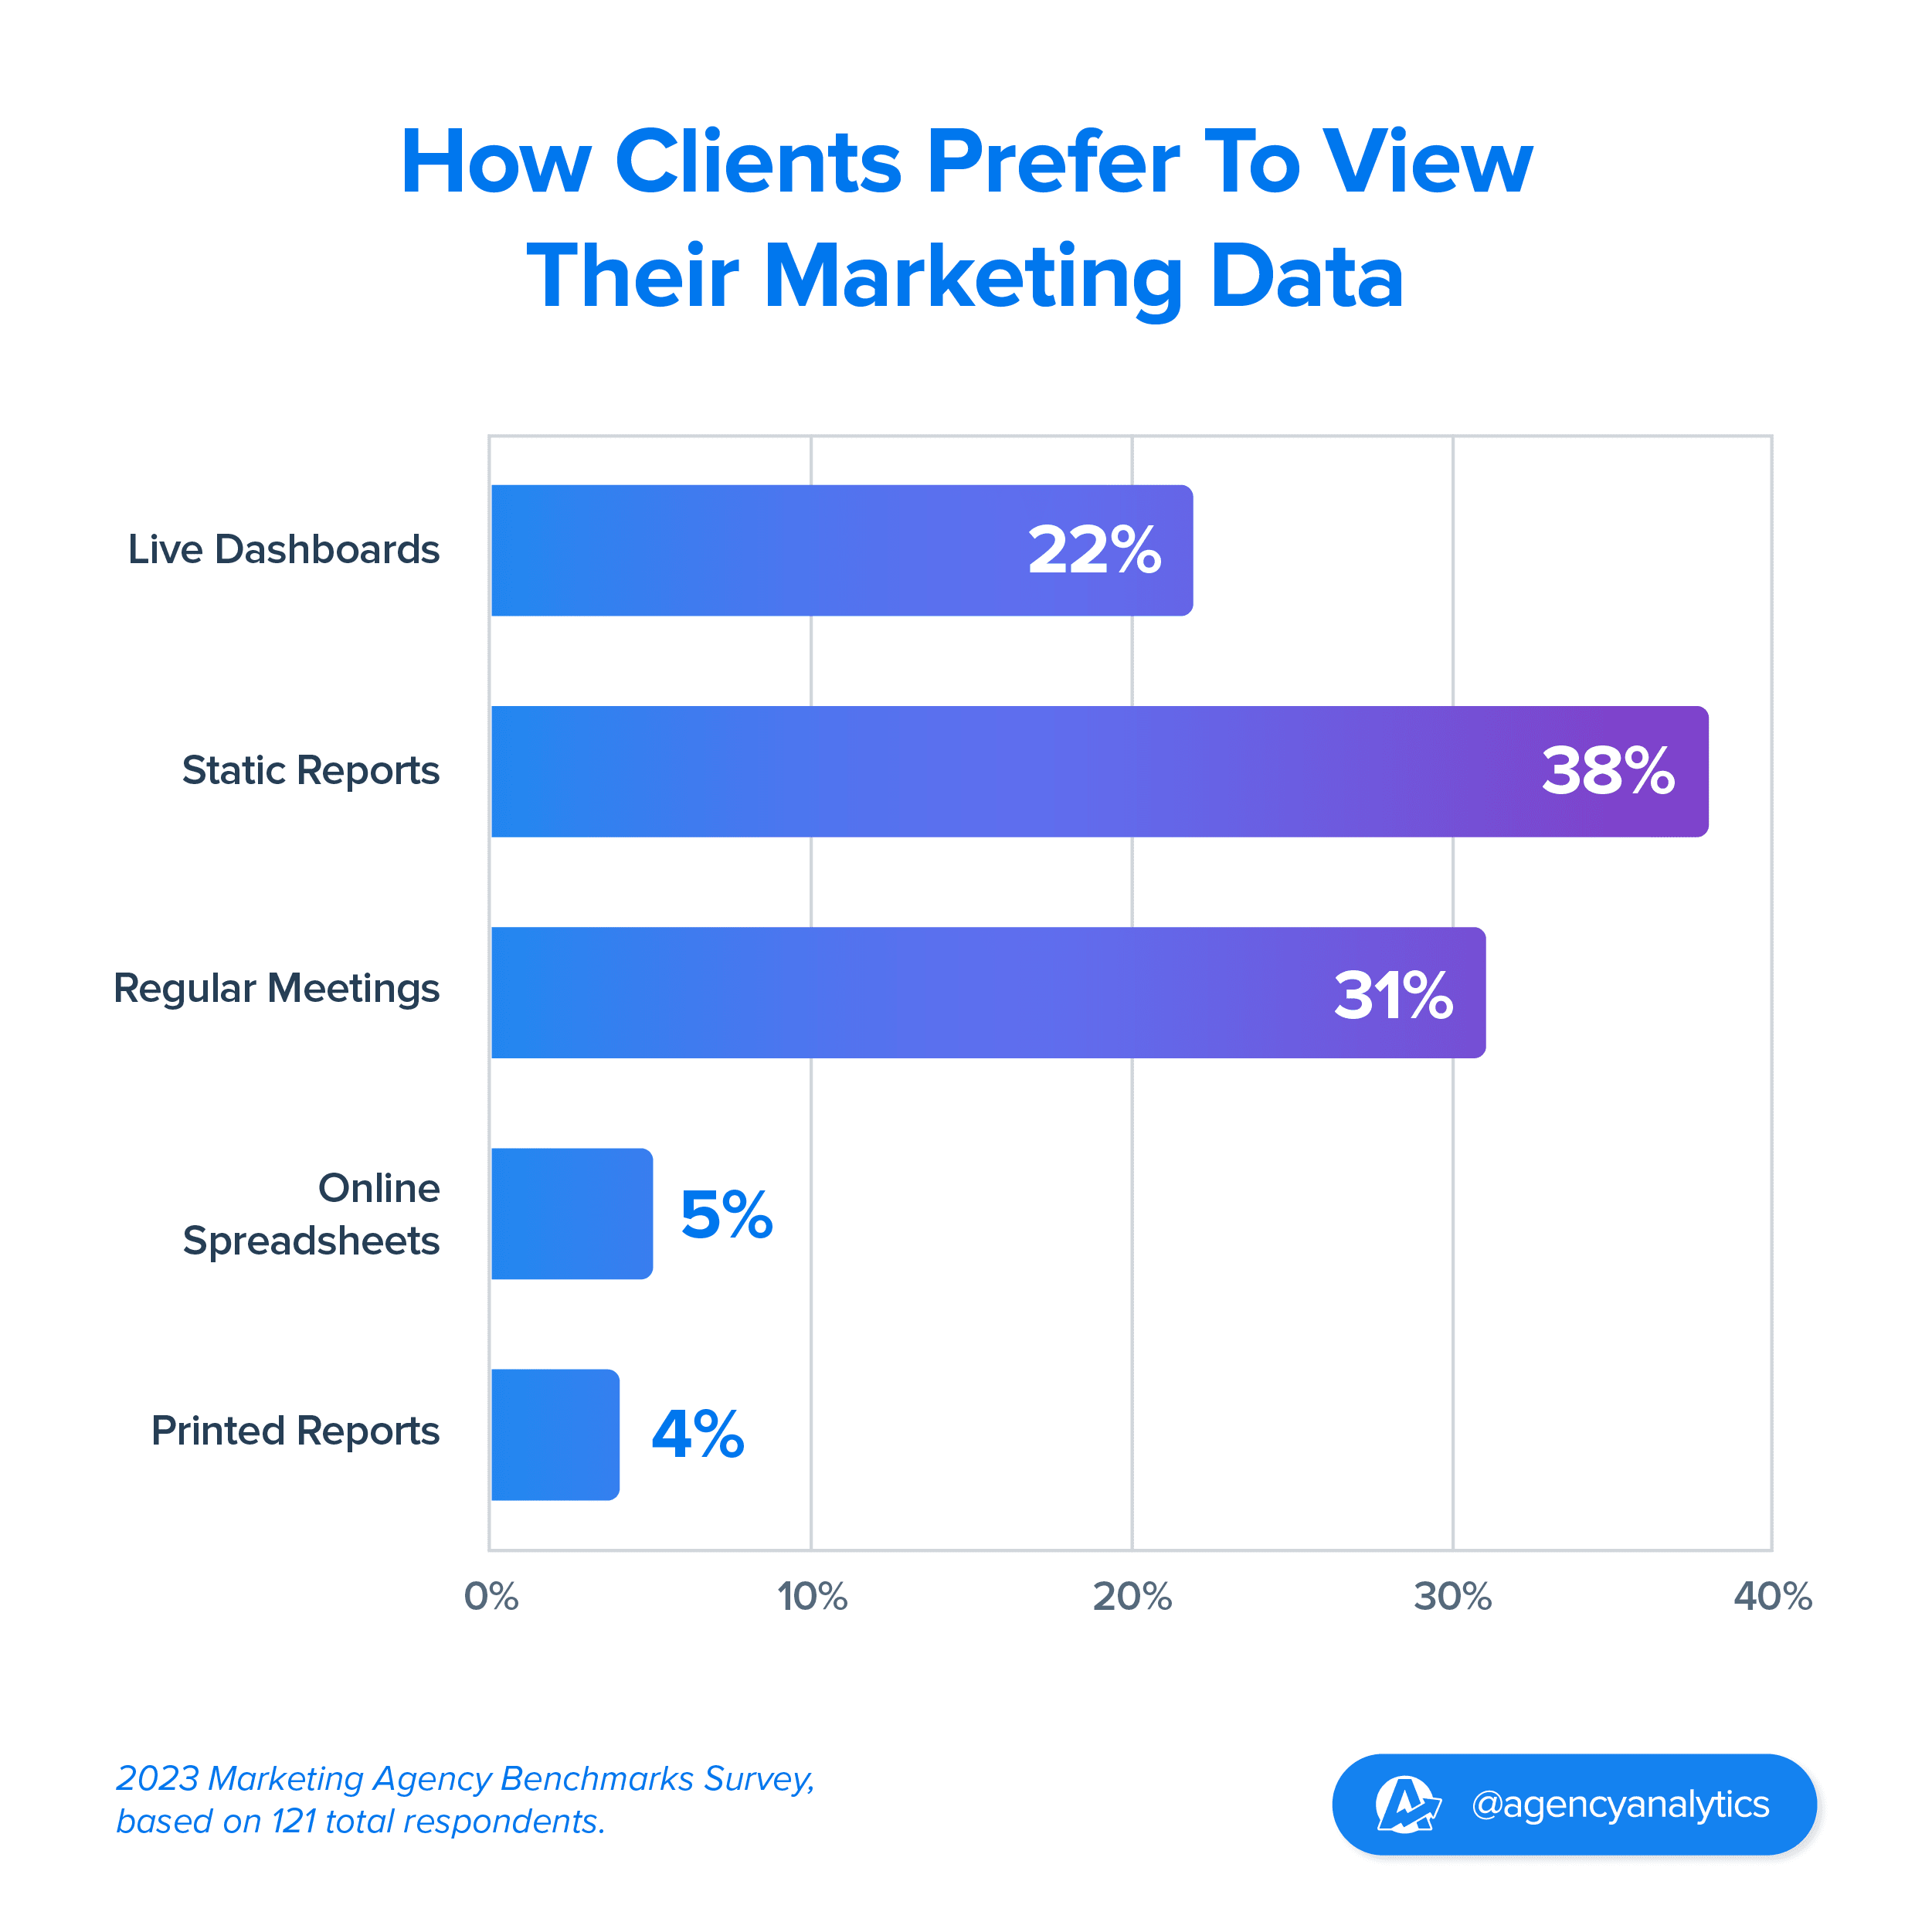
The survey results point to static reports being a client favorite. Here’s the breakdown:
38% of agencies indicate clients favor static reports for viewing marketing data
Meanwhile, a lesser 22% highlight a preference for live dashboards
Still, 31% note that clients choose regular meetings for KPI reviews
Meanwhile, a smaller percentage of agencies say:
Clients prefer online spreadsheets (5%)
Clients prefer printed reports (4%)
Static reports, being fixed and unchanging, offer a clear picture of performance at a specific point in time, making them easy to digest and refer back to. As opposed to live dashboards, which provide layers of detail, static reports prioritize the most pertinent data, echoing the age-old wisdom of "less is more."
The data shows that clients still value the human touch, preferring regular meetings for KPI reviews. This suggests that beyond the numbers, clients value the discussions, interpretations, and strategic insights that come from face-to-face interactions.

In the majority, 38% of agencies report that clients favor static reports. This preference suggests that many clients appreciate a snapshot of their data, a concise overview that distills the most crucial information.
💡Agencies using the AgencyAnalytics client reporting platform employ a mix of fully automated reports, and manual report scheduling. Sending out reports manually provides time to add additional details like annotations, drawing the client’s attention to significant campaign results.

22% of agencies found live dashboards to be the client's top choice, as they offer the advantage of real-time data and deeper insights.
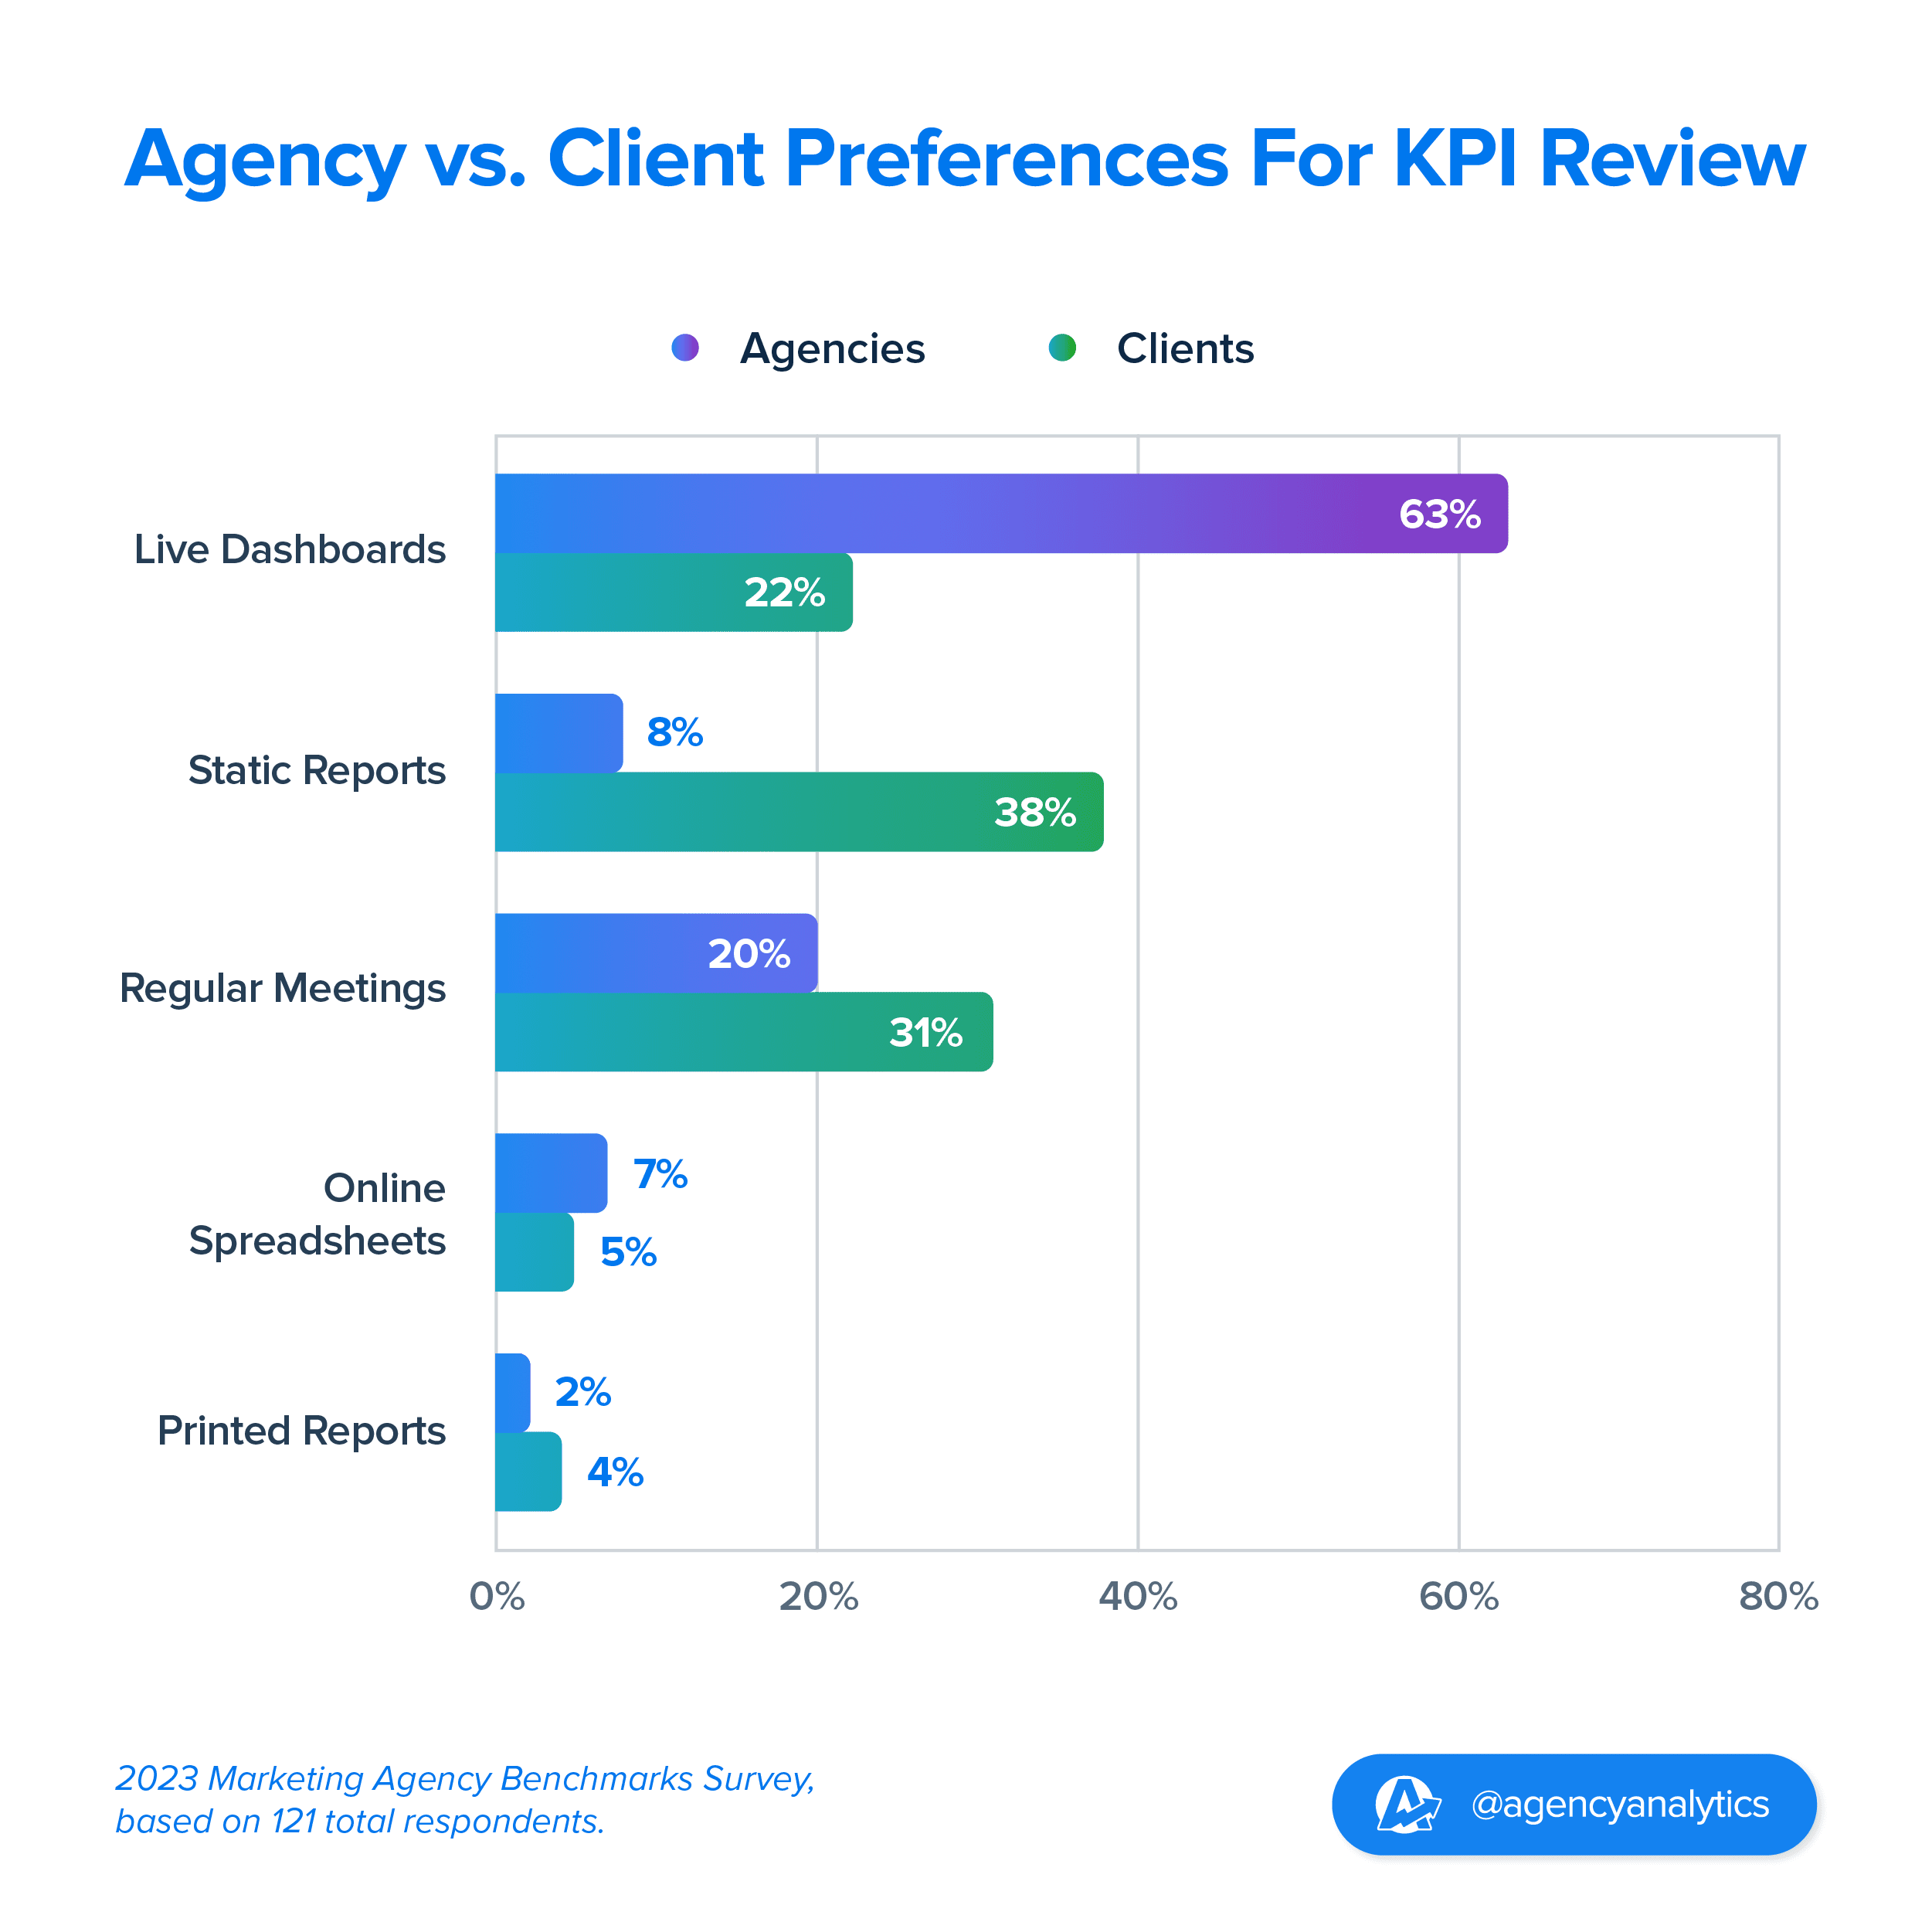
Combining the results above, we see a contrast between agencies and their clients. While agencies lean heavily towards dynamic, real-time dashboards, clients appreciate the simplicity and clarity of static reports and regular meetings.
Versatility in reporting is essential, but there's also an emphasis on lean and efficient communication. Clients seem to gravitate towards clear, concise insights that cut through the noise. This streamlined approach not only ensures clarity but also respects the client's time–and cognitive load.
However, agencies need to keep an eye on campaign performance to be able to address issues and capitalize on opportunities faster than static reports may allow, so they lean toward the real-time value of live dashboards.
Why not provide both? Create narrative-based monthly reports that tell the story of your agency’s accomplishments while also giving clients direct access to a live dashboard so they can dig into specifics when needed using client reporting tools like AgencyAnalytics.
What Do Clients Like Most About Their Agency’s Reporting?
As agencies strive to refine their reporting methods, understanding client preferences becomes paramount. This section delves into the heart of client feedback, shedding light on what aspects of reporting agencies should invest in.
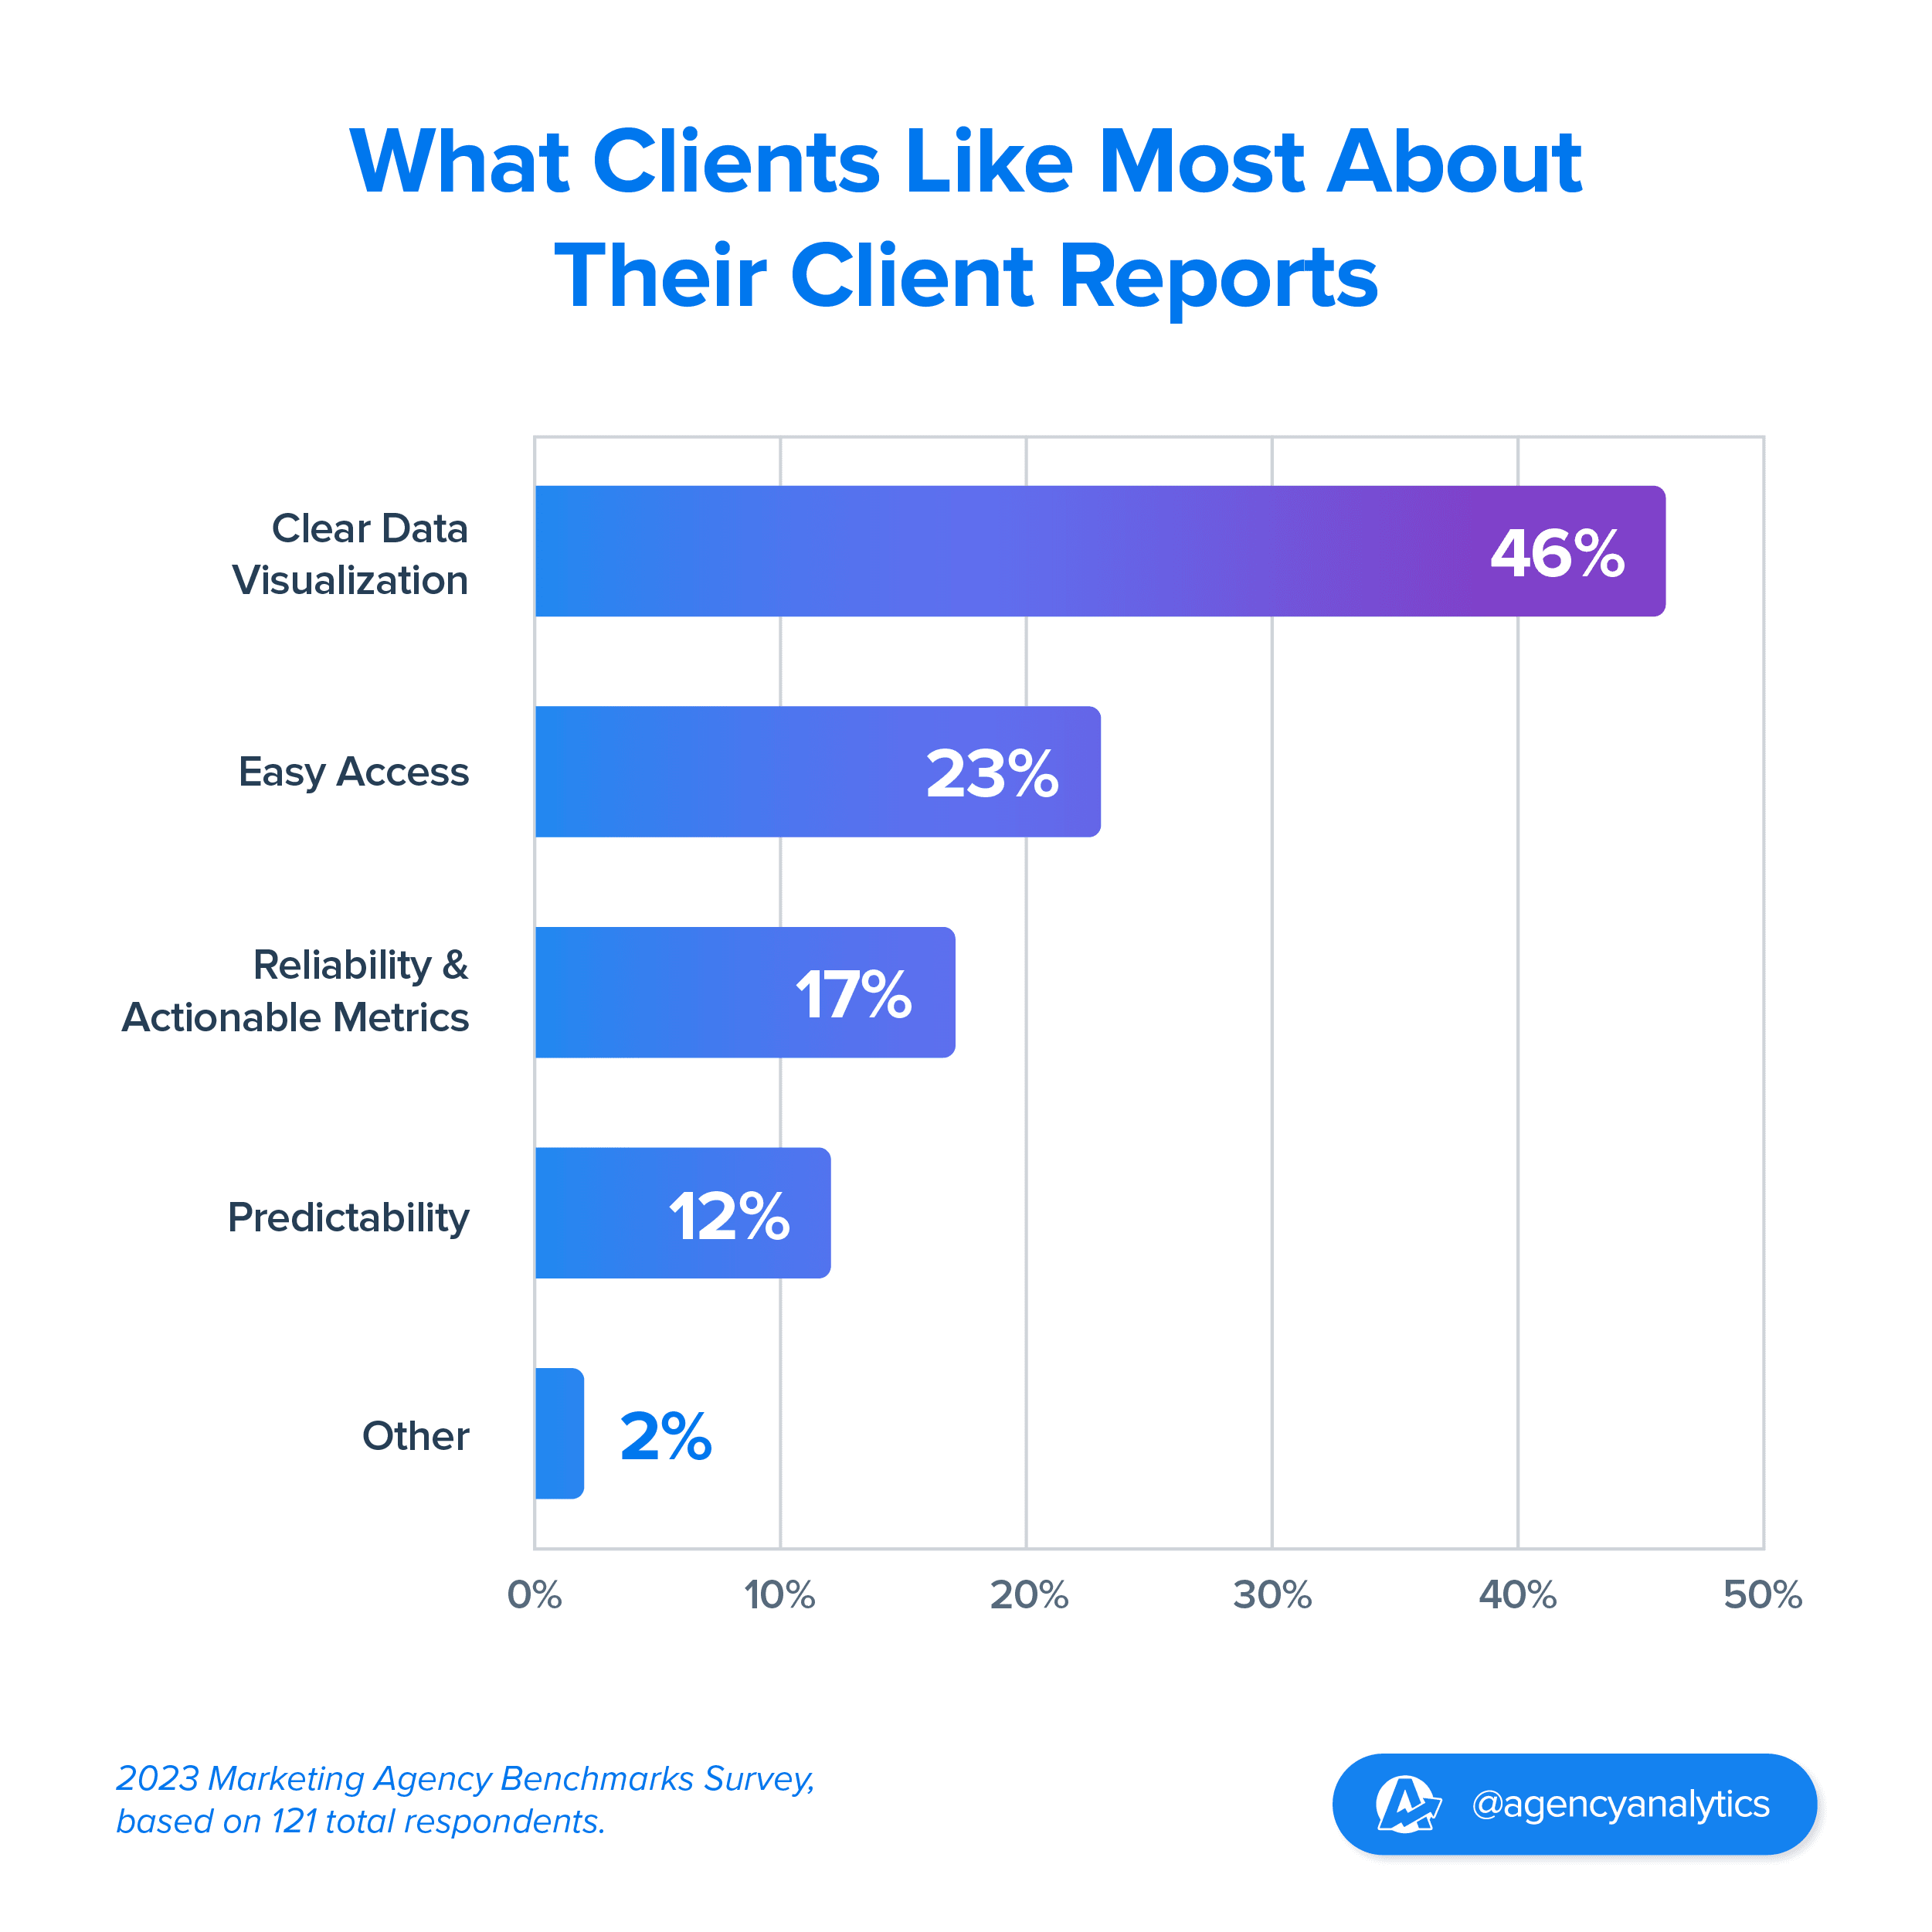
According to the survey, clients prioritize the following aspects of their agency’s client reporting:
46% of agencies highlight that clear visual representation of data stands out as the top value to their clients
23% emphasize the importance of easy access to campaign performance
12% note a preference for predictable frequency
17% underscore the significance of reliable and actionable metrics

The clear preference for data visualization underscores several key insights beyond nice pictures:
Immediate Comprehension: Immediacy equals transparency when it comes to communicating information in a fast-paced environment.
Highlighting Trends and Patterns: Visuals make it easier to spot trends, anomalies, and patterns. They also help compare how campaigns are improving over time.
Enhancing Engagement: Such comparison makes the data more relatable, effectively communicating actionable insights.
Visualizing Goal Progress: Visuals are instrumental in tracking progress towards specific goals, which ultimately translates into client retention.
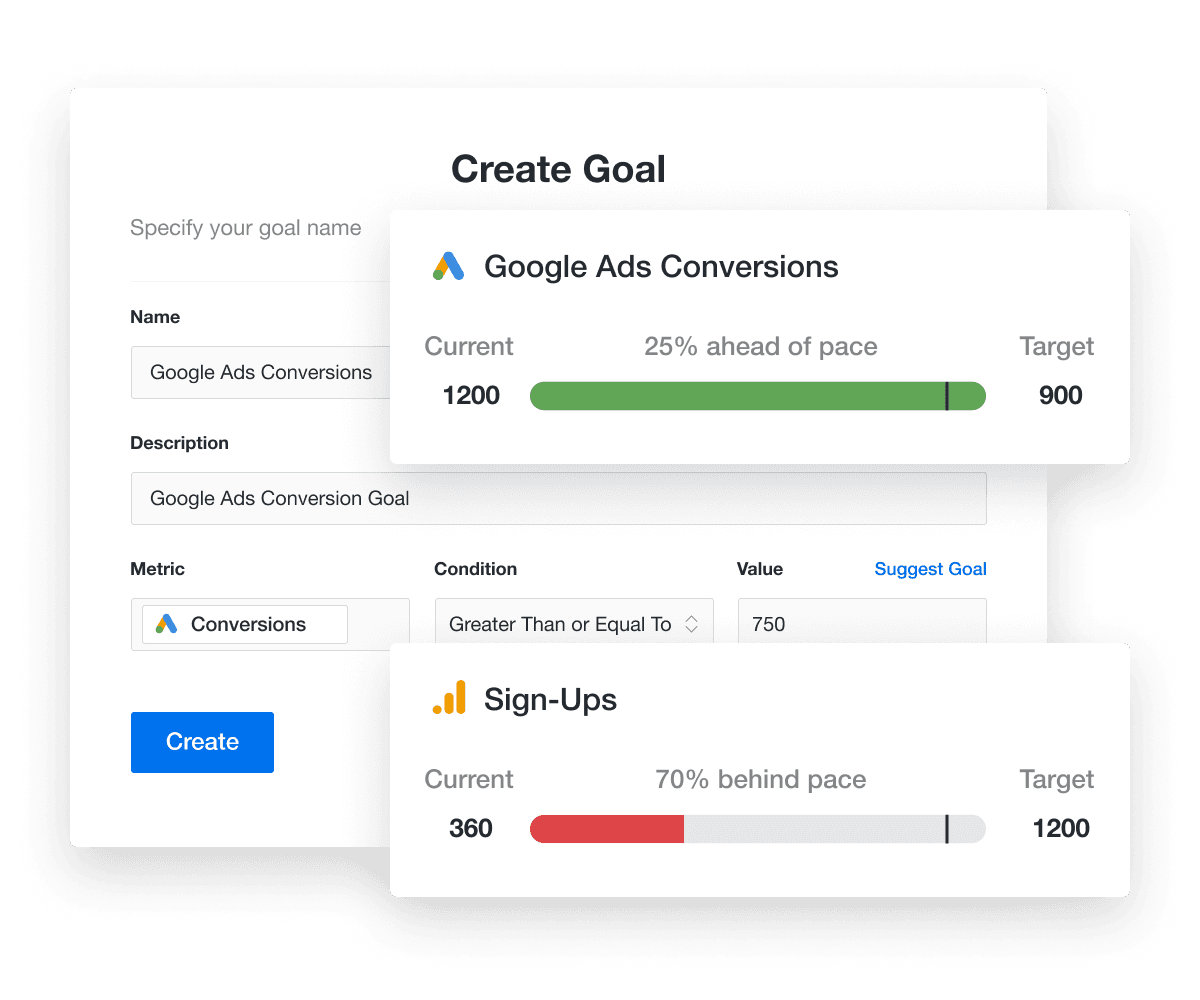
Clearly communicate success in a scalable way. Start your free 14-day trial with AgencyAnalytics today!
How Often Do Clients Actually Read Their Reports?
After delving into the intricacies of agency reporting, a pressing question arises: is all the effort truly worth it? Every detail, every visualization, and every strategic choice made in crafting these reports is ultimately made to ensure the clients reach their goals. But how often do clients engage with their reports?
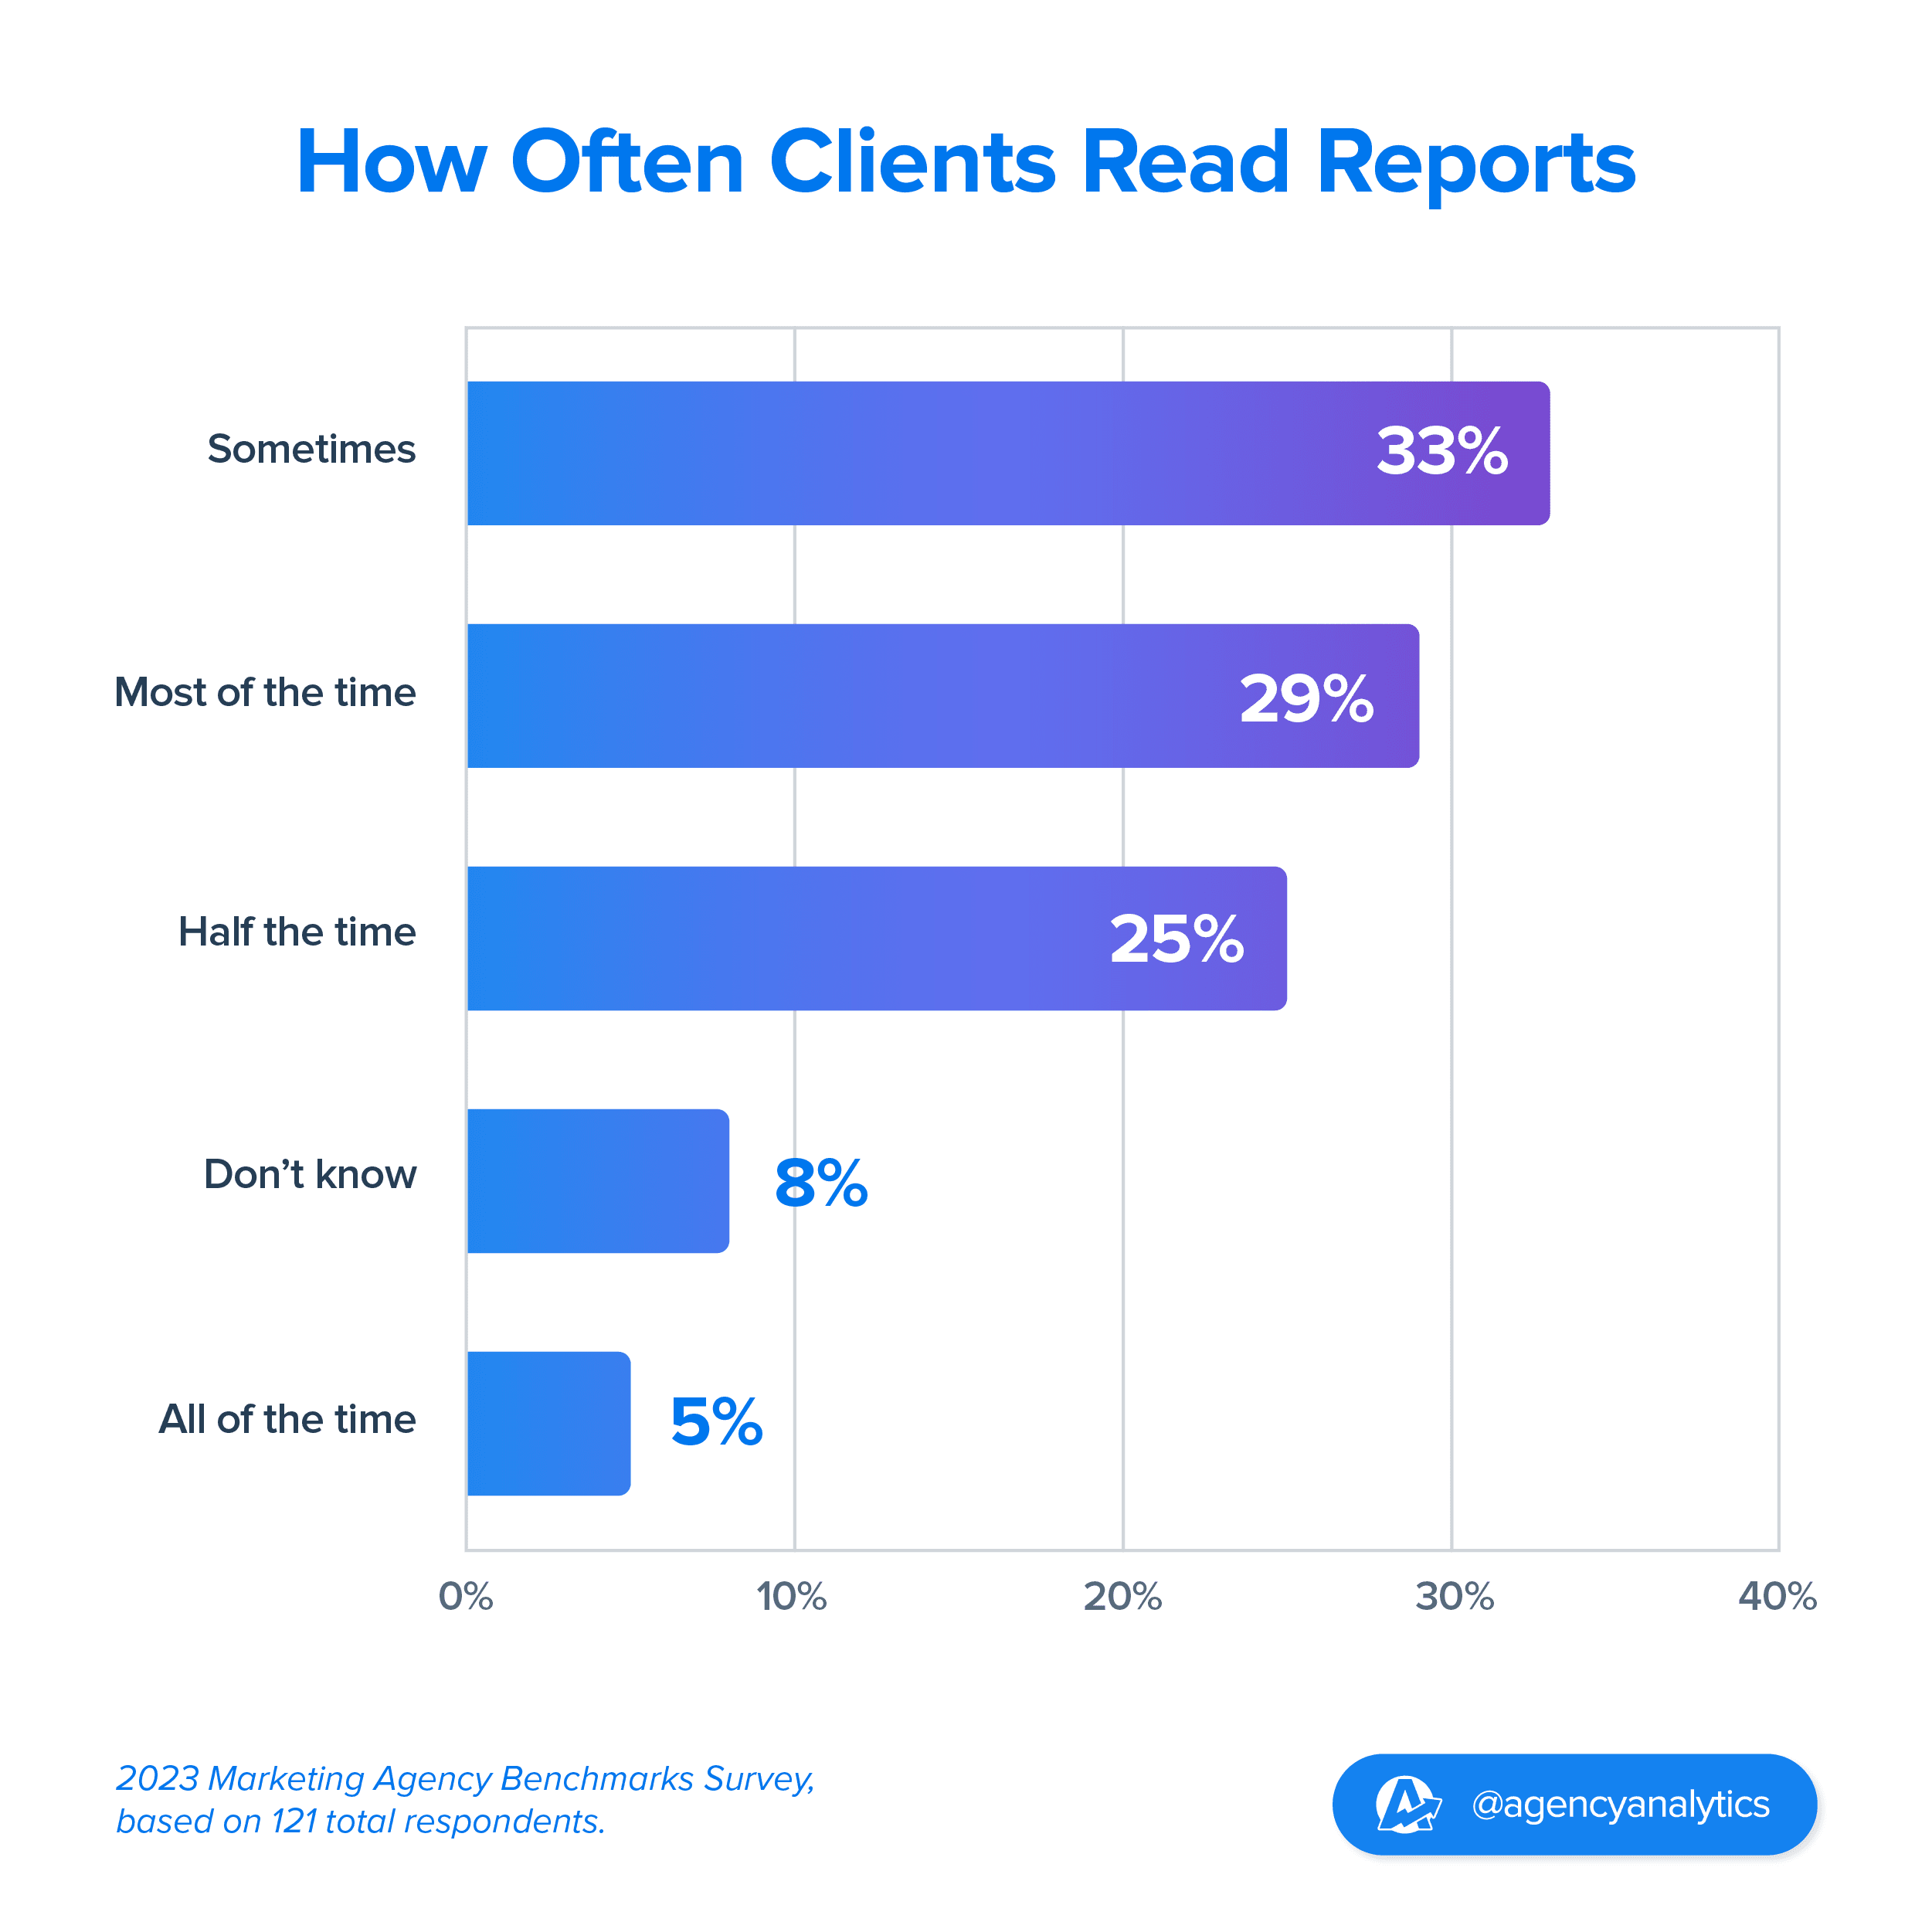
Diving into the data, we get a revealing glimpse into client engagement with agency reports:
Only 5% of clients read their reports all of the time
29% of clients read their reports most of the time
25% of clients read their reports half the time
33% read their reports only sometimes
8% of agencies don’t know how often their clients read their reports
With only 5% of clients consistently reading their reports every single time, this poses a challenging question for agencies: are they potentially allocating too much time and resources to sections or details that the vast majority of clients might be overlooking?

If only 5% of an agency’s clients are fully engaging, it's crucial to ensure that the report's content is laser-focused on delivering maximum value in the shortest time.
💡Ask yourself: Are there elements in your client reports that are too dense or technical? Is there a possibility of streamlining the content to focus on what truly matters?

A significant portion, nearly a third, engage with their reports most of the time. This suggests a consistent interest but also indicates room for improvement in making reports more compelling or relevant.

A quarter of agency clients engage with their reports about half the time. This observation mirrors AgencyAnalytics' usage statistics with an average open rate of 54% for client reports.

The sizable group of clients who only "sometimes" engage with reports suggests a couple of potential dynamics at play:
Delayed Results: Clients might be reviewing reports that focus on long-term strategies, like SEO campaigns. Even if the initial metrics are promising, the tangible results of such campaigns often manifest over extended periods. So, while they see positive web metrics now, the significant ROI might only become evident in subsequent reports.
Trust in Agency Expertise: This sporadic engagement could also be a testament to the clients' trust in their agency. If they're confident that the agency consistently delivers value and ROI, they might not scrutinize every detail in the report. Instead, they rely on the agency to highlight any critical points or areas that require their attention.
Lack of Engagement: A sudden decrease in client interaction with reports can be an early indicator of churn. To help agencies identify potential client churn early on, AgencyAnalytics offers a feature that tracks report open rates.
While 8% of agencies are unsure about their clients' report engagement, using AgencyAnalytics eliminates this guesswork. The only exception is if agencies opt to send reports as PDFs, missing out on the platform's tracking. Leveraging this feature ensures agencies stay informed about client engagement.
Building a Foundation of Trust and Transparency
In this comprehensive exploration of client reporting benchmarks, we've delved deep into the practices, efficiencies, metrics, and best practices that shape the way agencies communicate with their clients–and ultimately retain them.
Client retention is key to the success of our business. We are able to provide our clients with insightful, accurate, and detailed reports that showcase the value we bring to their business. This level of transparency and clear communication helps build trust and strengthen our relationships with clients, which in turn leads to higher levels of client retention.
Adam Binder, Founder + CEO, Creative Click Media
Clarity in client reporting isn't an option; it's a must. Each report should serve as a straightforward communication tool that spells out the results and their impact on the client's business.
Delivering a standout report once is great, but what really cements trust is consistently providing reports that are both insightful and easy to digest, time and time again. In doing this, you're not only providing data but also creating a routine that your client can rely on. Whether it's a weekly summary of KPIs or a monthly deep dive, consistency in both timing and format takes the guessing game out of the equation for clients.
We have heard from hundreds of agencies through the 2023 Benchmarks surveys, G2 reviews, and feedback provided to our customer support team. Client reports aren't merely transactional documents. They're significant touchpoints that influence how clients perceive your agency's value and reliability. Clear, frequent reports tell your clients, "We know what we're doing, and here's the proof." That's a message that not only builds trust but also sets the stage for a long, fruitful relationship between your agency and your clients.
Through this report, we hope to have provided agencies with valuable insights and benchmarks to refine their reporting strategies, ensuring they continue to deliver value, foster trust, and drive results. To explore the latest findings for the year ahead, check out the 2025 Marketing Agency Benchmarks Report.
Bookmark All Four Parts of the 2023 Marketing Agency Benchmarks Report
Part One - Overcoming Top Barriers To Agency Growth |
Part Two - Marketing Agency Management Insights |
Part Three - Marketing Agency Growth Insights and Future Channel Strategies |
Part Four - Trends In Agency-Client Reporting |
Impress clients and save hours with custom, automated reporting.
Join 7,000+ agencies that create reports in under 30 minutes per client using AgencyAnalytics. Get started for free. No credit card required.
. . .
A big shoutout to all the agencies who took part in our survey. Your contribution goes beyond just insights for thousands of agencies; we've planted a tree on your behalf with Evertreen. Like this report? Join the conversation by sharing your top takeaways on social media and tag @AgencyAnalytics.

Written by
Melody Sinclair-Brooks brings nearly a decade of experience in marketing in the tech industry. Specializing in B2B messaging for startups and SaaS, she crafts campaigns that cut through the noise, leveraging customer insights and multichannel strategies for tangible growth.
Read more posts by Melody Sinclair-BrooksSee how 7,000+ marketing agencies help clients win
Free 14-day trial. No credit card required.


