Table of Contents
Table of Contents
- What Is a Google Analytics 4 Dimension?
- What’s the Difference Between Metrics and Dimensions?
- What Is a Secondary Dimension in Google Analytics 4?
- What Are Custom Dimensions?
- Advantages of Using Custom Dimensions in Google Analytics 4
- Types and Scopes of Custom Dimensions in GA4
- Google Analytics 4 Custom Dimensions Limit
- How to Migrate Custom Dimensions to Google Analytics 4 from Universal Analytics
- How To Use Custom Dimensions?
- Creating a Custom Dimension in Google Analytics 4
- What GA4 Metrics and Dimensions Alone Can’t Tell You
7,000+ agencies have ditched manual reports. You can too.
Free 14-Day TrialDimensions are one of the foundations of Google Analytics 4. But many agencies have a common struggle: there are over 170 dimensions spread across over a dozen different categories–and that’s not even counting custom dimensions!
Using GA4 to its full potential requires a solid understanding of dimensions, but it can be hard to know where to start.
Recently, we covered the most important GA4 metrics to track. This article will cover everything you need to know about dimensions–including what they are, how they work in GA4, and how to implement them correctly–so you can monitor and report on your clients' traffic and performance more efficiently.
What Is a Google Analytics 4 Dimension?
Google defines a dimension as “a descriptive attribute or characteristic of data” that provides much-needed context to your number. Dimensions can describe anything from an event, user, location, source, device, and more.
For example, let’s say someone completes a transaction by buying something from your client’s website. The dimensions for that transaction could include:
User ID
Transaction ID
Browser
Date and time of purchase
Device used
One thing all dimensions share is that they are qualitative, meaning they describe a quality. Another key characteristic of dimensions is they are expressed in words instead of numbers.
For example, the Browser dimension (in the Platform/device category) has a range of potential values, such as Google Chrome, Mozilla Firefox, and Internet Explorer.
Currently, there are 16 categories of dimensions in Google Analytics 4 reports:
Attributes
Demographics
Ecommerce
Event
Gaming
General
Geography
Link
Page / screen
Platform / device
Publisher
Time
Traffic source
User
User lifetime
Video
Each category can be further broken down into a number of different dimensions, making up over 170 dimensions in GA4.
How Do I See Dimensions in Google Analytics 4?
When you create a new report in Google Analytics 4, one of the first things you’ll usually see is a graph that visualizes the data over a period of time. If you scroll down, you’ll notice that much of the rest of the information is organized into data tables. It’s easy to find dimensions as they usually make up the leftmost column in your reports by default.
What’s the Difference Between Metrics and Dimensions?
As mentioned before, dimensions are qualitative and in the form of text.
On the other hand, metrics are quantitative (which means they are measured by quantity) and always in the form of a number. Basically, anything that’s an average, ratio, rate, or percent is a metric.
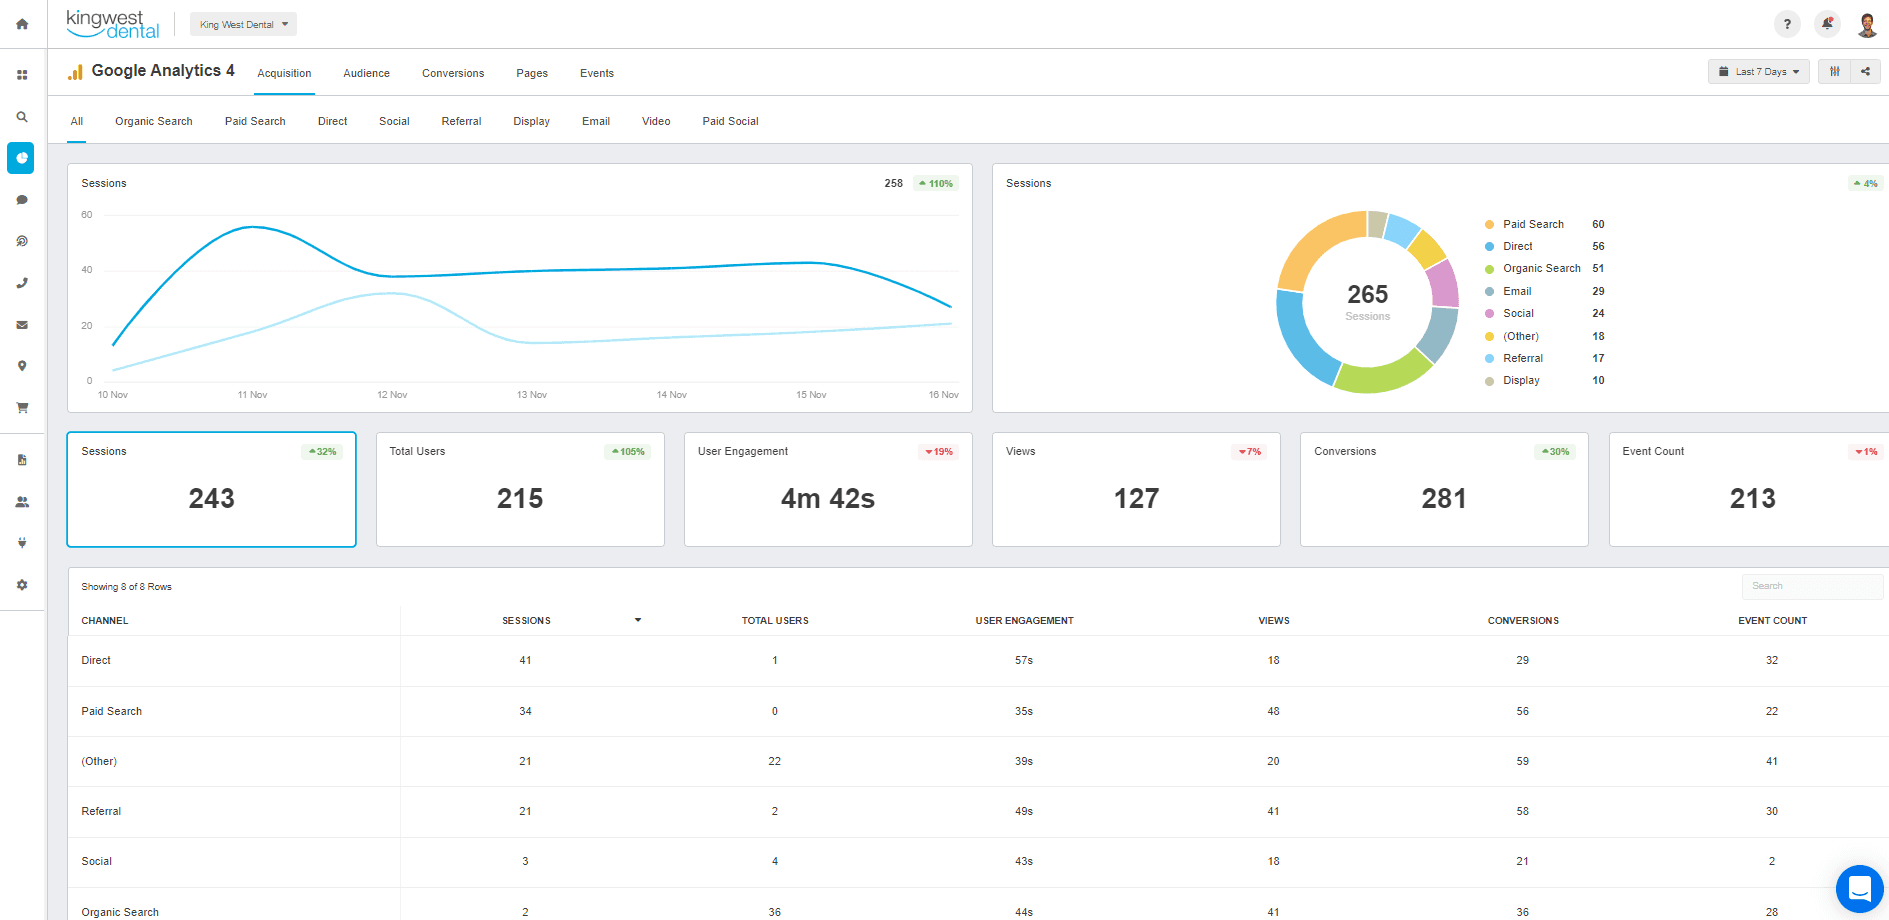
For example, when looking at customer acquisition, the channel names would be the dimensions, and the number of sessions, users, and average engagement time would be considered metrics.
What Is a Secondary Dimension in Google Analytics 4?
A secondary dimension helps you get even more information out of your Google Analytics 4 reports, allowing you to dig deeper into the data through further segmenting or sorting.
Secondary dimensions can easily be added to any report by clicking the ‘+’ button to the right of the primary dimension to further break down your primary dimension by another dimension of your choosing.
For example, let’s say you had Browser as your primary dimension, which lets you see data on how many visitors are using Google Chrome, Mozilla Firefox, Internet Explorer, etc. If you want to see which country used which browser most often to access your client’s website, simply add Country as a secondary dimension, and you will see a breakdown of browsers by country.
How Do I Change the Primary Dimension in Google Analytics?
The primary dimension in Google Analytics 4 comes by default, so you’ll need to add a secondary dimension to dive deeper into the data. For example, if the primary dimension is Devices, then the secondary dimension will break it down into three types.
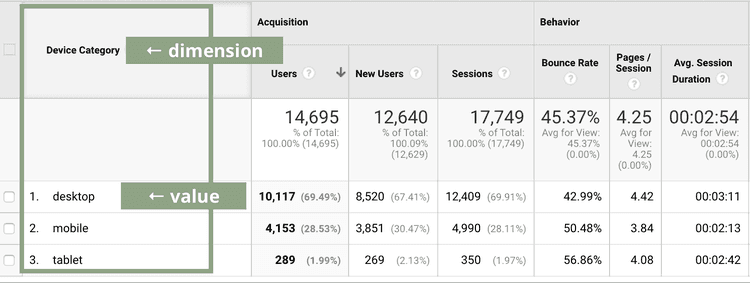
Simply apply more than two dimensions in Google Analytics 4 by adding a ‘+’ sign next to the primary dimension.
What Are Custom Dimensions?
Before we get to the nitty-gritty details of how to create custom dimensions, it's important to understand what they are and how they are used.
While Google Analytics 4 comes with over 170 dimensions right out of the box, it still might not cover everything you need for your clients. Taking a one-size-fits-all approach to digital marketing is doomed to fail, and Google knows this and that’s why they gave us the option to go beyond the default options with custom dimensions as well.
Google defines a custom dimension as “a user-defined descriptive attribute or characteristic of data. Custom dimensions can be used to describe data not included in the default dimensions in Analytics.”
In other words, a custom dimension is one you create yourself because there’s some data you want to track that isn’t automatically covered by Google Analytics. Fortunately, GA4 has made it easier than ever because now, it doesn’t even require any coding (unlike its predecessor, Universal Analytics).
For example, let's say that your client has multiple contributors to the blog and you want a quick and easy way to see the performance by the author.
Use custom dimensions in combination with a gtag to create Author as a custom dimension to populate the key metrics for each writer.
Know Your Role
For any agencies looking to create or edit custom dimensions on behalf of their clients, make sure you have permission first! Only Administrator and Editor roles are able to create or edit custom dimensions, so if you only have the Marketer permissions, ask the Administrator for help.
It's also important to remember that there are limits to the number of custom dimensions that you can create, so don't go too crazy!
Advantages of Using Custom Dimensions in Google Analytics 4
The first and biggest advantage of using custom dimensions in GA4 is you get to measure and monitor data that is more relevant and specific to your client’s businesses and industry. That’s right. No more vanity metrics. This will make a great impression on your clients, especially when you create client reports with Google Analytics, as you’ll have custom-tailored data that you collected specifically for them.
Custom dimensions also give you control over how the data is organized and lets you visualize and leverage that data for strategic insights to drive your marketing strategies. Custom metrics also allow you to integrate data from outside sources (such as data from your client’s SEO platform or CRM) into GA4.
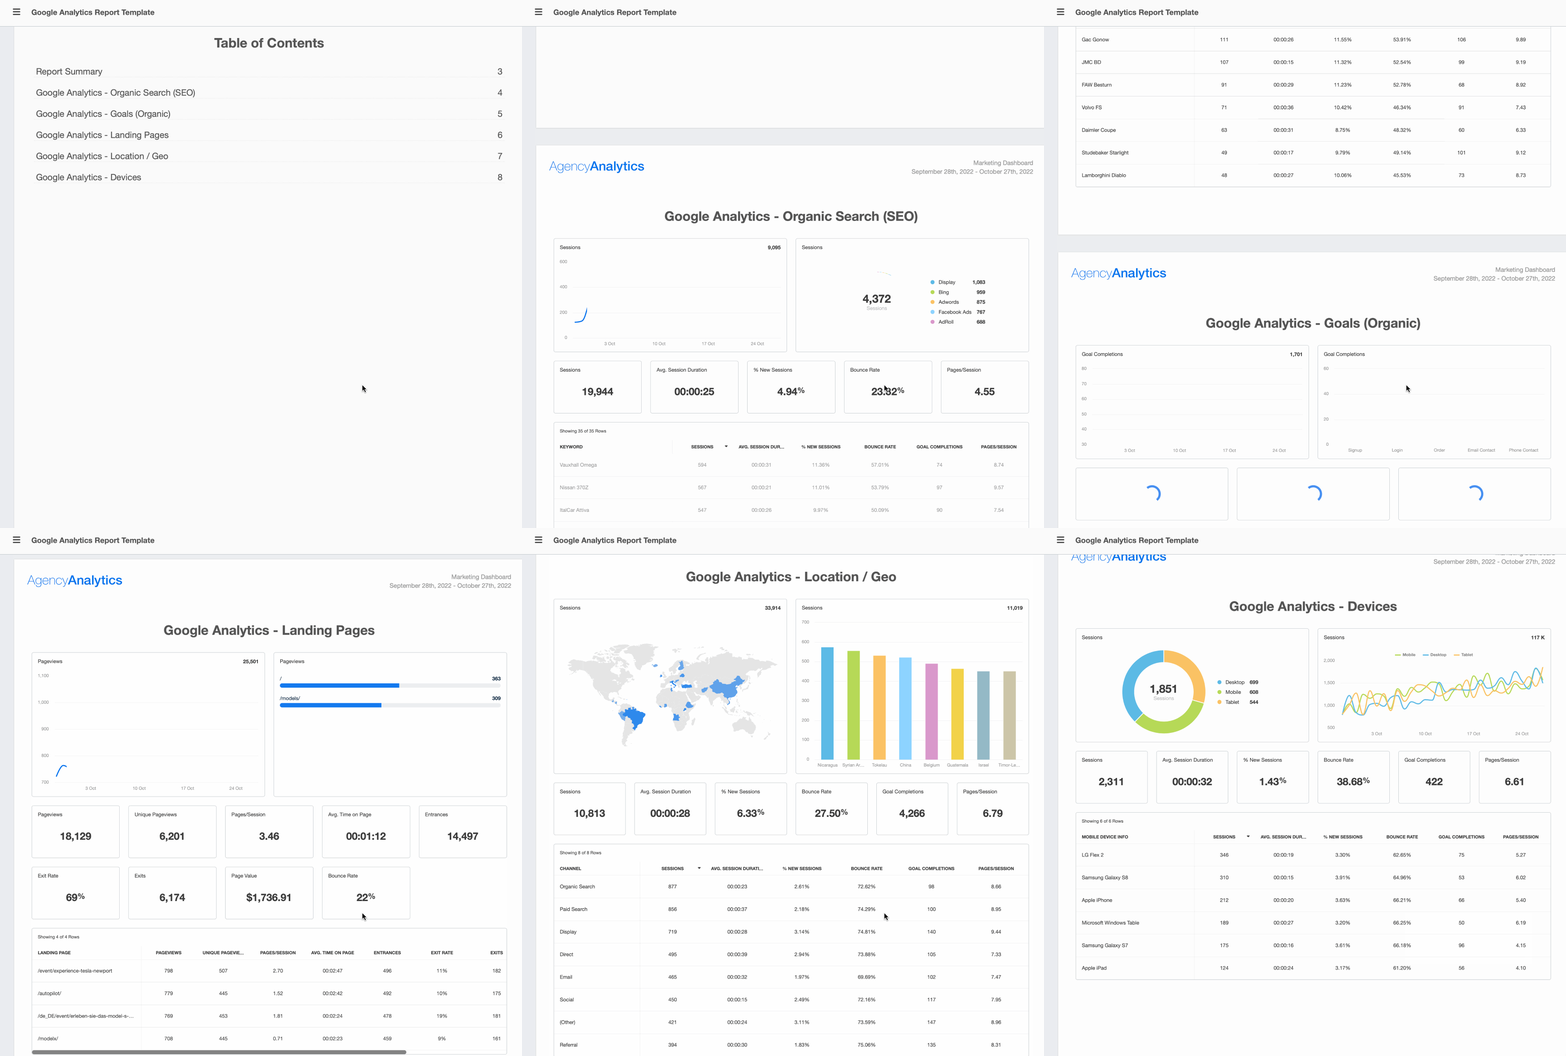
Create client reports that show the full picture of your marketing efforts–in minutes! Start your free trial today.
Types and Scopes of Custom Dimensions in GA4
Scope in Google Analytics 4 refers to how your custom dimensions are defined while also providing a guide for how Google Analytics should collect and organize the data.
For custom dimensions, there are two types of scopes:
Event scope
User scope
So let’s look into these scopes for GA4 custom dimensions.
Event-scoped Custom Dimensions
If you have an event-scoped custom dimension (sometimes referred to as “hit-scoped”), that means that every time an event happens on your client’s website or app, your custom dimension is collected and included in the report.
User-scoped Custom Dimensions
User-scoped custom dimensions are centered around the user and usually do not change very often. This can include things like their marital status, favorite sports team, subscription plan, and user rating.
Google Analytics 4 Custom Dimensions Limit
In Google Analytics 4, there are limits when it comes to creating custom dimensions as it only allows you to create:
Type | Standard Limits |
|---|---|
Event-scoped custom dimensions | 50 |
User-scoped custom dimensions | 25 |
Check Your GA4 Custom Dimensions Quota
Not sure if you’re at your limit? It’s easy to check how many custom dimensions you’ve created. According to Google, all you have to do is:
On the left, click Configure > Custom definitions.
On the top right, click Quota information.
What Happens if I Reach My GA4 Custom Dimensions Limit?
If you’re already at your limit and can’t create new dimensions, you can always archive the custom dimensions you don’t use.
We strongly recommend going through the default dimensions and familiarizing yourself with what’s available before creating new custom dimensions. This is to avoid creating a redundant custom dimension that takes up one of the spots in your quota.
How to Migrate Custom Dimensions to Google Analytics 4 from Universal Analytics
For everyone still using Universal Analytics, we highly recommend switching over to GA4. The writing’s already on the wall for UA as Google announced Universal Analytics will stop processing new hits on July 1, 2023, with 360 Universal Analytics set to follow suit exactly one year later.
The most important reason to set up GA4 before July 2023 is so that you have historical data to compare your new data to. You won't be able to compare it to historic Analytics data from within GA4 so it will leave a big gap. If you switch after the deadline, you won't be able to show clients MoM or YoY comparison data. -Matthew Pavli, Managing Director at Content Drive
But one of the biggest challenges of migrating to a new system is bringing all of your existing data and processes into the new system, and migrating your custom dimensions from UA to GA4 isn’t exactly a 1:1 translation since you can do a lot more in GA4.
For more information, check out Google’s guide for mapping custom dimensions to GA4 to help you migrate your clients' UA event measurement to GA4.
How To Use Custom Dimensions?
Unlike Universal Analytics where custom dimensions were a side thought, they have become an integral part for all GA4 users, beginners included.
Custom dimensions allow you to send custom data to GA4. To view them in your GA4 reports, you’ll need to register them as a parameter.
Creating a Custom Dimension in Google Analytics 4
In Google’s Support Center, you’ll find detailed instructions on things like how to:
Create a custom dimension,
How to edit a custom dimension, and
How to delete a custom dimension
Before your agency jumps straight into creating or editing custom dimensions on behalf of your clients, you’ll have to check your user role and whether you have permission first.
User Permissions
In order to create custom dimensions, you need to be authorized to make changes at the property level. In GA4, a property is an app and/or website, and each Google Analytics account can have a maximum of 100 properties. For agencies, this usually means that each client is a different property and GA4 tracks their website, app, or both.
The reason why getting permission is so important is that only Administrator and Editor roles are able to create or edit custom dimensions. So if you only have the Marketer permissions, you’ll have to ask the Administrator for help.
Now that’s out of the way, let’s get hands-on and learn how to create and use custom dimensions ourselves.
How To Create a Custom Dimension in Google Analytics 4
Using the ‘Editor’ role:
On the lefthand side bar, click Configure.
Click Custom definitions.
Click Create custom dimensions.
Name your custom dimension (no hyphens, but underscores and spaces are ok).
Select a scope for the custom dimension.
Describe your custom dimension.
Select an event parameter or user property from the list or enter the name of an event parameter or user property you'll collect in the future.
Click Save.
That’s it! Your custom dimension value will be visible within the first 48 hours.
What GA4 Metrics and Dimensions Alone Can’t Tell You
Google Analytics 4 is quite amazing in everything it tracks and monitors. Not only does it give you an overall outlook on how well your client’s sites are doing, but it also helps you evaluate the performance of individual pages.
GA4 is so good at giving you the “who”, “what”, “when”, and “where”, allowing you to capture practically everything and anything that happens on your client’s websites, but the big piece you might be missing is the “why”.
For example, you might find through GA4’s conversion metrics data that a particular page is the best at driving conversions. You notice that it gets a lot of unique views, has a high average time on page, and a low bounce rate. While all that data is helpful, it still doesn’t tell you the reason that page converts so well, leaving you to put on your detective hat to try and find out the WHY behind the user’s behavior.
Go Beyond Metrics and Dimensions
To figure out the “why”, you’ll have to dig deeper into the user’s behavior and we recommend the following tools:
Understand the traffic sources: Not all visitors are created equal, so it's important to understand what drove the user to your clients' websites. This includes the search intent of your client's top SEO rankings, the content of conversion-driving social posts, ad campaign copy, and more.
Get feedback: Use simple and easy-to-complete user surveys to encourage users to provide direct feedback
Heatmaps: See whether people scroll down to the bottom of the page and which buttons are the most popular
Session recording: Also known as “session replays”, session recordings capture the behavior of users in real-time so you can see exactly how they interacted with a page and what did and did not work
GA4 provides robust data for better campaign targeting and analysis. But agencies running marketing campaigns deal with more than just Google for their clients. Integrating all your clients’ metrics from over 80 marketing platforms will allow you to show the full picture of your marketing efforts.
Our client reporting best practices handbook outlines how you need to focus on the metrics and KPIs that clients actually care about. GA4 will help you with that as one of the best web analytics tools out there to help you make sense of the data.
The plus side of GA4 is its sheer number of metrics available. The downside? It's not exactly user-friendly. Use AgencyAnalytics to present your clients’ GA4 metrics in a way your clients will understand.
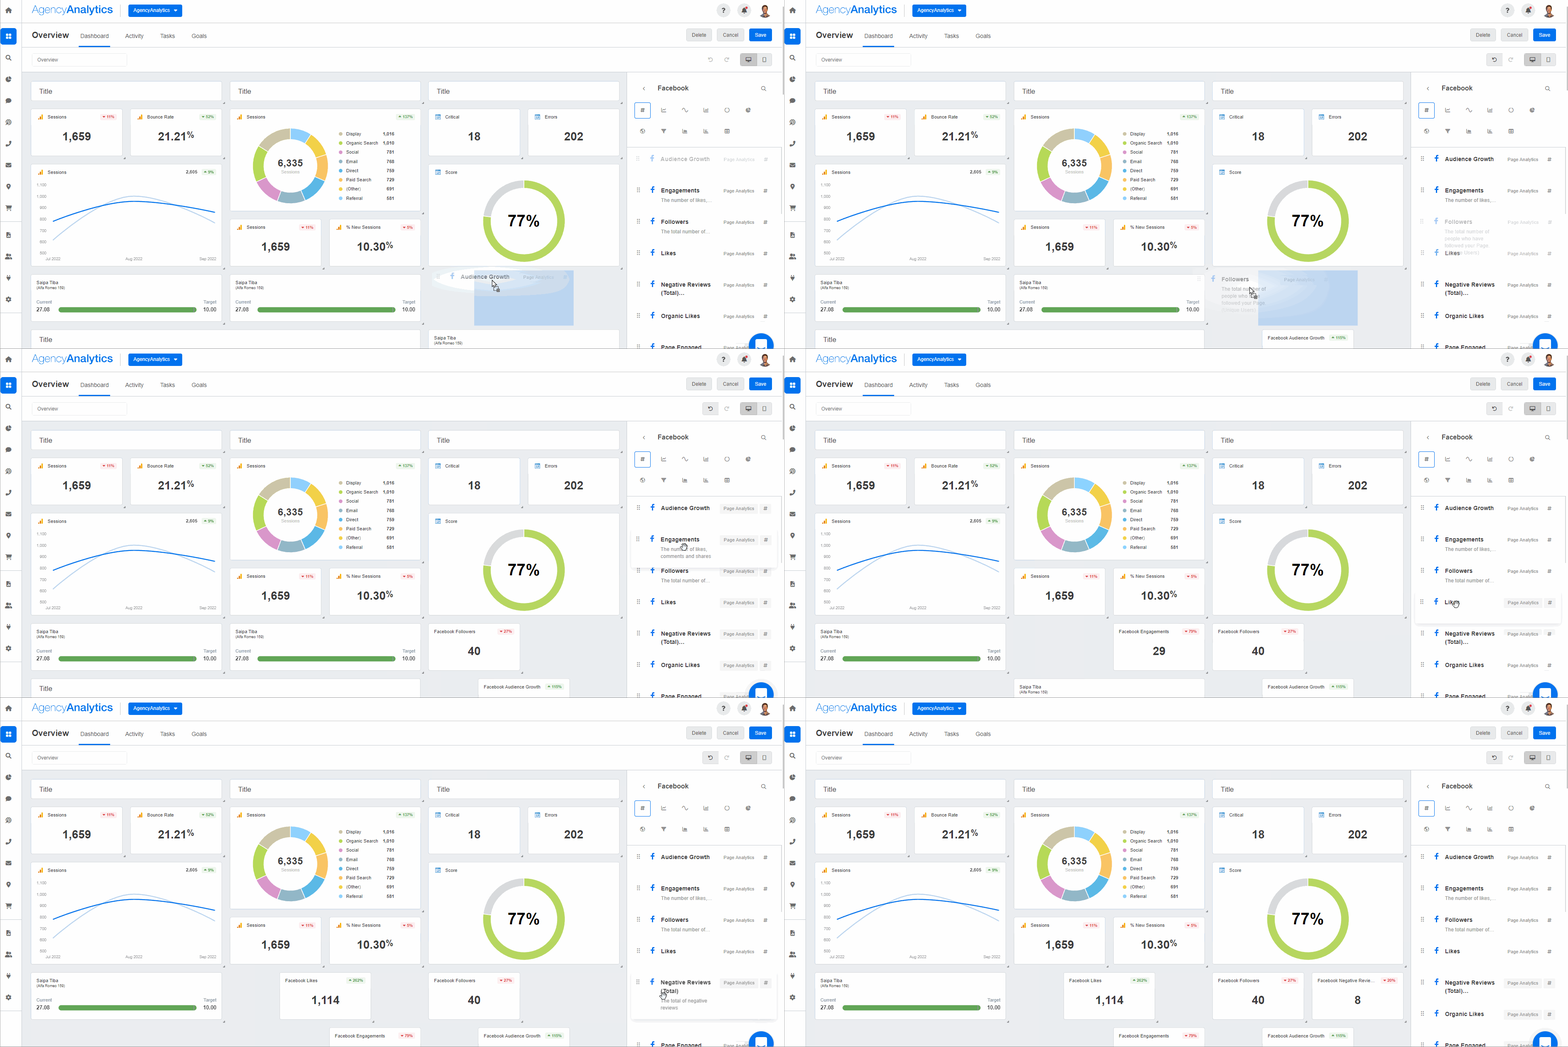
Switching to GA4 will be no easy feat. Make it easier with AgencyAnalytics on the front end with our no-code client reporting software. Start your free 14-day trial today.

Written by
Michael is a Vancouver-based writer with over a decades’ experience in digital marketing. He specializes in distilling complex topics into relatable and engaging content.
Read more posts by Michael OkadaSee how 7,000+ marketing agencies help clients win
Free 14-day trial. No credit card required.


