Table of Contents
Table of Contents
- Important Google Analytics Metrics
- 1. Acquisition report: See which channels bring your most valuable visitors
- 2. Audience report: Understand who the visitors really are (and what they need)
- 3. Conversions report: Track the actions that drive revenue
- 4. Pages report: Identify the content that turns visitors into customers
- 5. Events report: Uncover the on-page interactions that matter most
- Other Types of Reports
- Creating custom Google Analytics reports for clients that turn data into clear insights
- Final thoughts on using Google Analytics for client reports
7,000+ agencies have ditched manual reports. You can too.
Free 14-Day TrialQUICK SUMMARY:
Google Analytics client reporting involves compiling and presenting data in an accessible format, focusing on key performance indicators and metrics like audience behavior, conversions, and traffic sources. This helps agencies and clients make informed decisions with a clear understanding customer behavior. This article delves into 5 quick and effective Google Analytics reports for clients, streamlining client reporting and enhancing the value provided by your agency.
Data matters. Clients want to see the results of their marketing efforts, and they expect clear, actionable insights—not endless streams of numbers that need decoding. That’s where Google Analytics steps in, transforming raw data into meaningful stories about performance and progress.
When it comes to client reporting, there’s no shortage of software, tools, and reports you can use to your advantage.
While experimentation with different reporting and analytics tools is a good thing, there's no question that Google Analytics 4 should be a top priority when it comes to client reporting.
With nearly 30 million live websites using Google Analytics, there’s a good chance it’s the analytics tool of choice for the majority (if not all) of your clients.
There’s only one problem with Google Analytics—many non-technical clients won’t know the first thing about how to use it. As you may know, it's easy for clients to get lost in the numbers and quickly become frustrated.
This is where your marketing expertise comes into play. Once your client's Google Analytics account is set up, the first step in any marketing strategy is understanding referral traffic and how visitors arrive at your client’s site. By creating custom Google Analytics reports, you give every client a clear and intuitive understanding of what’s working and what isn’t, as per your operating agreement.
To get started, the Google Marketing Platform is a great place to find templates for custom reports. With these, all you have to do is name them, connect them to the appropriate account, and let the data populate.
This guide zeroes in on five straightforward reports that deliver the most impact. These reports help explain where traffic is coming from, what visitors are doing on client websites, and how campaigns are converting—all in a format that’s easy to customize and share.
Whether it’s breaking down acquisition sources, audience behavior, or page performance, these reports bring clarity to the conversation. They don’t just answer “What happened?” — they open the door to “What’s next?”
But, before we get into the reports, let's first review a few of the most common and important Google Analytics reporting metrics that you'll want to be aware of.
Important Google Analytics Metrics
First off, Google Analytics metrics can be segmented into the following three categories:
Acquisition
Behavior
Conversions & Events
Let's look at a few of the most important metrics in each of these categories as they'll come up in the 5 reports reviewed below.
Acquisition metrics: See exactly where your best traffic comes from
Acquisition metrics measure your overall website traffic and where you're acquiring visitors from. A few of the most important acquisition metrics include:
Sessions: A session is a group of interactions that a user takes on your website within a given timeframe. The default timeframe in Google Analytics is 30 minutes, so whatever the user does within that period equals one session.
New Sessions: New sessions are defined as the number of first-time visitors—in other words, people who have never visited the site before.
% of New Sessions: This metric is defined as the percentage of sessions by users that had never visited the website before. It is calculated by dividing New Users by Total Sessions
Behavior metrics: Understand what visitors do after they land on a site
Behavior metrics give you an idea of how people are interacting with your website, such as how many pages they view and how long visitors engage with the site. A few of the most important behavior metrics include:
Bounce Rate: Bounce rate is defined as the percentage of total sessions in which users only visited a single page.
Pages per Session: This metric is defined as the average number of pages that users visit during a single session.
Average Session Duration: This metric shows you exactly how long the average user is spending on your website during a single session.
Conversions & events metrics: Track the actions that prove that marketing works
Conversion metrics are set up in Google Analytics as "Goals" or "Key Events" and measure the actions that visitors are taking on your website. Several important conversion metrics include:
Goal Completions: Goals represent a completed activity on your website, such as completing a purchase or submitting a contact information form.
Goal Conversion Rate: The goal conversion rate is defined as the total number of goal completions divided by the total number of sessions, multiplied by 100.
Goal Value: Goal value is an optional metric where you can assign a monetary value to specific goals.
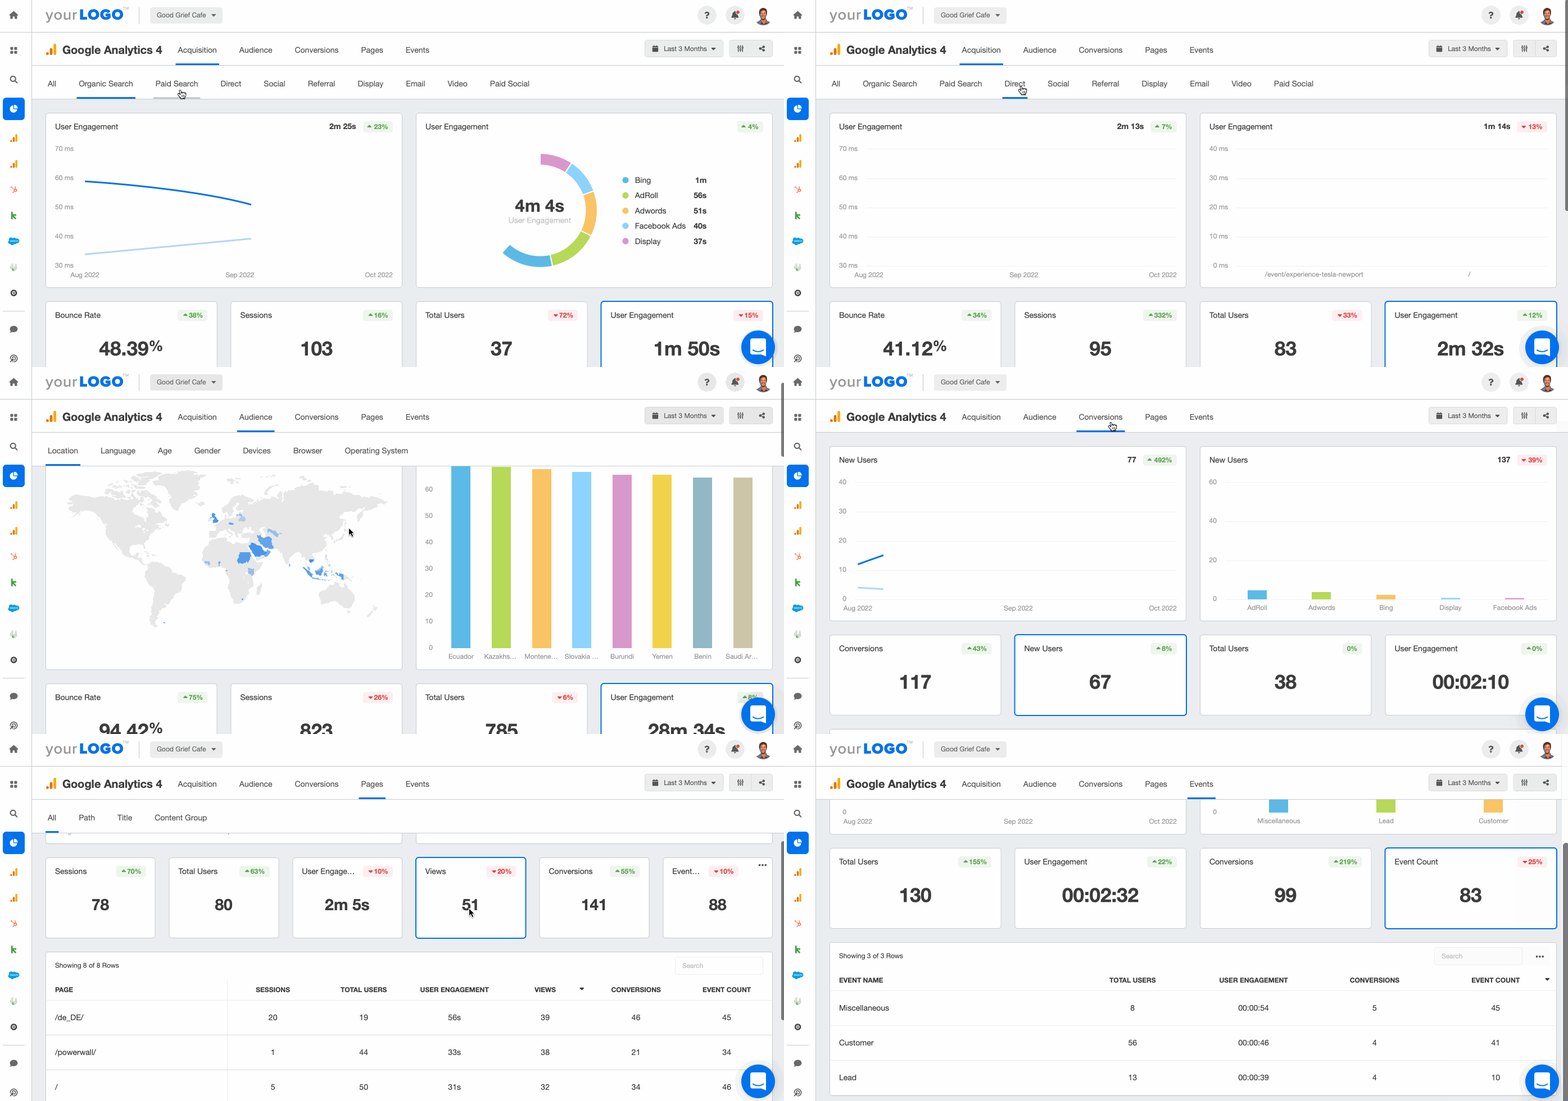
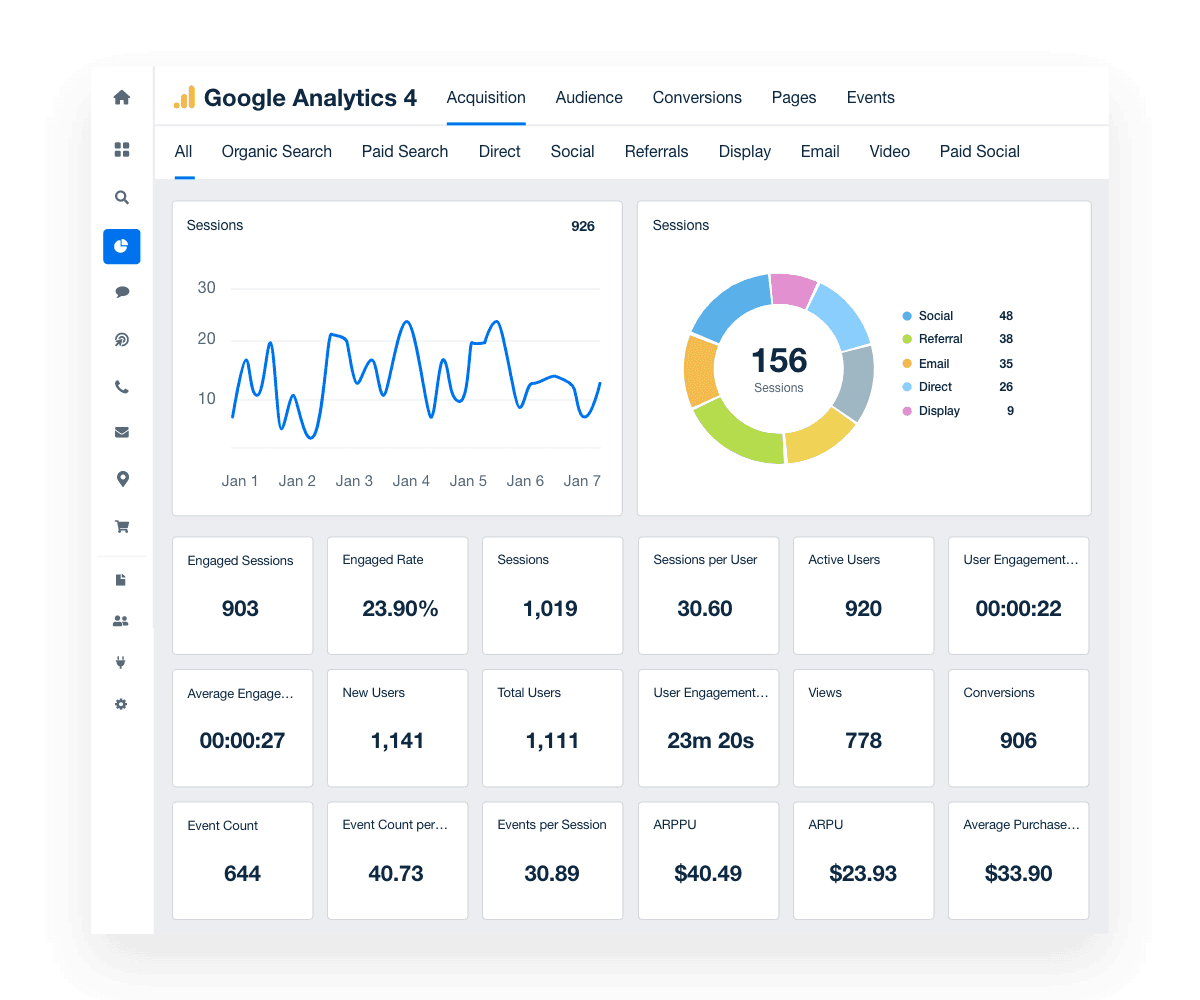
As you can see below, each of these metrics can be displayed using data visualization best practices in a live dashboard using our Google Analytics integration:
1. Acquisition report: See which channels bring your most valuable visitors
Let’s face it—the most important thing that most clients care about is customer acquisition.
A customer acquisition report is designed to show clients where their customers are coming from and what channels are generating revenue for them.
The Google Analytics data shared by a customer acquisition report includes:
Sessions
% New Sessions
Key Events
Bounce Rate
Revenue
Conversion Rate
This data helps both you and the client. From your perspective, it allows you to double down on the acquisition channels that are generating the most revenue while tweaking those that are lagging behind.
Agency Tip: If your marketing strategy includes a significant focus on driving organic traffic through search engine optimization, incorporate other SEO tools (such as Google Search Console, Keyword Rank Tracking, Google Lighthouse, Semrush, or Moz data) into your custom GA report to paint a complete picture of SEO success.
After understanding where visitors come from, the next step is to explore who they are. The audience report dives into demographics and behaviors, offering a clear picture of the people behind the numbers.
2. Audience report: Understand who the visitors really are (and what they need)
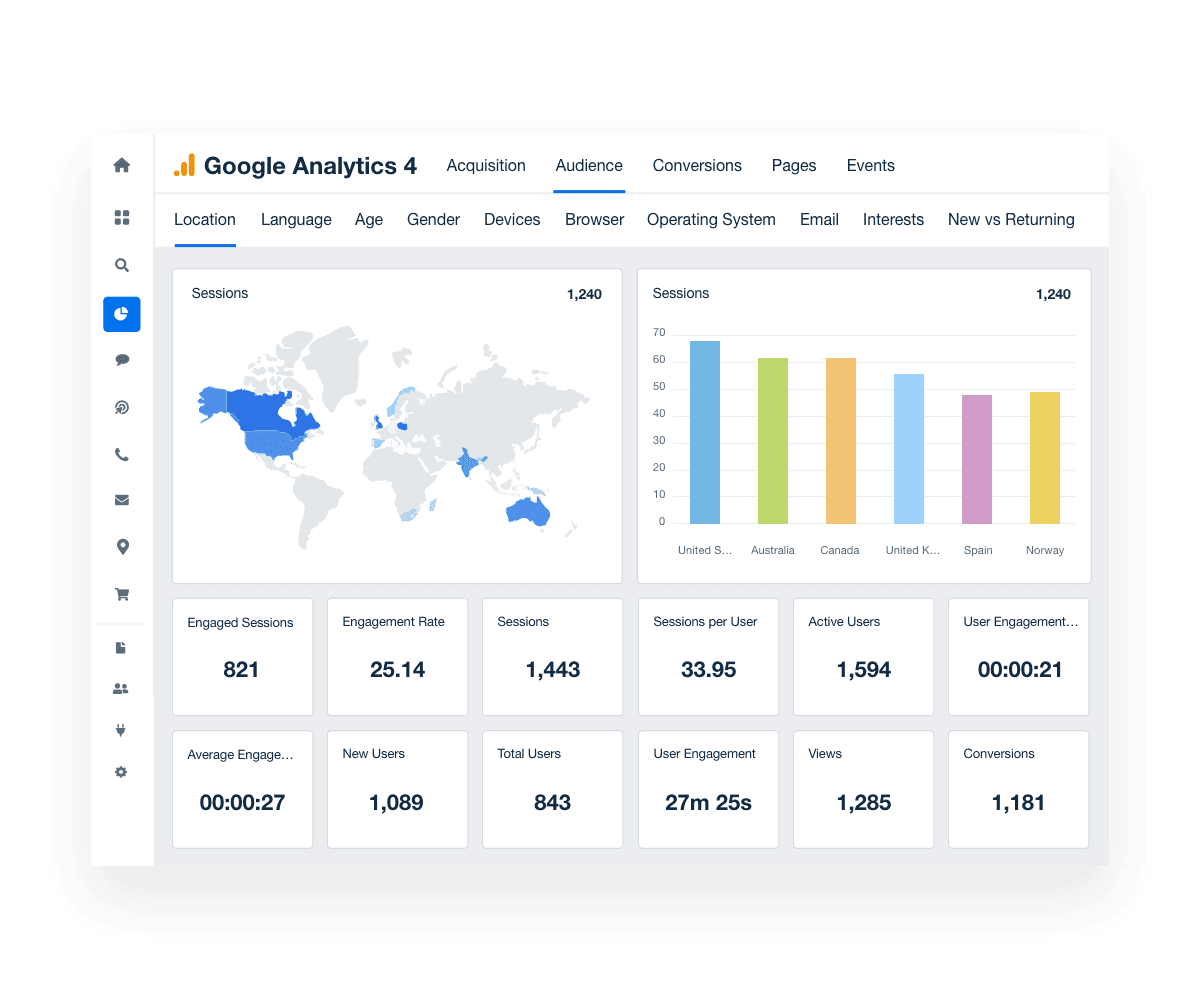
Understanding who visits your client’s website is just as important as knowing how they got there. An audience report goes beyond traffic numbers to give a detailed breakdown of the people interacting with your client’s site.
This report includes insights into:
Location: Where users are browsing from.
Language: The primary language of visitors.
Age and Gender: Demographic breakdowns of your audience.
Devices: Whether they’re on mobile, desktop, or tablets.
Browser and Operating System: Technical preferences that can impact site performance.
Interests: Categories that align with users’ online behaviors.
New vs Returning: The proportion of fresh visitors versus loyal returnees.
For your client, this data creates a clear picture of their audience and can guide decisions like which markets to prioritize, which user experience updates to implement, or how to craft messaging that resonates.
Agency Tip: If the audience report reveals that most users access the site on mobile devices, pull data from Google PageSpeed Insights to evaluate mobile site performance. Slow-loading pages can lead to higher bounce rates, so optimizing for speed ensures the best user experience and keeps visitors engaged.
Knowing your audience is critical, but tracking their actions on the website is where results shine. The conversions report connects audience behavior to measurable outcomes, showing which strategies deliver the most impact.
3. Conversions report: Track the actions that drive revenue
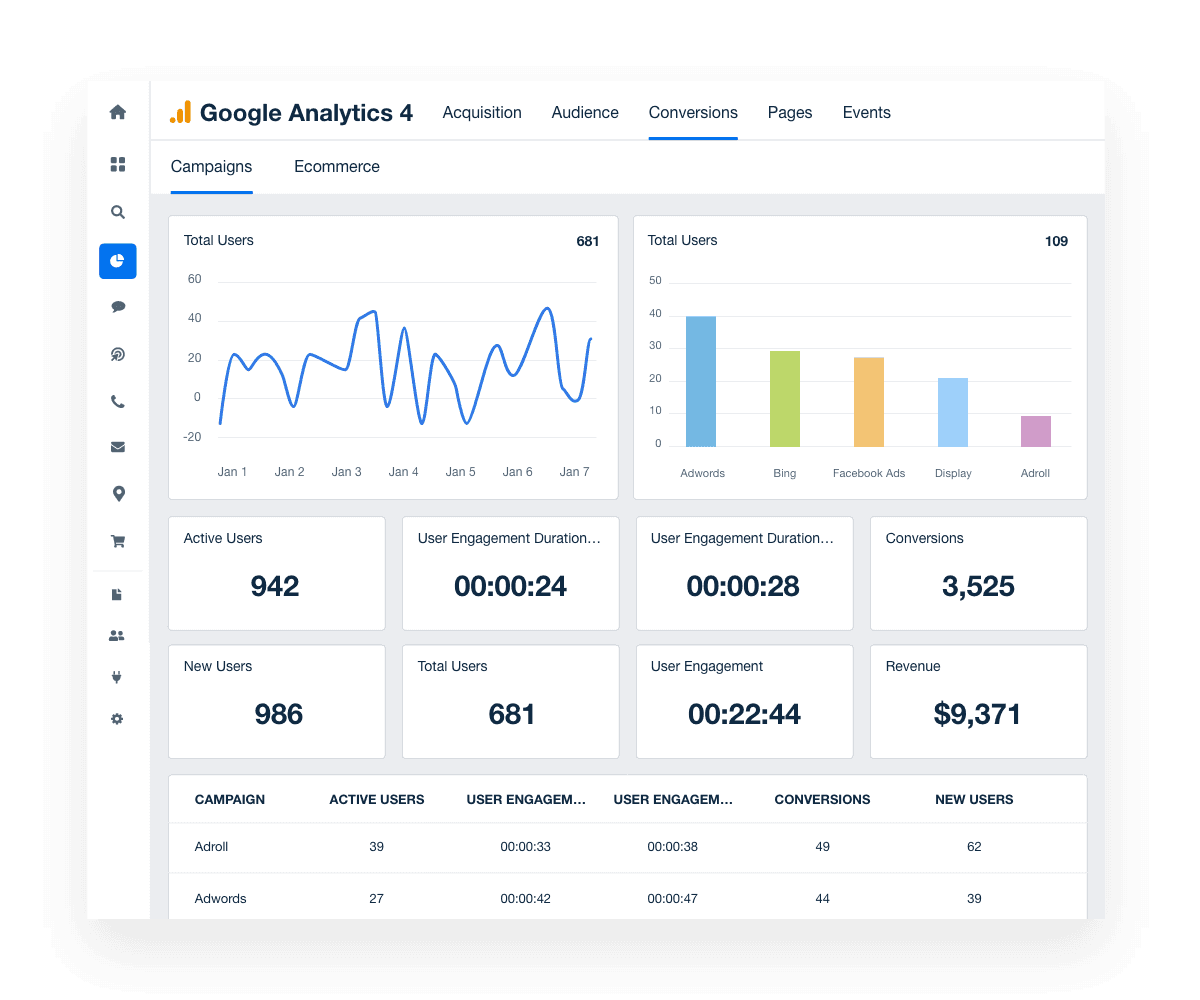
Clients want results, and nothing demonstrates results better than a conversion report. This report connects the dots between website activity and tangible outcomes, showing exactly how campaigns and ecommerce efforts are driving success.
Key insights in a conversion report include:
Campaign Conversions: Tracks how specific marketing campaigns contribute to client goals.
Ecommerce Conversions: Measures transactions, revenue, and key ecommerce metrics.
This data helps identify which campaigns are generating the most conversions, providing a clear ROI story for your clients. For ecommerce clients, it highlights the revenue impact of their website, showcasing which strategies move the needle.
Whether it’s improving underperforming campaigns or capitalizing on top-performing ones, this report keeps client goals front and center.
Agency Tip: If paid search emerges as the top source of conversions, integrate key metrics from a Google Ads report to provide valuable insights into campaign performance. Include metrics like cost-per-conversion, ad spend efficiency, and keyword effectiveness to provide a comprehensive view of how these efforts drive client goals.
Once you’ve identified what’s driving conversions, it’s time to look at how individual pages contribute to success. The pages report highlights which parts of the website engage visitors and guide them toward your client’s goals.
4. Pages report: Identify the content that turns visitors into customers
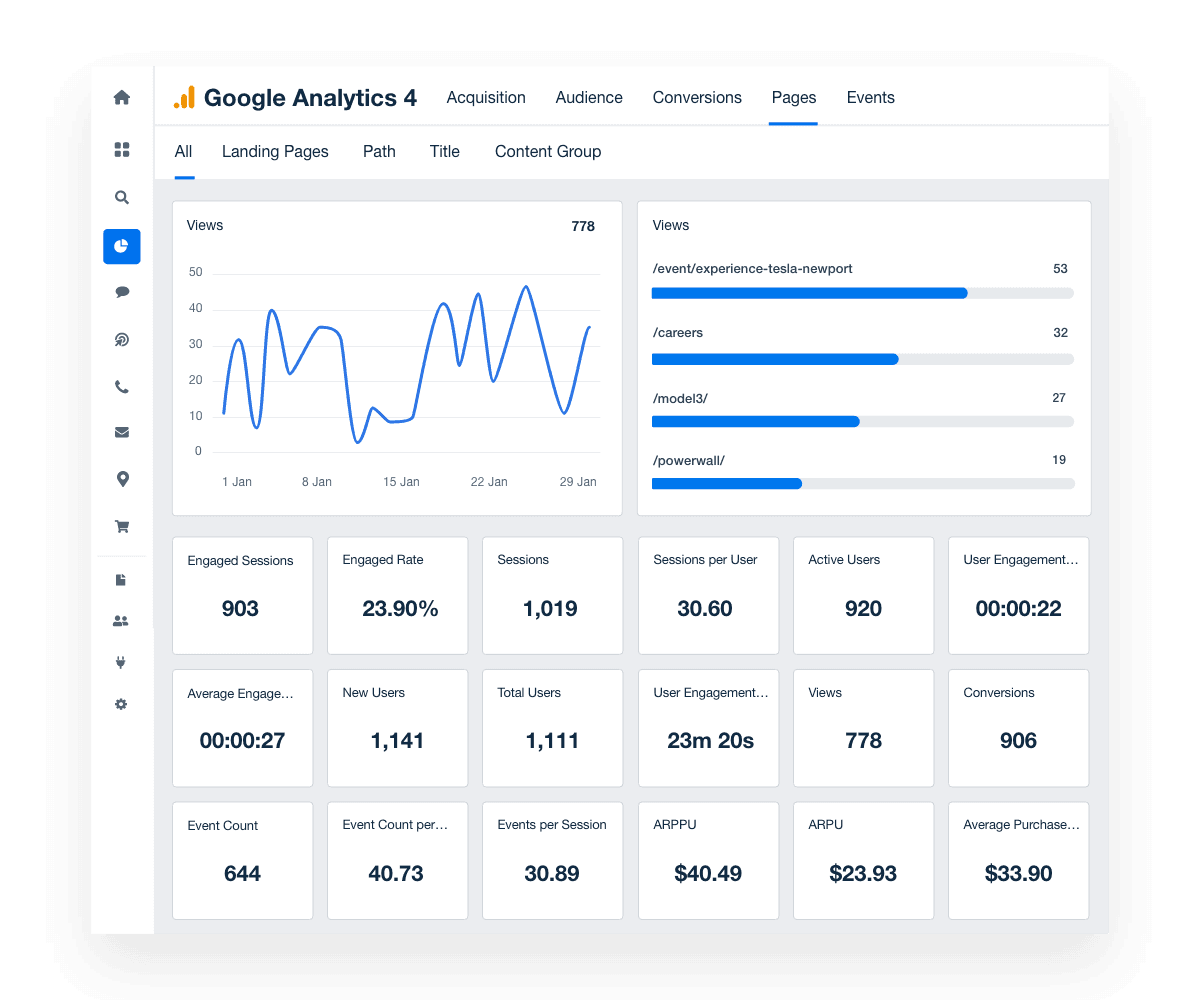
Not all pages on a website are created equal. The pages report identifies the high-performing pages and pinpoints areas for improvement, focusing on:
Landing Pages: The first point of entry for visitors—how these pages perform can set the tone for the entire session.
Path: Tracks the routes users take as they navigate through the site, helping to uncover patterns and potential roadblocks.
Title: Shows which pages are catching attention and driving engagement.
Content Group: Categorizes pages to reveal performance trends by type, like blogs, product pages, or service descriptions.
This report helps your clients see what content engages users the most and how it supports their overall goals, from boosting traffic to driving conversions.
Agency Tip: Tie engagement metrics from your pages report to CRM data to measure the quality of leads generated from high-performing pages. This connection helps clients see the tangible business value of their content and identifies which pages are attracting the most sales-ready prospects.
While pages give an overview of what content performs well, specific user interactions tell the full story. The events report uncovers how visitors engage with key elements, from CTAs to downloadable content.
5. Events report: Uncover the on-page interactions that matter most
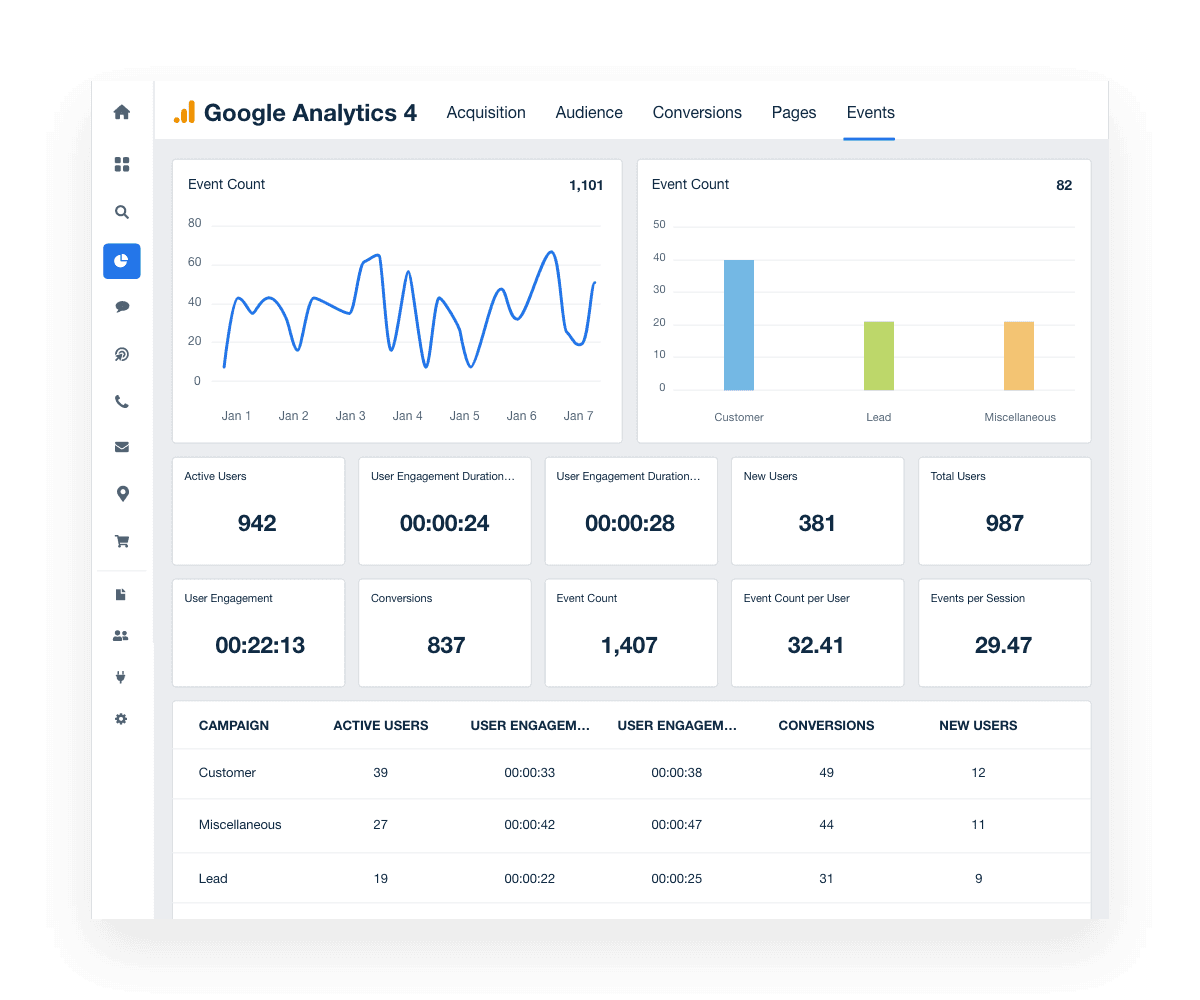
The events report provides a granular look at what actions users take on your client’s website. This report doesn’t focus on page views or traffic; instead, it tracks specific interactions, giving insight into how users engage with content.
Key events often include:
Clicks on CTAs: How often users interact with call-to-action buttons.
Video Plays: Tracks engagement with embedded video content.
Downloads: Monitors when users download resources like eBooks, whitepapers, or guides.
Form Submissions: Highlights completed forms, whether for lead generation or inquiries.
Scroll Depth: Measures how far users scroll on a page, indicating content engagement.
This report helps answer questions like: What actions are users taking? Are they interacting with key elements on the site? For clients, it’s a way to see if their site’s design and content are inspiring meaningful engagement—or if adjustments are needed to boost results.
Agency Tip: When tracking specific user interactions like form submissions or resource downloads, integrate data from a marketing automation platform (such as HubSpot or ActiveCampaign). This allows you to map these key events to lead nurturing workflows, ensuring no valuable interaction goes unnoticed in the sales funnel.
Other Types of Reports
The five reports above give you a solid foundation—but they’re only the beginning.
Google Analytics gives you the flexibility to explore multiple angles of performance, especially when you group insights by strategy. For example:
To evaluate visibility and reach: Google Analytics SEO reports, a keyword analysis report, organic search traffic report, and organic search landing page reports.
To understand engagement: social media reports, customer behavior reports, and content efficiency analysis.
To assess technical performance: browser reports and time-of-day/day-of-week reports.
To optimize revenue: ecommerce traffic reports and PPC keyword reports.
Each of these reports adds a layer of clarity. The key is choosing the ones that match your strategy and highlight the results your clients care about most.
Impress clients and save hours with custom, automated reporting.
Join 7,000+ agencies that create reports in under 30 minutes per client using AgencyAnalytics. Get started for free. No credit card required.
Already have an account?
Log inCreating custom Google Analytics reports for clients that turn data into clear insights
While the five baseline reports are essential for understanding key performance metrics, the real value comes from tailoring these insights to each client’s unique goals. A custom report takes data from Google Analytics and organizes it into a story that aligns with your client’s strategy, focusing on the metrics that matter most to their success.
For example, a campaign-focused client might need a report combining acquisition data, conversion metrics, and ecommerce insights to visualize how specific channels drive revenue. On the other hand, a client prioritizing social media's impact on audience engagement could benefit from a report blending demographic data, behavior metrics, and events like video plays or form submissions.
With multiple Google Analytics accounts to manage, consistency and professionalism become essential. Customizing reports saves time, removes guesswork, and ensures that each one reflects the client’s priorities. Custom reports also help demonstrate the value your agency provides by making data clearer and more actionable for clients.
Using a professional client reporting tool like AgencyAnalytics simplifies this process further. By integrating Google Analytics with data from other platforms, it’s easy to create custom reports that combine insights from SEO campaigns, PPC performance, and more—all in one automated dashboard.
Tailored reports strengthen client relationships by showing your agency’s dedication to delivering insights that lead to better decisions.
Final thoughts on using Google Analytics for client reports
Google Analytics offers a wealth of insights, but its real power lies in tailoring those insights to meet your client’s unique needs. From tracking referral traffic to analyzing revenue-related metrics, the platform provides an essential foundation for data-driven decision-making.
With the right customizations, your client's Google Analytics account becomes more than a tool—it becomes a strategic asset. Whether you're comparing direct traffic to other sources in a channels report or diving deeper into how search engines drive the most traffic, the flexibility of Google Analytics ensures you deliver reports that matter.
AgencyAnalytics takes this a step further by integrating Google Analytics with over 80 other data integrations and 3 of the top data warehouse connectors, making it easy to create a seamless dashboard that combines all your client’s web and campaign analytics into one intuitive view. Use the customizable Google Analytics report template, to simplify client reporting, save time, and focus on what truly drives results.
If your client is using Google Analytics to track and report website traffic, you should be using data visualization software to create custom reports that allow you to measure progress and share results.
Client reporting made easy with customizable AgencyAnalytics report templates
Multi-Channel Report Templates | Platform-Specific Report Templates |
|---|---|


Written by
Richelle Peace is a writer with a degree in Journalism who focuses on web content, blog posts, and social media. She enjoys learning about different topics and sharing that knowledge with others. When she isn’t writing, Richelle spends time teaching yoga, where she combines mindfulness, movement, and her passion for wellness.
Read more posts by Richelle PeaceSee how 7,000+ marketing agencies help clients win
Free 14-day trial. No credit card required.


