Connect custom data sources with database connectors for reporting
Visualize Proprietary Data With Database Connectors
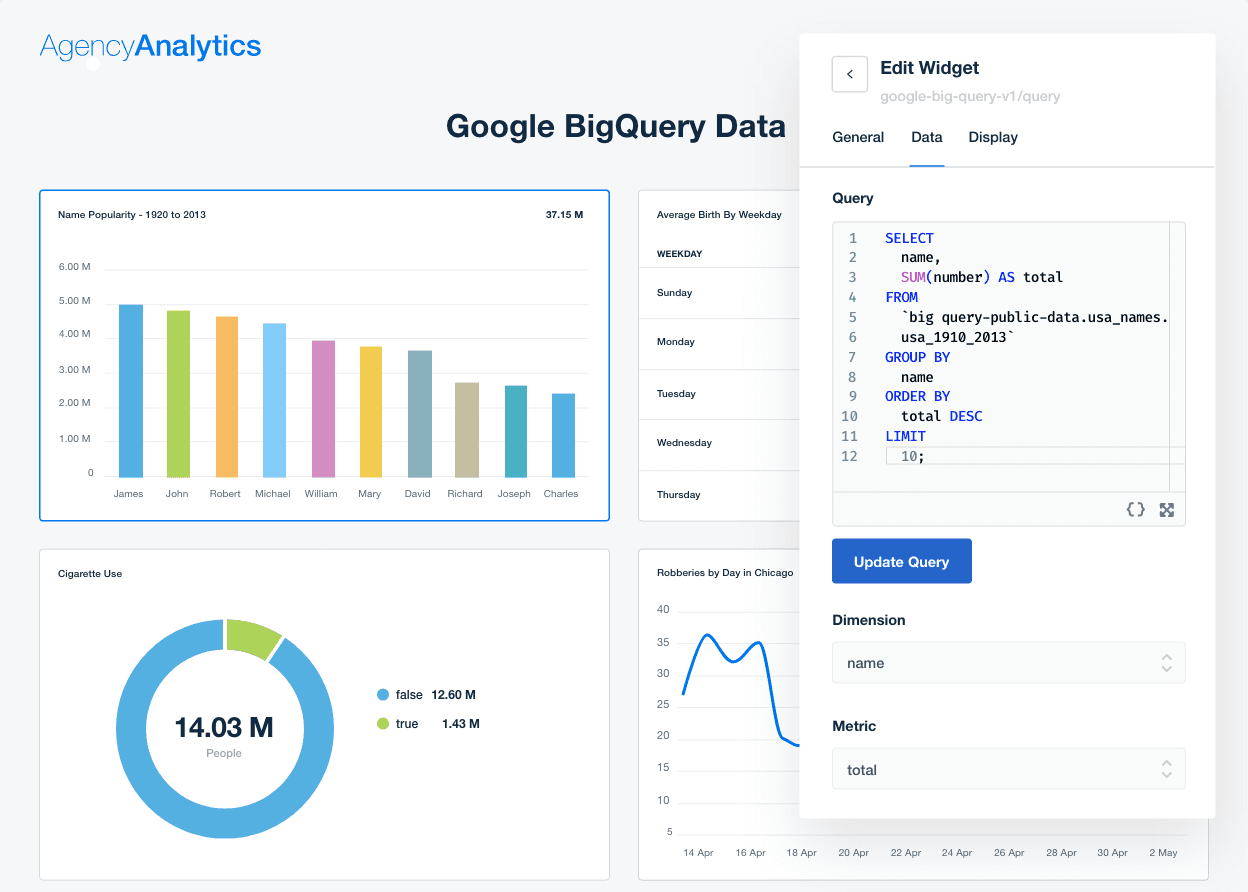
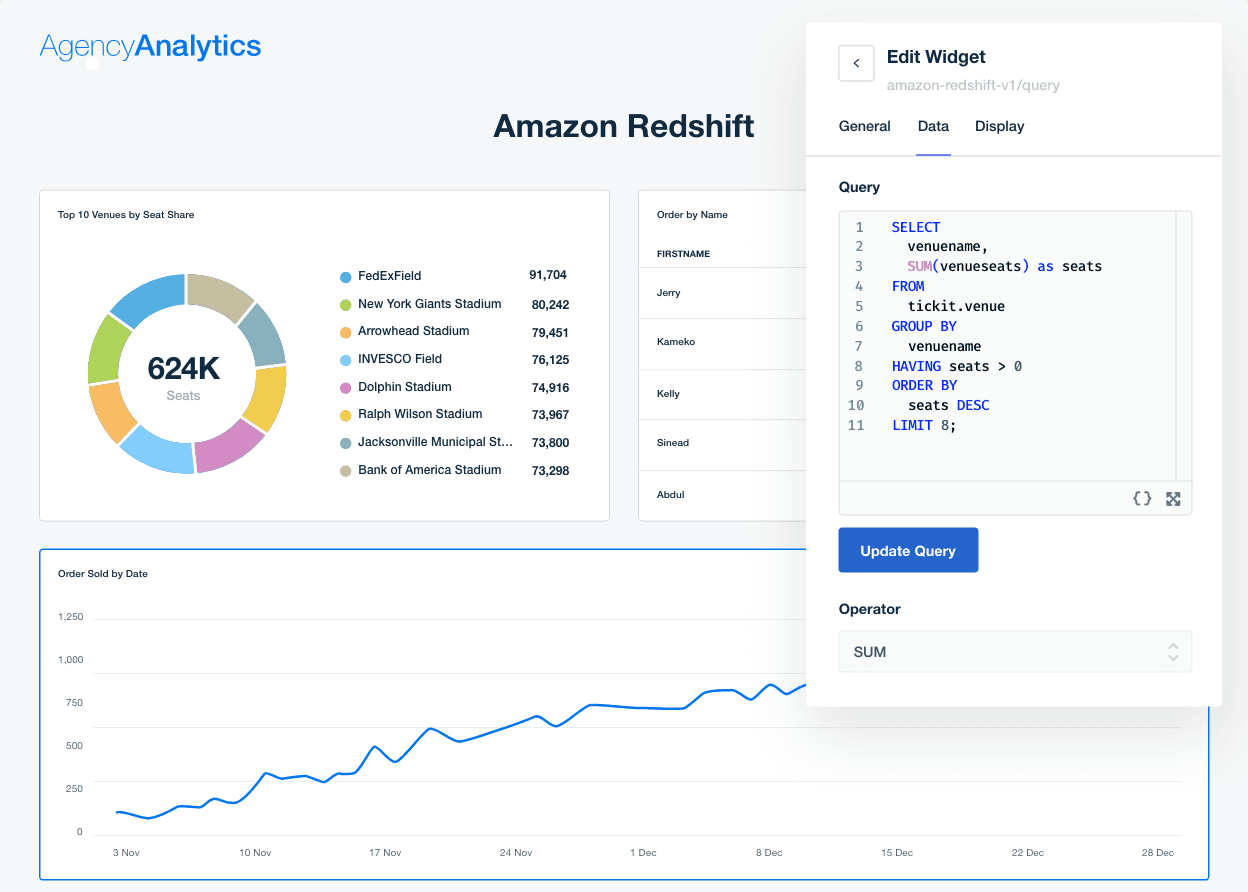
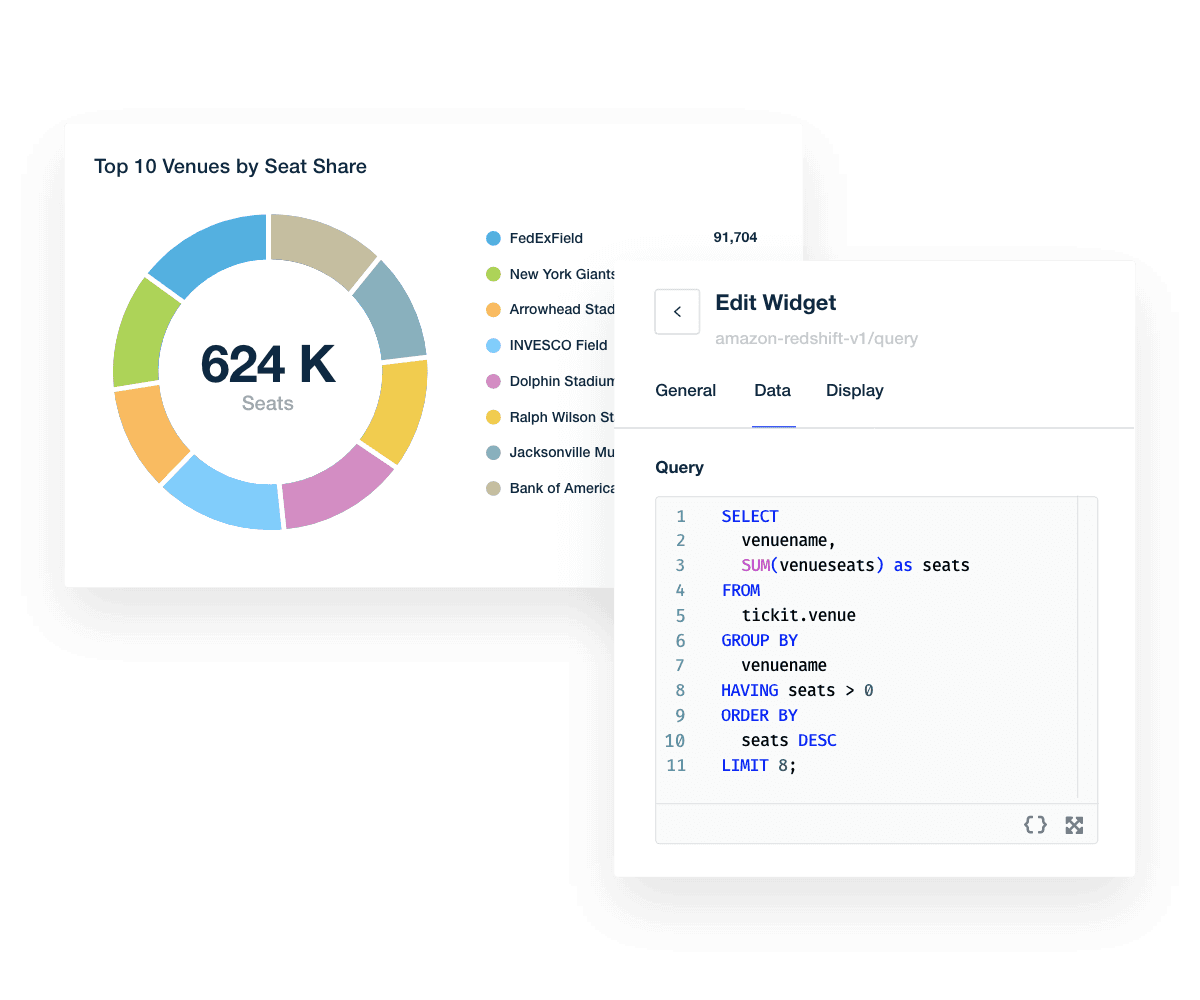
Use optional add-ons to connect live data from MySQL, Google BigQuery, or Amazon Redshift directly into your dashboards. Display internal KPIs and custom performance metrics alongside campaign data to give clients a complete picture—without dev bottlenecks, spreadsheet work, or disjointed reporting.
All Data, One View
Combine proprietary and campaign data in a single dashboard or client report
Always Up to Date
Skip the spreadsheets, dashboards stay synced with your client’s latest data
Track What Matters
Report on marketing agency specific KPIs and client goals with full flexibility
Report Smarter, Faster
Data analysts build the queries and account managers create reports in minutes
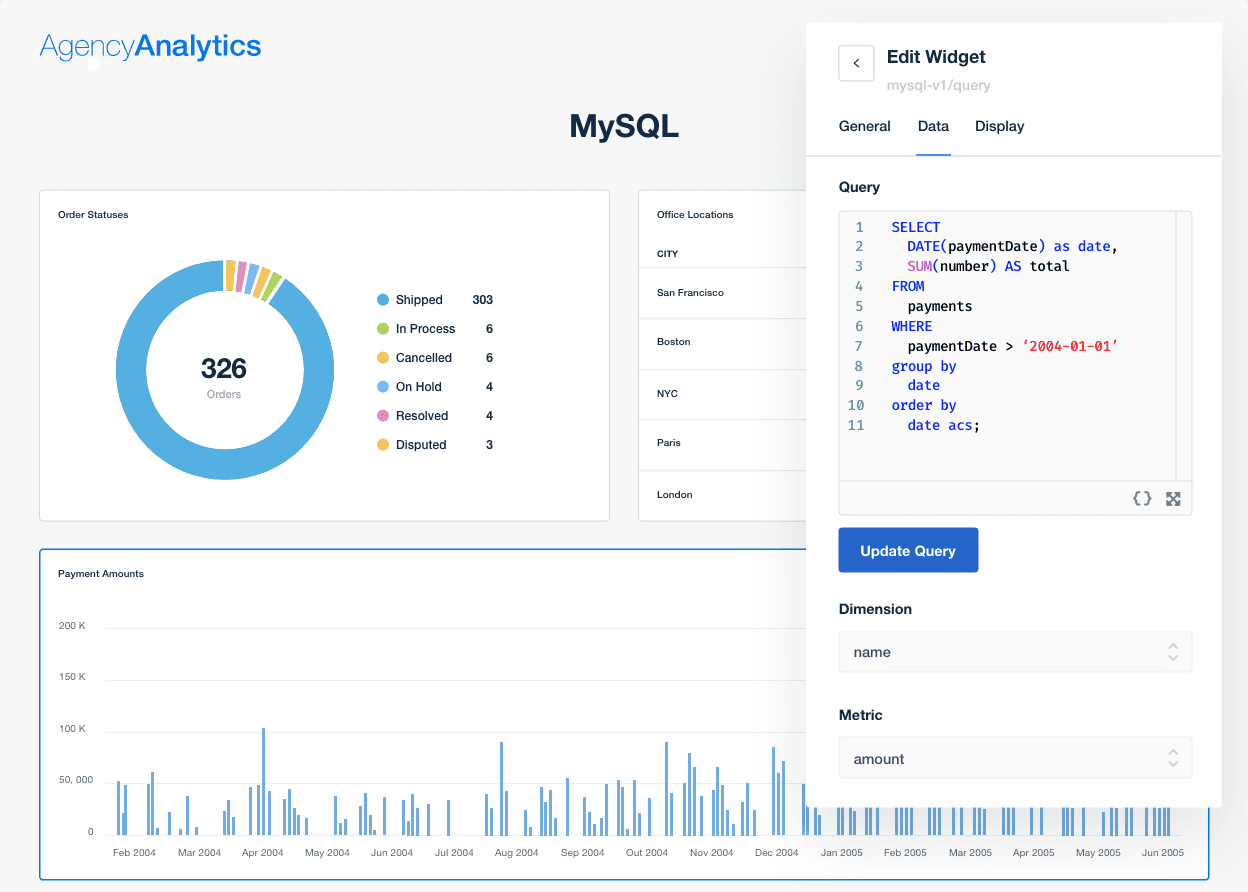
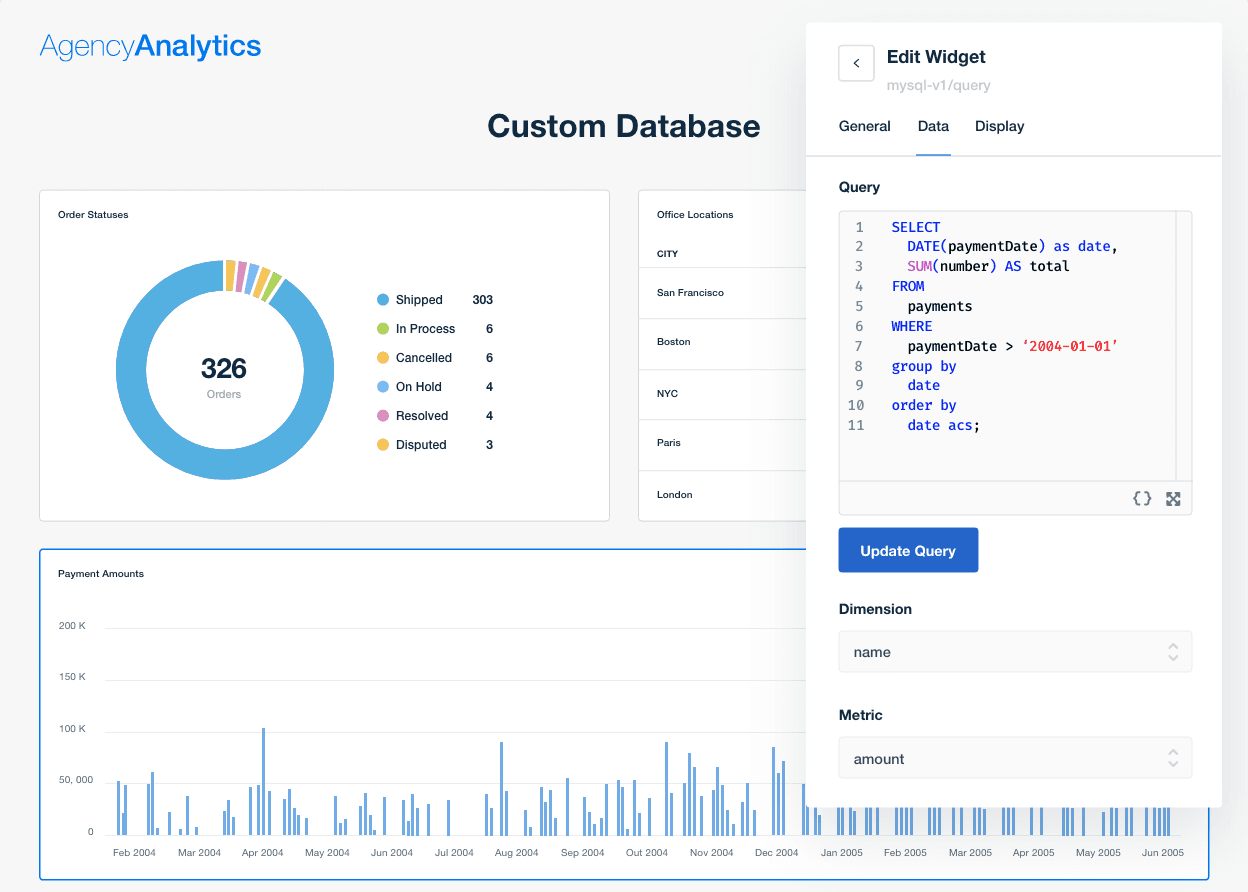
Visualize Custom Data Sets From a MySQL Database
Easily integrate your client or your agency’s internal data—from lead scoring to CRM revenue—using the MySQL connector. Select specific dimensions and metrics, then display them alongside marketing KPIs to give clients a unified view of performance without relying on manual reporting processes.
More features

Smart Reports

Roll-up Table

Digital Benchmarking

AI Reporting Tools

Forecasting Tools
Roll-up Reports & Dashboards
See how 7000+ marketing agencies help clients win
Start Your Trial NowFree 14-day trial. No credit card required.

