FEATURE ALERT: Ask AI to turn client data into actionable insights.
FeaturesRoll-up Table

Monitor Every Client in One View

Say goodbye to time-consuming exports and scattered data. The Roll-up Table gives your agency a real-time, unified view of performance across your entire client portfolio—no formulas, no manual work, no guesswork. Instantly spot trends, monitor client health, and focus your team where it matters most. Think of it as your Monday morning command center. Start the week with clarity, not chaos.
An example of using an aggregated table to monitor performance across a marketing agency's entire client portfolio in one view.

Complete Cross-Client Visibility

Gain a clear view across all your clients at once. Know what’s working, what’s not, and what to do next so you can focus your time where it counts most.

Monitor Performance

View key performance metrics across every client in a single, real-time table view

Compare Trends

Quickly identify top and bottom performers by analyzing trends across your client portfolio

Prioritize Confidently

Spot performance changes early and allocate your team’s time to the clients that need it most

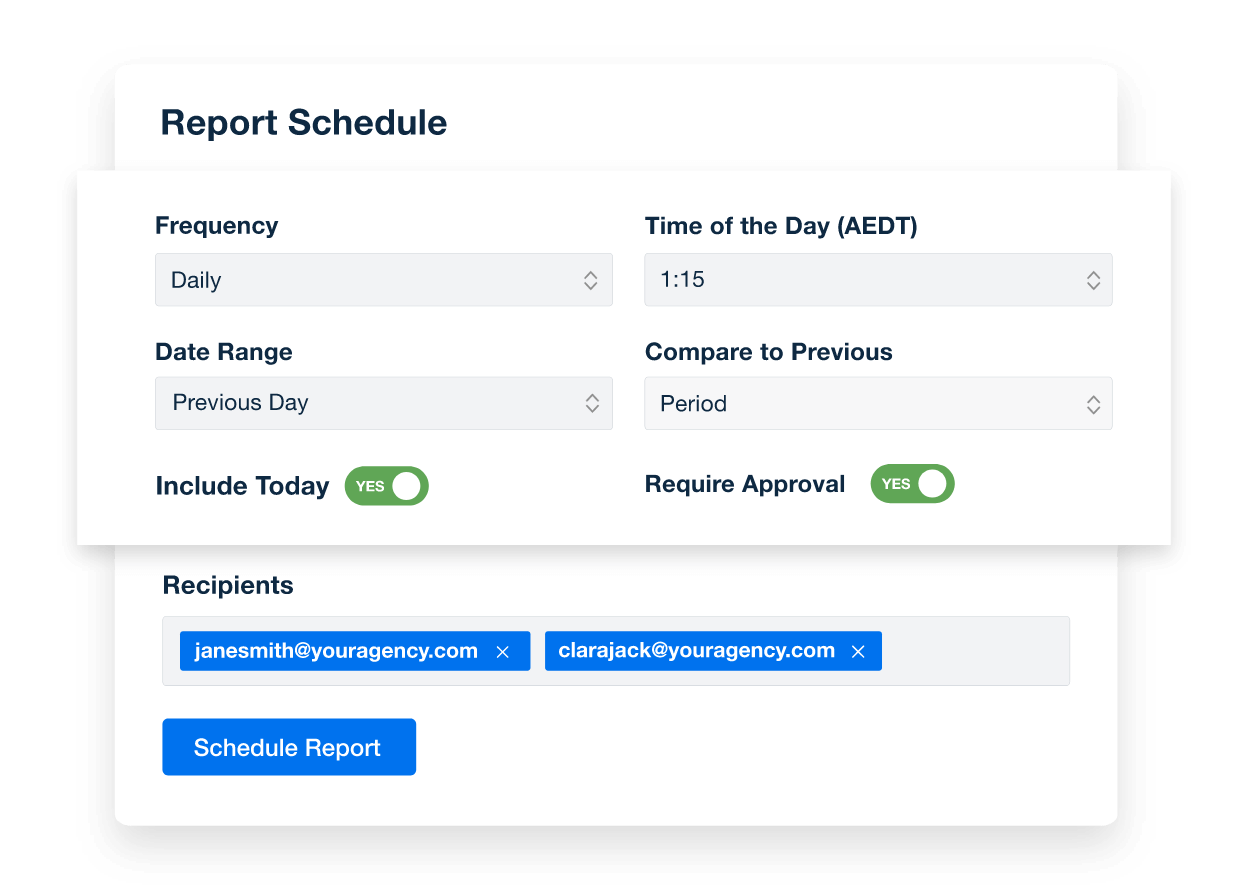
Eliminate Manual Reporting

Save hours by replacing exports and spreadsheets with automatically updated, high-level insights

CENTRALIZED CLIENT PERFORMANCE

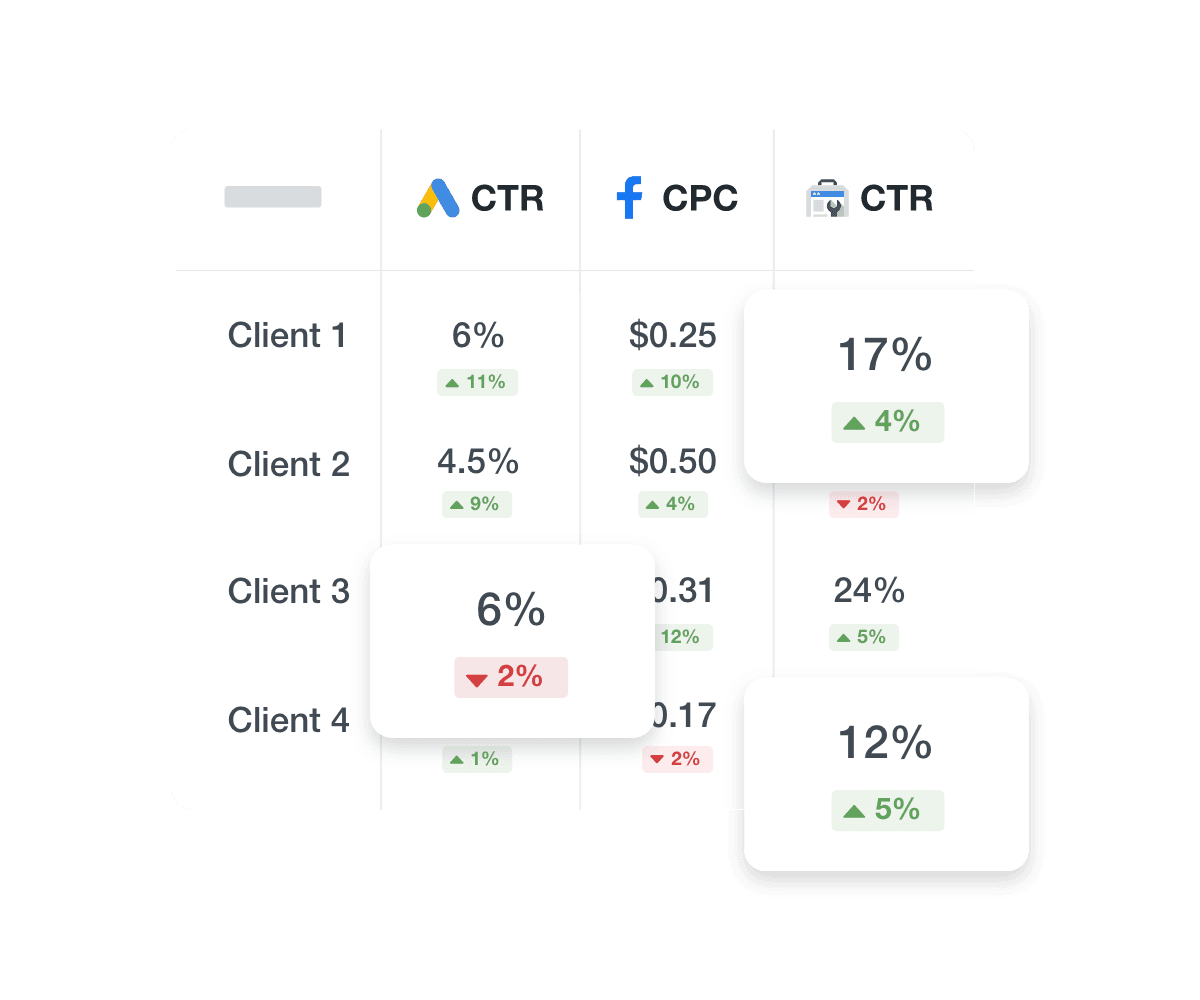
All Clients. One View.

Know exactly how every client is performing—at a glance. With real-time metrics like ad spend, clicks, conversions, and more in one unified view, you instantly compare trends, spot red flags, and prioritize where to act. Even view a roll-up of your performance for groups of clients, making it easy to assess by location, brand, franchise, or industry. No switching dashboards, no clunky spreadsheets, no guesswork—just crystal-clear insight across your entire client portfolio.

Roll-up metric totals and averages across your entire client portfolio
MONITOR TRENDS, MAKE DECISIONS

Spot Which Clients Need Attention Now

With built-in trend comparisons across clients—weekly, monthly, or quarterly—you’ll always know who’s improving, who’s slipping, and who needs attention. This cross-client visibility helps you proactively allocate your time and team resources where they’ll have the biggest impact.

Compare metrics across clients
TIME BACK FOR WHAT MATTERS

Focus on Strategy, Not Spreadsheets

Stop wasting hours exporting to spreadsheets and making manual calculations that are outdated as soon as they’re done. The Roll-up Table automatically pulls in real-time data and displays the key metrics that matter to you—so your team can skip the manual effort. That means more time for strategic, billable work that drives real client performance.

Add the Roll-up Metrics that matter most to your agency for portfolio-wide performance visibility

Access cross-client or multi-location data visibility and comparison in seconds.

Illustration of a user at a marketing agency trying the client reporting features from AgencyAnalytics

Glenn Marvin

Konnector

TheAgencyAnalyticsplatformbeautifullyandsimplyconsolidatesdatafromallthemajorplatformsthatourclientsutilize.Thissavesthem(andus)fromhavingtoreceive,find,orgeneratemultiplereportsfrommultipleplatforms.

Optimize your reporting workflow with automated scheduling for your custom marketing reports. Set your reports to send at regular intervals—daily, weekly, bi-weekly, quarterly, monthly, or annually—and always have the opportunity to add personalized comments and insights before they reach your clients. This strategic automation ensures timely delivery, maintains consistency, and enhances the client experience by providing thoughtful, regular updates on campaign progress.

An example of how to schedule automated marketing reports for marketing agency clients

Discover the white label reporting tool trusted by 7,000+ marketing agencies.

Empower your agency’s brand by customizing all client reports and dashboards with your unique logo and brand colors. This deep level of customization across the platform ensures every piece of client communication is professional and a true reflection of your agency's identity.

An example of how to add your marketing agency's branding to customizable marketing reporting software
Rachel Jackson Wit Digital Headshot

Rachel Jackson, Lead SEO

Wit Digital

IloveAgencyAnalyticsbecauseitreallyallowsustostreamlineeverythingforbothinternalandexternalteams.Thebeautiful,responsivewidgetshelpusdisplaydatatoclientseasilyandhelppaintafullpictureofthedata.Ican’trecommendthissoftwareenough.

More features

Automated Reports

Marketing Performance Insights

Make smart decisions with benchmark comparisons, anomaly detection, and trend forecasting.
White Label Dashboard

Alerts

Get real-time alerts on key metrics to act fast, solve issues, and seize client opportunities.
Client Staff Access

Smart Reports

Smart Reports auto-pull top metrics so you can skip setup and deliver client-ready reports in seconds.
Connect Your Data

Custom Marketing Dashboards

Centralize metrics from over 80 data sources and visualize campaign performance.
AI-Powered

Drag and Drop Report Builder

Drag and drop data from 80+ platforms and build clear, client-friendly reports in minutes.
Goal & Budget Tracking

Client Portals

Strengthen client relationships and simplify reporting with customizable client portals.

Get Started for Free

Try AgencyAnalytics risk-free for 14 days. No credit card required.
AgencyAnalytics Dashboard Preview