Table of Contents
QUICK SUMMARY:
Reporting gives your clients the data; analytics tells them what to do with it. In this post, we’ll break down analytics vs. reporting, their differences, when to lean on each, and how using both together helps your agency assert its value.
Most agency leaders understand the difference between reporting and analytics, but clients often don’t. When they ask for better reports, what they really want is clarity: clear performance data, insights they can act on, and a path forward.
In a nutshell, reporting lays out the numbers. Analytics gives those numbers meaning.
Used alone, each has limits. Reporting without analytics lacks context, and analytics without reporting lacks structure. But together? They give your agency a repeatable system for delivering value and building trust.
In this article, we’ll break down when to use reporting vs. analytics, how they complement each other, and why you need both to retain clients and drive performance.
What is Reporting?
Reporting is your way of organizing KPIs and metrics into a format that’s easy to digest. It’s how you show clients what’s happening without expecting them to sift through complex data sets or act like data analysts.
After collecting data, you’re likely building reports like:
Marketing performance summaries that cover traffic, conversions, and ad spend.
Sales reports tracking leads, pipeline velocity, or revenue.
Financial reports that show budget allocation and ROI.
Ad hoc reports created on demand to answer specific client questions.
Management reports that roll up high-level insights for executives.
Reporting keeps clients informed through summarized data, but stops short of telling the whole story. That’s where analytics comes in.
Still, reporting lays the foundation. It creates a consistent rhythm for accountability and transparency.
Monthly reports tell our clients that what they’re paying us to do is worth the money.
Michael Gasser, Co-Owner & Partner of Squeeze Marketing
What is Analytics?
If reporting gives you the facts, analytics tells you what to do next. While reporting shows what happened, analytics explores why it happened and how to turn that insight into action.
This is where you shift from presenting metrics to performing data analysis—identifying patterns, spotting opportunities, and uncovering actionable insights that will impact performance.
In your day-to-day, analytics might involve:
Spotting underperforming channels and reallocating budget to higher-impact areas.
Flagging anomalies before they become bigger problems.
Segmenting data to understand how different audiences interact with campaigns.
Forecasting outcomes using historical data and predictive models.
Analytics gives you a deeper understanding, helps you make informed decisions, and transform data into strategy.
Reporting vs. Analytics: 3 Key Differences
Both reporting and analytics revolve around data, but they serve distinct functions. Understanding their distinct roles is what separates a reactive agency from a proactive one.
Let’s break down the core differences between reporting vs. analytics first, then explore when to lean on each one.
1. The Purpose
Reporting is about visibility. You’re tracking performance, showing progress, and keeping clients informed. It’s the “here’s what happened” view.
Analytics is about insight. You’re asking, “Why did this happen?” and “What should we change?” It’s where decisions start.
2. How You Work With the Data
Reporting follows a routine. You’re pulling known Key Performance Indicators (KPIs) into dashboards or scheduled reports. It’s clean and structured, ideal for keeping clients updated.
Analytics is exploratory. You’re digging into segments, comparing timeframes, running experiments, and identifying anomalies. There’s more freedom and more complexity.
3. The Outcome
Reporting gives you confidence that the work is being tracked. It’s how you show clients their investment is being monitored.
Analytics gives you leverage. It turns data into direction, helping you optimize strategy and deliver better results, not just updates.
Reporting vs. Analytics
| Reporting | Analytics |
|---|---|---|
Purpose | Shows what happened | Explores why it happened and what to do next |
Data Interaction | Presents clean summaries via dashboards or scheduled reports | Involves deeper analysis (predictive analytics, diagnostic analytics, descriptive analytics, comparisons, and pattern recognition) |
Outcome | Informs clients, builds trust | Drives decisions, strategy, and performance optimization |
Impress clients and save hours with custom, automated reporting.
Join 7,000+ agencies that create reports in minutes instead of hours using AgencyAnalytics. Get started for free. No credit card required.
When To Use Reporting vs. When To Use Analytics
Now that you understand the differences between reporting and analytics, the next thing to understand is when to use each.
Think of reporting as your routine check-in. It’s the consistent, polished summary you send to clients to show performance and progress.
Analytics? That’s your problem-solving engine. It’s what you depend on when something changes or when a client wants to know why something happened.
Here’s how that looks in the real world:
Use Reporting When You Need To:
Keep Clients in the Loop: Whether it’s a monthly update, a campaign wrap-up, or year-over-year trends, reporting gives clients visibility without overwhelming them with data.
Summarize Performance: A CMO doesn’t want to dig through raw data. They want key metrics delivered in a clear and concise manner.
Build Transparency: Consistent reporting, whether through live dashboards or scheduled emails, shows your clients that you’re on top of the work, even when they’re not asking for an update.
Example: You’re managing Google Ads for a retail brand. Before your check-in call, you send a structured report showing key campaign metrics, conversions, and spend. It’s quick to review, and your client walks into the meeting already aligned.
Use Analytics When You Need To:
Answer Client Questions: Your SEO report shows a drop in traffic. Now it’s time to dig deeper: was it a lost ranking? A seasonality shift? A broken link?
Uncover Optimization Opportunities: You compare performance by device and spot that mobile conversions are lagging. That’s a red flag for UX and a chance to fix it before it costs more.
Back Up Strategy With Data: A client wants to cut budget. Instead of guessing, you use analytics to show which channels drive the most efficient results and where reallocating spend could increase ROI.
Example: A new landing page is underperforming. Reporting shows a spike in bounce rate. Analytics takes it further. You dig into traffic sources, check device types, and realize that mobile users are struggling with load speed. That single insight turns into a design fix that improves conversions.
Use Reporting to Spot Issues. Use Analytics to Solve Them
As you build trust through consistent reporting and dig deeper with analytics, the real power comes from combining them into one continuous loop that keeps your agency proactive.
The fastest-growing agencies don’t treat them as separate workflows. They use reporting to monitor performance and analytics to improve it.
Here’s what that loop looks like in action:
Report the Results: Surface what’s working (and what’s not).
Spot the Shift: A spike, a dip, or something unexpected.
Dig Into the Data: Segment, compare, explore.
Extract the Insight: Get to the root cause, not just the surface.
Adjust the Strategy: Confidently, based on evidence.
Report the Impact: Close the loop and show the result.
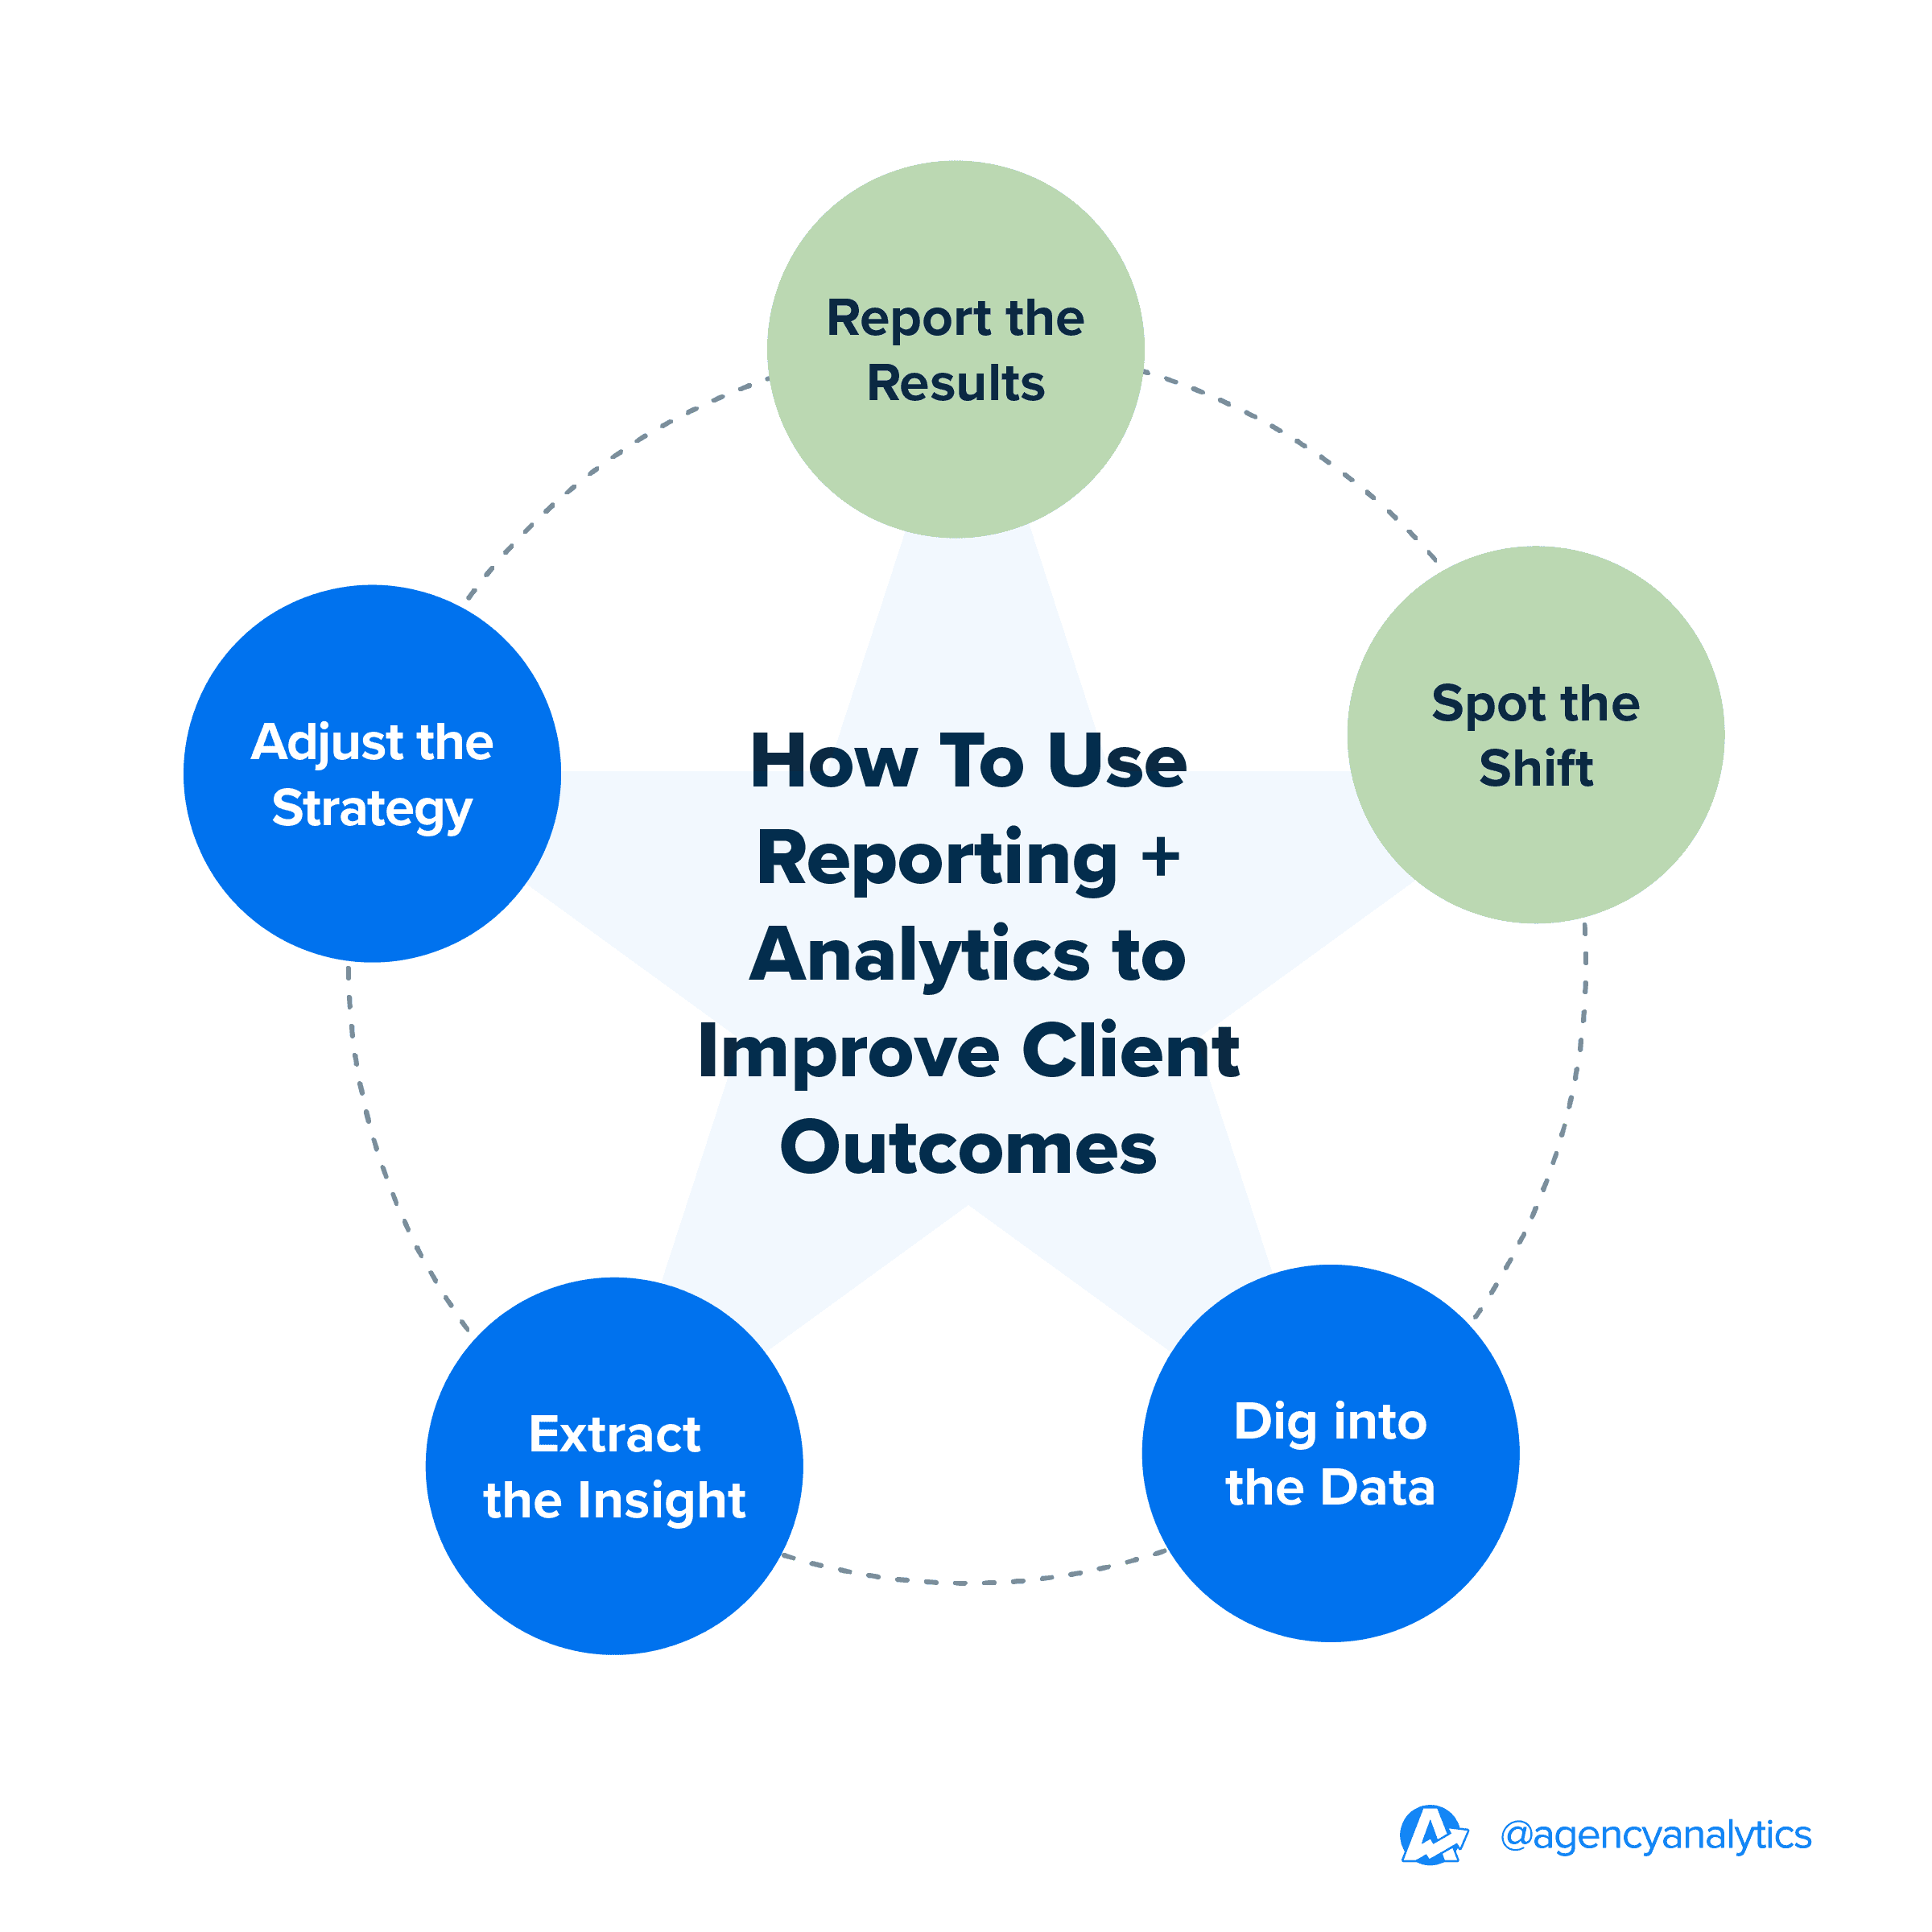
That’s how you move from “Here’s what happened” to “Here’s what we’re doing about it.” It’s how you shift from deliverables to decisions and how you turn reports into long-term client relationships.
Analytics vs. Reporting in Action
Let’s say you send a client their monthly SEO report, and it shows a 22% drop in organic traffic. That’s reporting you’ve flagged the issue clearly and quickly. But that alone doesn’t give your client direction.
They’re not paying you just to point out the dip. They’re counting on you to figure out why it happened and what to do about it.
So, you dig into the data. You compare month-over-month traffic by landing page. You check Google Search Console for indexing issues. You scan backlink profiles and identify that several high-authority links were recently lost. You notice that a once top-performing blog post has dropped from page one to page three, likely due to an algorithm update focused on content freshness.
That’s analytics at work.
Now you have answers and a strategy. You recommend updating the affected blog post, running a targeted link-building sprint, and reallocating some paid budget to stabilize conversions in the short term. The client sees the cause, the fix, and the path forward, all backed by data.
That’s the value of combining reporting and analytics. Reporting tells the client what changed. Analytics tells them why and gives them a reason to trust your agency with the next move.
Each has value when used alone. But when used together, they make your agency an essential strategic partner, not just a vendor sending updates!
The Best Tools for Reporting and Analytics
Pairing reporting with analytics is the formula for smarter, faster decision-making. But pulling it off efficiently requires the right platform.
In this section, we’ll share a list of the top tools for business analytics and client reporting.
1. AgencyAnalytics: Your One-Stop Platform
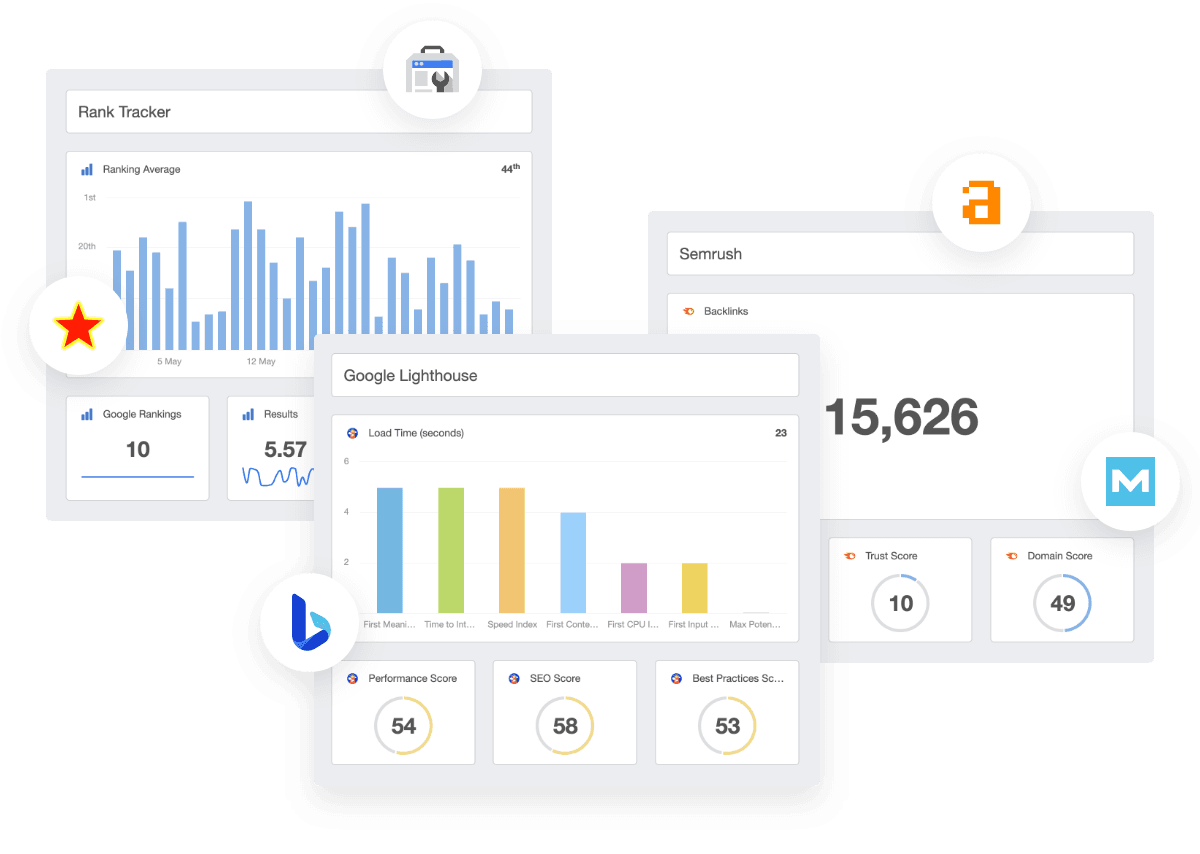
Built specifically for marketing agencies, AgencyAnalytics combines reporting and analytics into one streamlined platform. You get everything you need to present data and gain insights all in a single, intuitive dashboard.
Here’s what makes AgencyAnalytics the go-to for growing agencies:
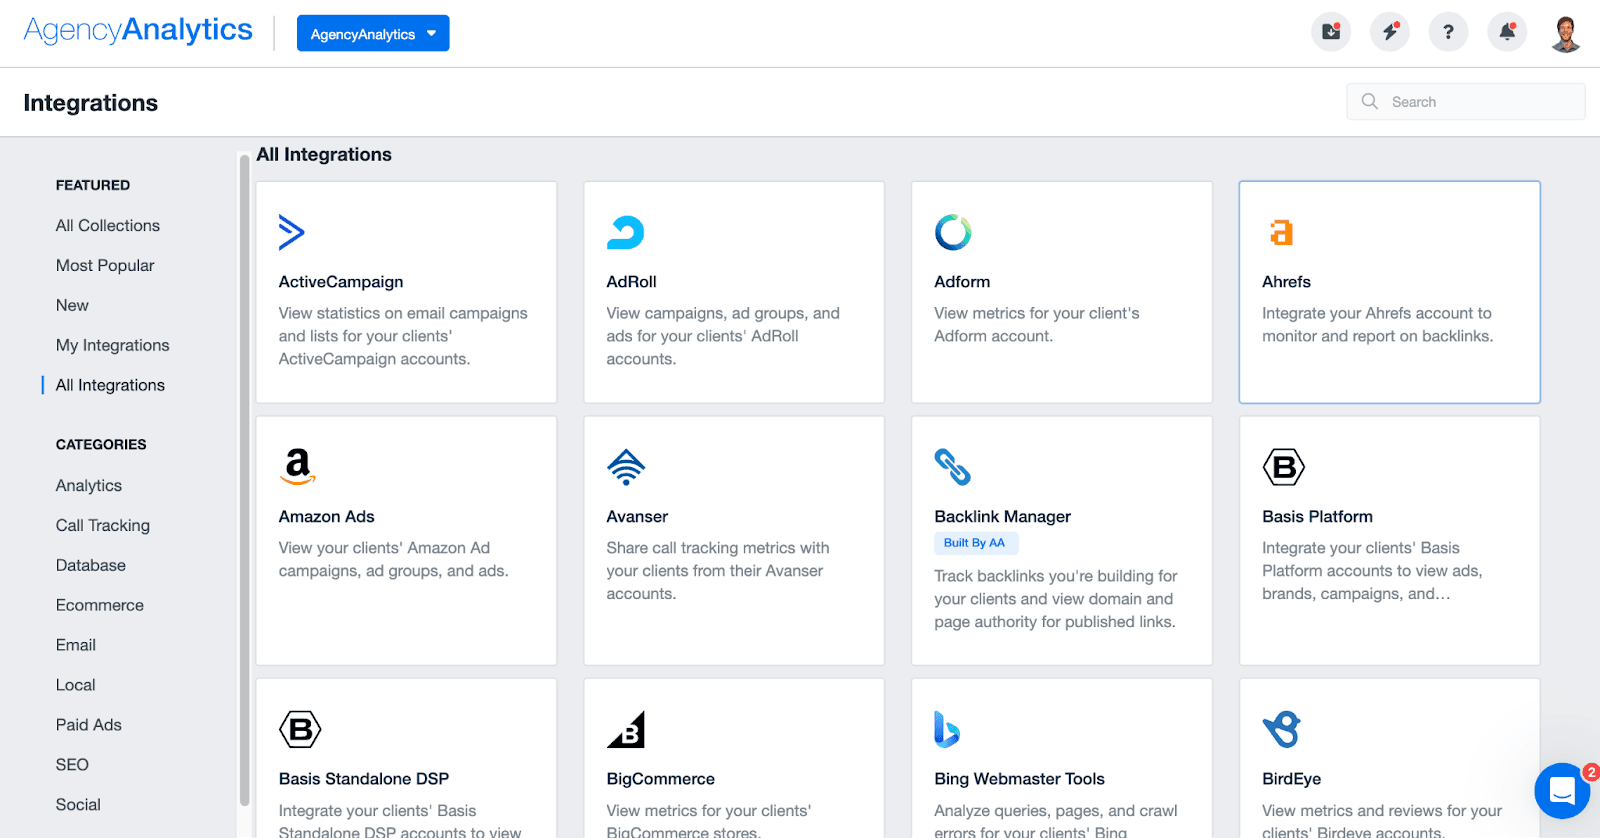
80+ Integrations: Instantly connect the tools you already use, like Google Ads, GA4, Facebook, HubSpot, CallRail, and dozens more. These seamless integrations eliminate manual data entry, reduce errors, unify marketing analytics and measurement, and ensure your reports are always up-to-date with accurate, relevant data.
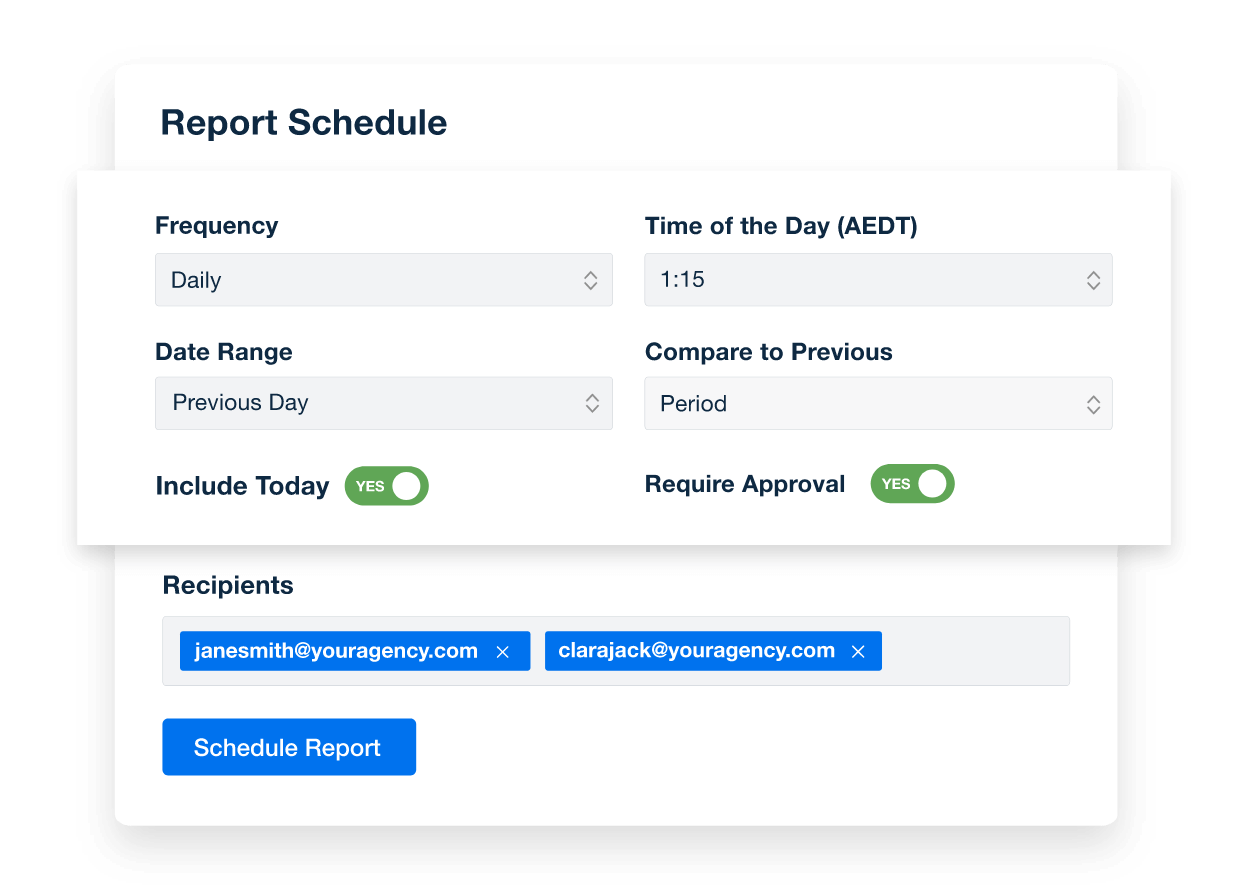
Automated Reports: Schedule recurring reports to go out automatically, weekly, monthly, or on your custom timeline. Whether it’s a standard client update or a campaign wrap-up, automated reports ensure consistent communication without lifting a finger.
Live Custom Dashboards: Give clients real-time access to the data they care about most. Custom dashboards offer a clear, on-demand view of key metrics, perfect for reducing back-and-forth and increasing transparency.
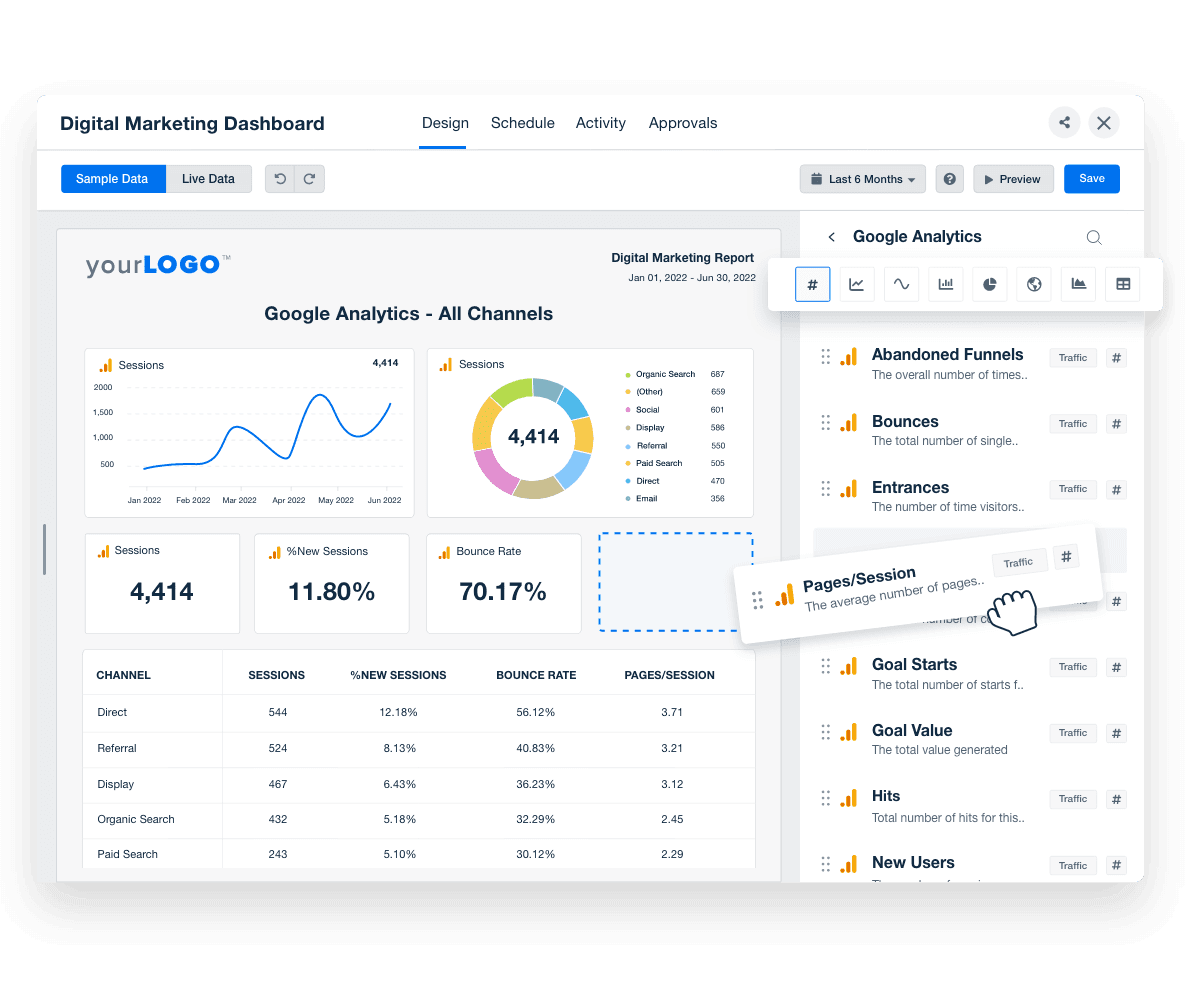
Marketing Performance Insights: Show clients how they stack up against marketing industry benchmarks to add context and credibility to your recommendations. It helps frame results and gives you an edge in strategy conversations.
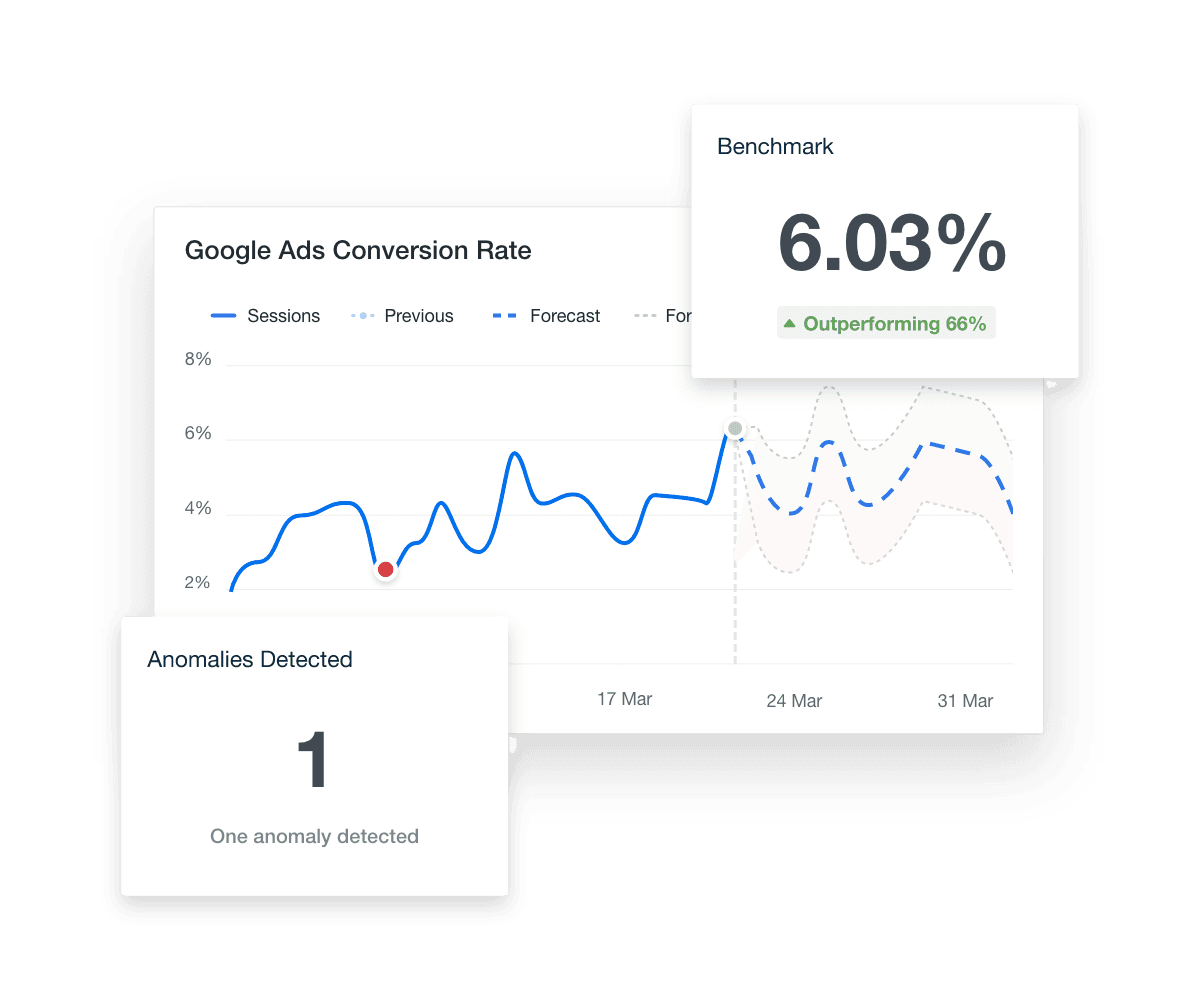
Anomaly Detection: Be the first to know when something unexpected happens, whether it’s a dip in conversions or a spike in bounce rate. AgencyAnalytics’ intuitive data visualization software features help you quickly spot and respond to issues before they escalate.

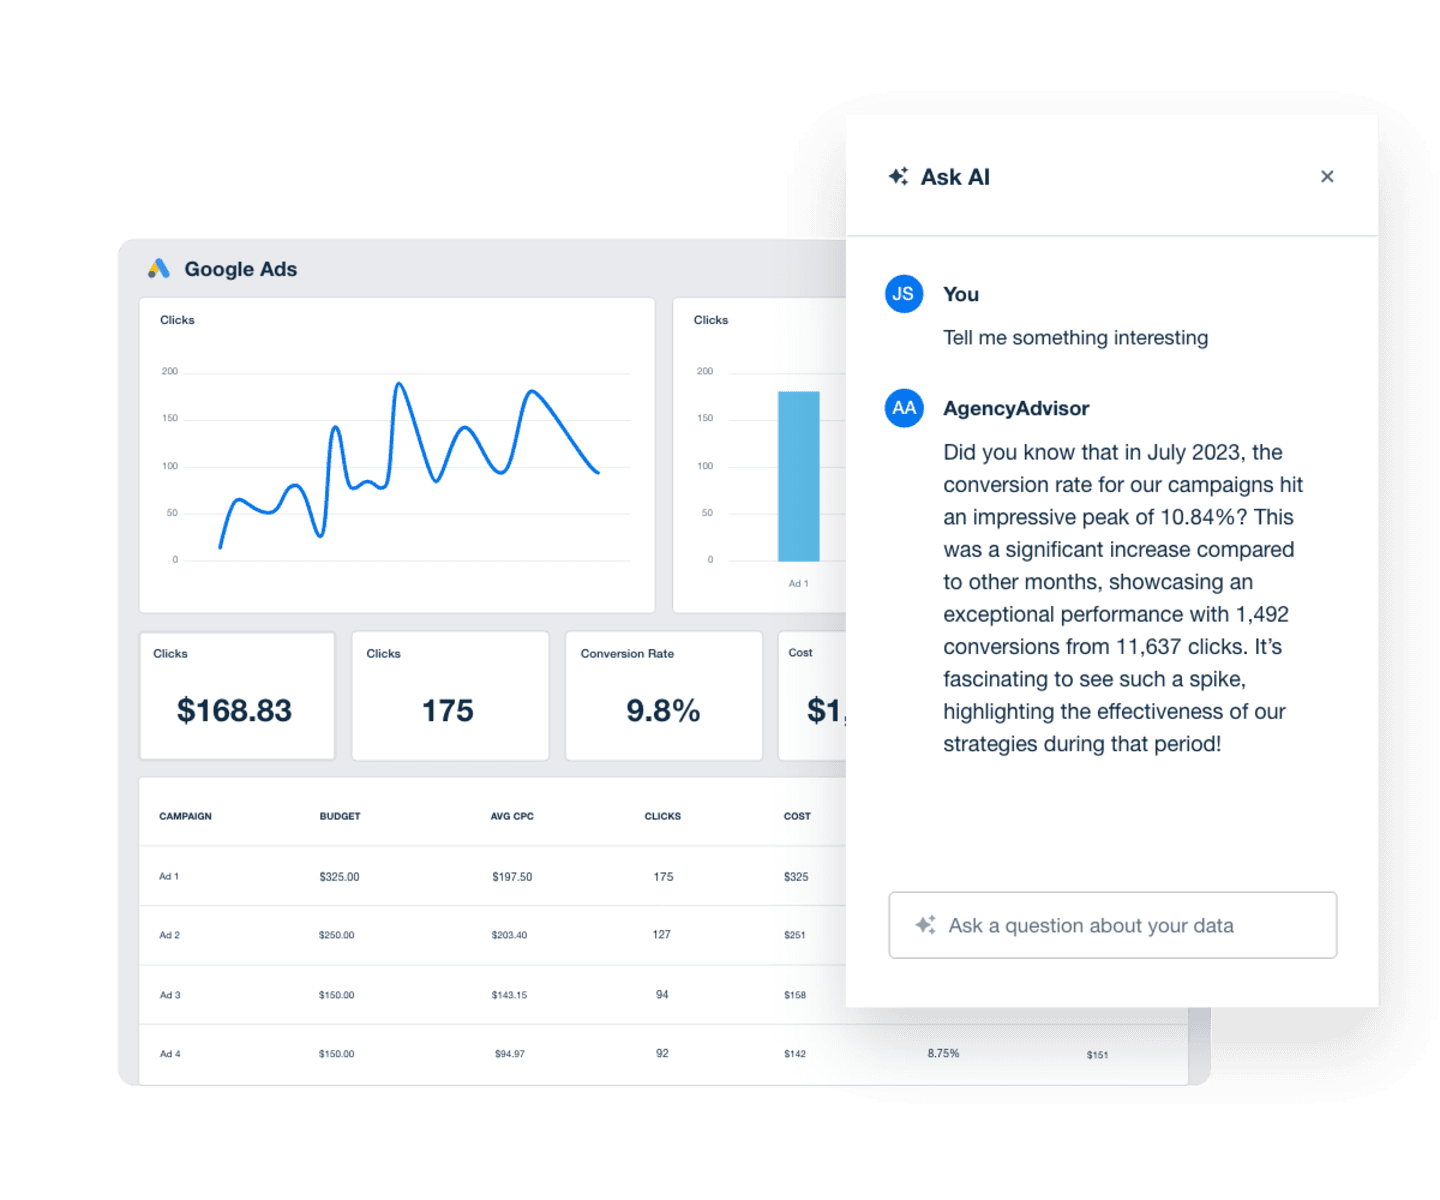
AI Reporting Tools: Let AI dig through the noise and highlight what matters. Ask AI and AI Summary surface actionable insights quickly so your team has more time to focus on strategy than analysis.
White Label Reporting: With AgencyAnalytics’ full white label customization, you have the flexibility to add your agency’s logo, brand colors, and custom domain. It reinforces your agency’s value and makes your work look as polished as it performs.
Everyone knows that results are the foundation of a good client relationship. However, it's important that clients are kept clearly informed about these results and able to see progress. AgencyAnalytics reports provide the flexibility and clarity we need to achieve this.
David Metcalf, Managing Director, Distl.
2. GA4 (Google Analytics 4): For User Behavior
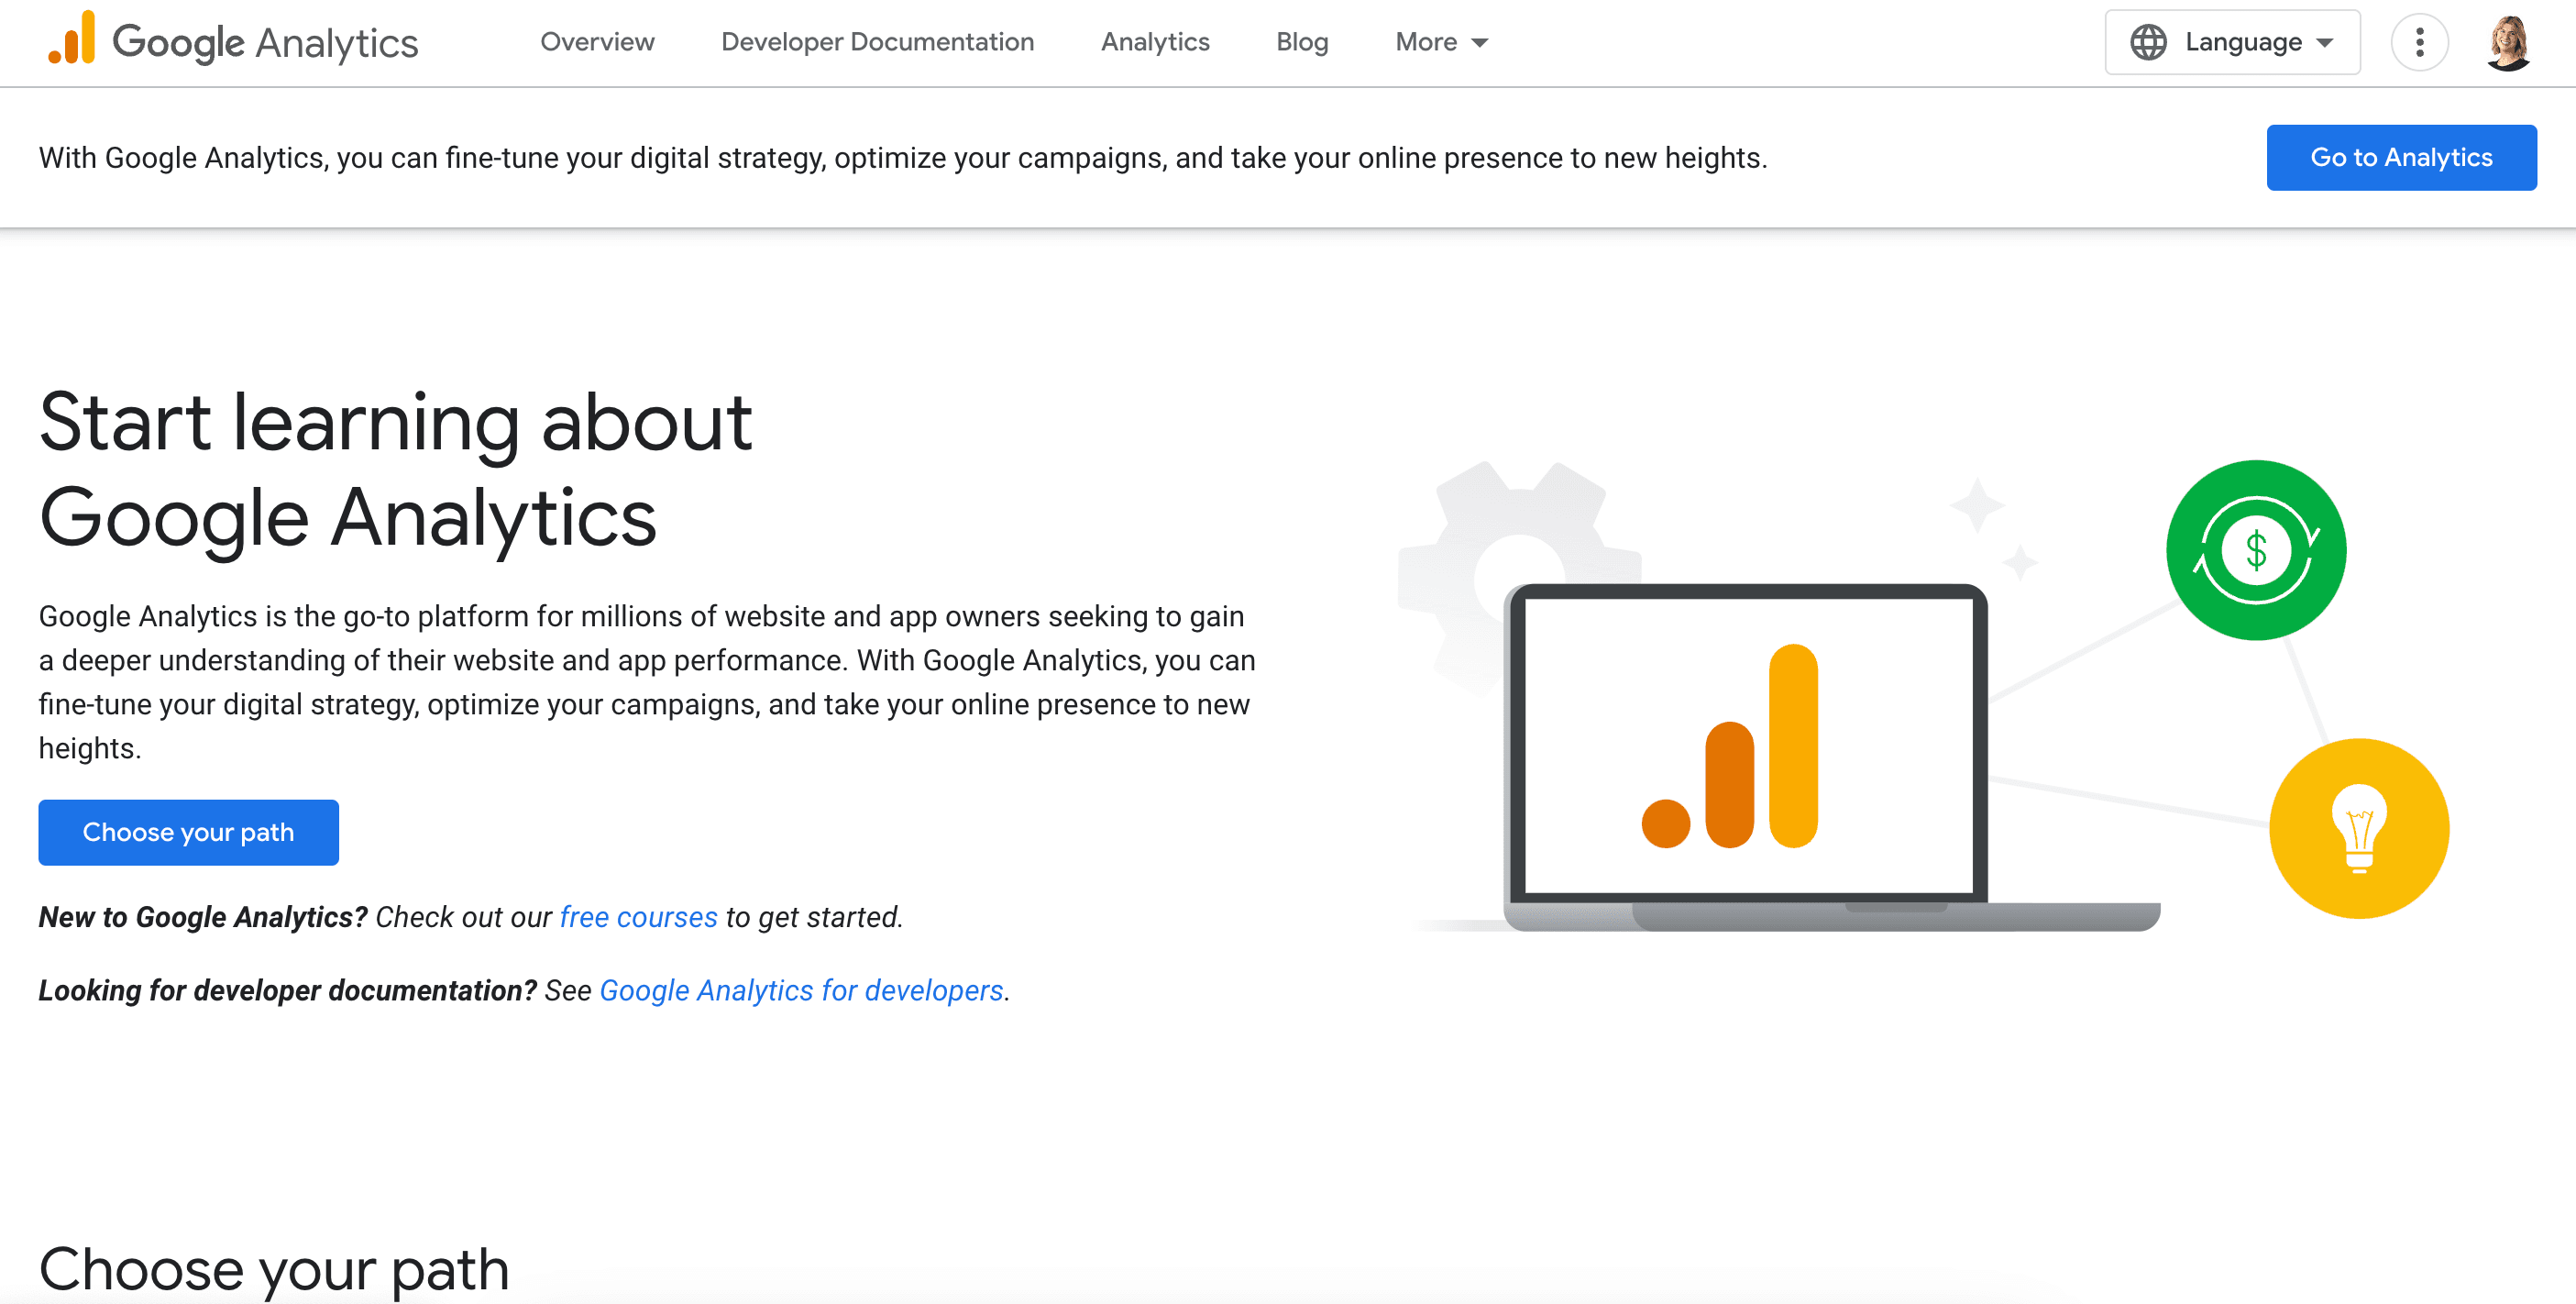
A staple for behavioral and website data, Google Analytics 4 (GA4) helps you track user journeys, engagement patterns, and conversion events across devices. It supports event-based out-of-the-box tracking and gives you a more complete picture of how users interact with your client’s site. With built-in predictive metrics and machine learning insights, it’s a must-have for agencies that want to move beyond vanity metrics and deliver deeper value in their data analysis.
3. Google Search Console: For SEO Insights
Google Search Console gives you direct insight into how your client’s site is performing in organic search—what keywords are bringing in traffic, how pages are indexed, and where technical SEO issues may be holding your client back. Use it to validate ranking changes, monitor crawl errors, and surface opportunities to optimize visibility. It’s also a great tool for aligning reporting and analytics around real search performance.
4. Ahrefs: For Competitor Analysis
Ahrefs is a go-to for backlink audits, keyword tracking, and competitive research. It allows agencies to monitor domain authority, identify high-impact referring domains, and discover ranking gaps with competitors. Ahrefs isn’t designed for client-facing reports, but it delivers the relevant data your team needs to derive insights, justify SEO recommendations, and improve business performance.
5. Matomo: For Privacy-First Analytics
Matomo is a strong alternative to GA4 for agencies working with privacy-conscious clients. It offers full control over data hosting and compliance, so this means no third-party sharing or external dependencies. You still get detailed behavioral insights, goal tracking, and even marketing data visualization, but with a tighter grip on data ownership. It’s a good option for agencies operating in healthcare, finance, or regulated industries.
Get the Best of Both Worlds With a Customized AgencyAnalytics Dashboard
The good news is that you don’t have to choose between data analysis tools and efficient reporting. With 80+ integrations, AgencyAnalytics brings together platforms like GA4, Google Search Console, Ahrefs, and Matomo, helping you build a unified, client-facing dashboard.
Instead of jumping between tabs, exporting spreadsheets, or manually stitching together data from multiple platforms, everything lives in one place. You get a single source of truth for each client, backed by clean visuals, consistent updates, and data you can trust.
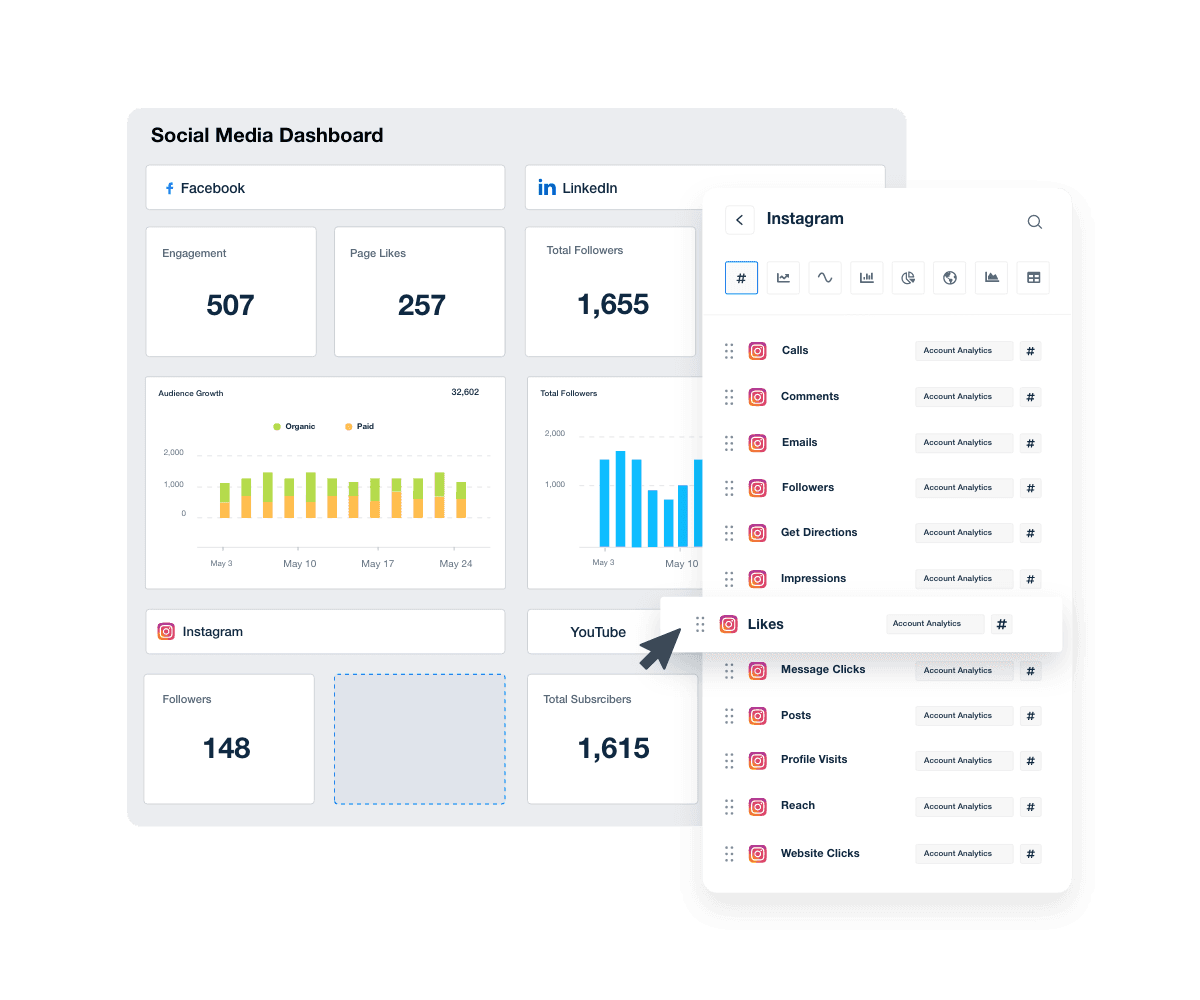
The result? Your team saves hours on manual tasks, clients get a clearer picture of performance, and your agency spends more time delivering strategy, not formatting reports.
Read more on data analysis reporting: How to Write a Data Analysis Report: Examples, Structure & Tips
From Data to Direction: Putting It All Together
Reporting and analytics aren’t interchangeable, and that’s precisely why your agency needs to depend on both.
Both form the backbone of your agency’s strategy. Reporting keeps the conversation grounded, while analytics keeps it moving forward.
When you bring both into one streamlined platform, you’re improving operational efficiency and leveling up the way you serve your clients.
Want to stop switching between tools, save hours on manual reporting, and extract insights that drive business performance? Try AgencyAnalytics free for 14 days and deliver marketing reports that tell the whole story.
FAQs About Reporting Vs Analytics
Still have questions about the differences between reporting vs analytics? We’ve got you covered!
Reporting is the process of organizing and presenting data in a structured format, making it easy to track performance and share results with clients. Analytics takes that data a step further by interpreting what it means, identifying patterns, and using those insights to guide strategic decisions.
Businesses use reporting to track KPIs, monitor campaign progress, and maintain transparency with stakeholders. Analytics is used to interpret that data—identifying performance gaps, optimizing strategies, and making informed decisions that drive outcomes.
Operational reporting delivers routine updates on day-to-day performance, like budget pacing or task completion. Analytics digs deeper into that data to uncover causes, predict trends, and identify areas for strategic improvement across campaigns and channels.
AgencyAnalytics is the top choice for marketing agencies, combining automated reporting and powerful analytics in one platform. Other reporting and analysis tools include GA4 for user behavior, Search Console for SEO insights, Ahrefs for competitive data, and Matomo for privacy-first analytics.
Reporting informs; analytics drives action. While reporting keeps clients in the loop, analytics turns raw data into strategic decisions. It reveals why performance changed and what to do next, helping agencies solve problems, optimize results, and earn long-term trust.

Written by
Sylva is an expert content writer with over 10 years of experience in tech and SaaS, offering first-hand insight into agency needs from her background in advertising.
Read more posts by Sylva SivzattianSee how 7,000+ marketing agencies help clients win
Free 14-day trial. No credit card required.


