Post Impressions
Audience Reach
Assess whether social media content is adequately targeted and reaching the intended audience.
Brand Awareness
Track the frequency of social media posts and ads to understand brand visibility.
Content Strategy
Tailor content based on the social media platforms or formats that yield higher Post Impressions.
Budget Allocation
Optimize budget distribution across social media platforms for maximum visibility.
Why Post Impressions Are Important
Post Impressions are useful for understanding the initial reach of a social media campaign. This metric shines a light on content visibility, indicating how extensively a message is being disseminated. By measuring the number of times content appears, marketers gain an understanding of potential audience size and the effectiveness of distribution channels.
Additionally, Post Impressions offer a baseline understanding of campaign performance. While Post Impressions doesn’t necessarily equal engagement, this metric is the first step in strategy evaluation. As a result, it becomes much easier to finetune approaches for maximum impact in the subsequent stages of social media campaigns.
Stop Wasting Time on Manual Reports... Get Insights Faster With AgencyAnalytics
How Post Impressions Relate To Other KPIs
Post Impressions must be considered alongside other key performance indicators (KPIs) to provide a comprehensive view of a campaign’s effectiveness.
When analyzed alongside Post Impressions, Click-Through Rate (CTR) offers insight into the audience's engagement level. High Post Impressions with a low CTR indicates a need for more compelling content or better targeting.
While Post Impressions show how frequently content was displayed, engagement metrics (e.g., Shares, Likes, and Comments) reveal how the audience interacted with it. This combination helps assess content resonance and user interest.
Additionally, the relationship between Conversion Rate and Post Impressions reveals whether high visibility translates into desired actions (e.g., sales, sign-ups). Leverage this data to guide strategic adjustments in targeting or content design for improved campaign performance.
When looking at metrics, it’s important to prioritize them based on the most important KPIs. For example, a local restaurant that is just in the midst of launching may be looking for Post Impressions and increased brand awareness. Always take a look at the business and the number one thing that will move the needle forward based on its current standing.
How To Measure Post Impressions
Measuring Post Impressions involves tracking the total number of times a social media post is displayed on a user's screen. This metric is usually provided by social media platforms that monitor and record each instance in which content appears. It's crucial to ensure accurate tracking settings on these platforms to gather reliable Post Impressions data.
What Is a Good Number of Post Impressions?
A good average for Post Impressions varies widely based on industry, audience size, and platform. However, a larger number of Post Impressions generally indicates a broad reach.
If the number of Post Impressions exceeds past performance or industry norms, it suggests effective targeting and content. It also sets the stage for other objectives further down the marketing funnel, such as engagement.
What Is a Bad Number of Post Impressions?
A low average in Post Impressions often signals limited campaign reach and poor visibility. This may be due to incorrect targeting, unappealing content, or insufficient distribution.
If Post Impressions are significantly less than previous performance or industry averages, it could mean adjusting designs, platform selection, or audience targeting.
How To Set Post Impressions Benchmarks and Goals
To get started, consider historical campaign data and industry standards across social media platforms. Define the specific audience, as data may vary across demographics. Use this data to set realistic goals and performance benchmarks (e.g., getting a 20% increase in Post Impressions over the next quarter). To optimize Post Impressions, conduct A/B testing to understand what drives the most visibility on social media. Regularly monitor the impact of any campaign adjustments, updating Post Impressions goals and benchmarks as needed.
Why Post Impressions Matter to Clients
For clients, Post Impressions provide a snapshot of how widely their brand or message is being disseminated on social media. A high number of Post Impressions indicates that the content is reaching a broad audience, which is the first step in building brand recognition and recall.
Additionally, this metric helps clients understand the effectiveness of their ad spend. By tracking Post Impressions, clients gauge whether their investment translates into sufficient visibility. This allows them to make informed decisions on budget allocation and campaign strategy.

Why Post Impressions Matter to Agencies
Post Impressions inform agencies about the initial reach and effectiveness of content strategies. High Post Impressions suggest successful creative, ad placements, and audience targeting. In turn, this demonstrates expertise and shows their ability to deliver results.
This metric also serves as a baseline for optimizing campaigns. By understanding social media reach, agencies make adjustments to enhance other key metrics like engagement and Conversion Rates. Overall, Post Impressions show an agency’s ability to position a client's message in front of the right audience at the right time.

Win Back Billable Hours by Automating Your Client Reporting.
Best Practices When Analyzing and Reporting on Post Impressions
Post Impressions is an essential metric for refining social media strategies and optimizing ad spend. Here’s an overview of top reporting practices to communicate insights on Post Impressions.
Analyze Post Impressions Over Time
Monitor Post Impressions over time, demonstrating the effect of strategy changes and external factors on social media visibility.
Identify Peak Performance Times
Pinpoint when social media posts are getting the most Post Impressions, and use this data to guide future scheduling strategies.
Compare Post Impressions Across Channels
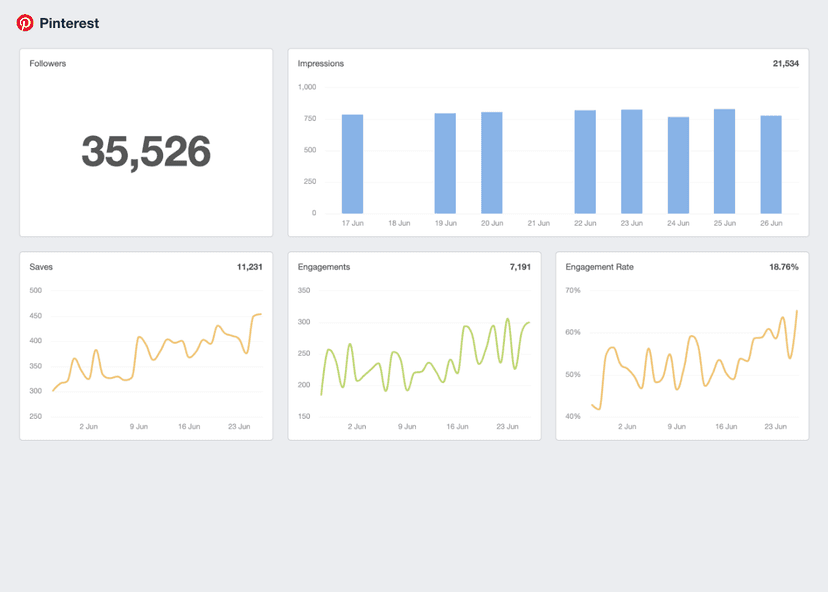
Evaluate Post Impressions across different social media channels to determine which are most successful at increasing visibility.
Segment Post Impressions Data
Break down the data into segments such as demographics and time of day for deeper insights into audience and content performance.
Visualize Post Impressions Performance
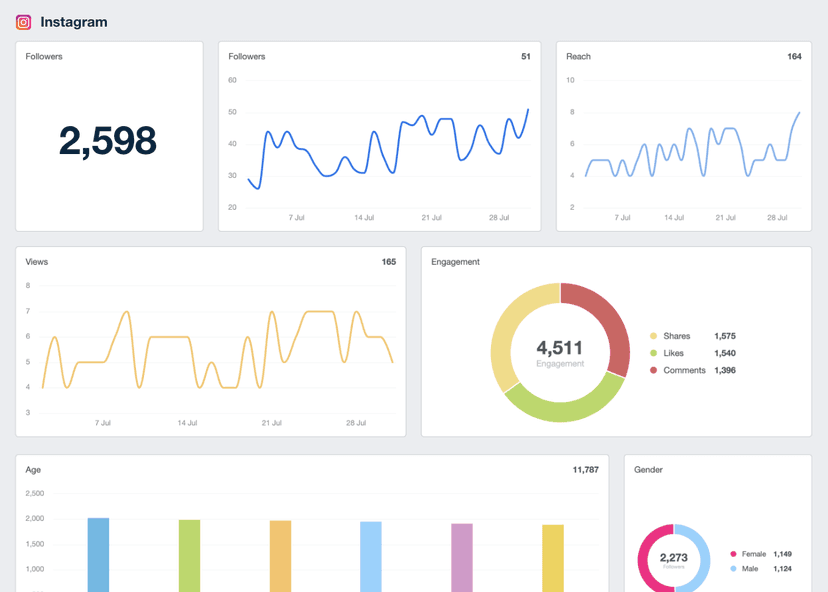
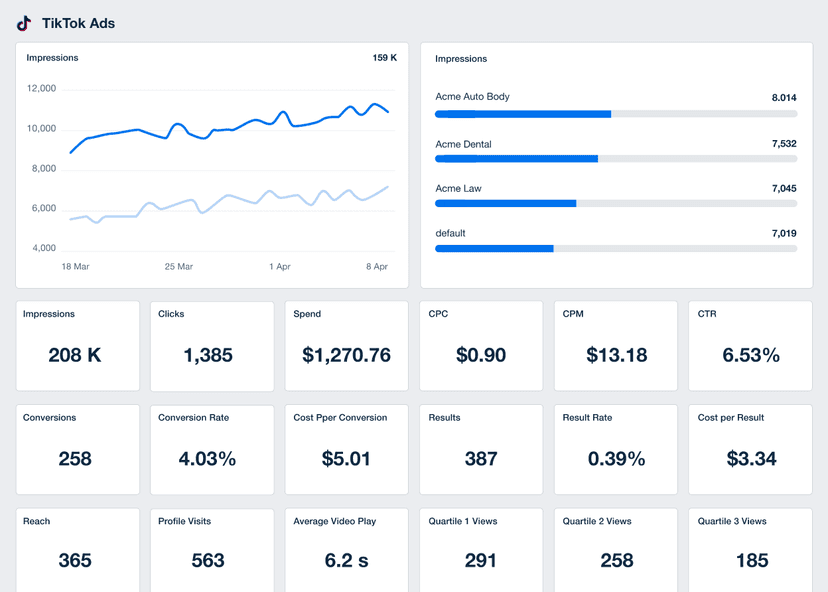
Use charts and graphs to illustrate trends and patterns in Post Impressions, making the data more understandable for decision-making.
Align Post Impressions With Client Goals
Show how Post Impressions metrics contribute to broader business goals, such as increased brand awareness or Conversion Rates.
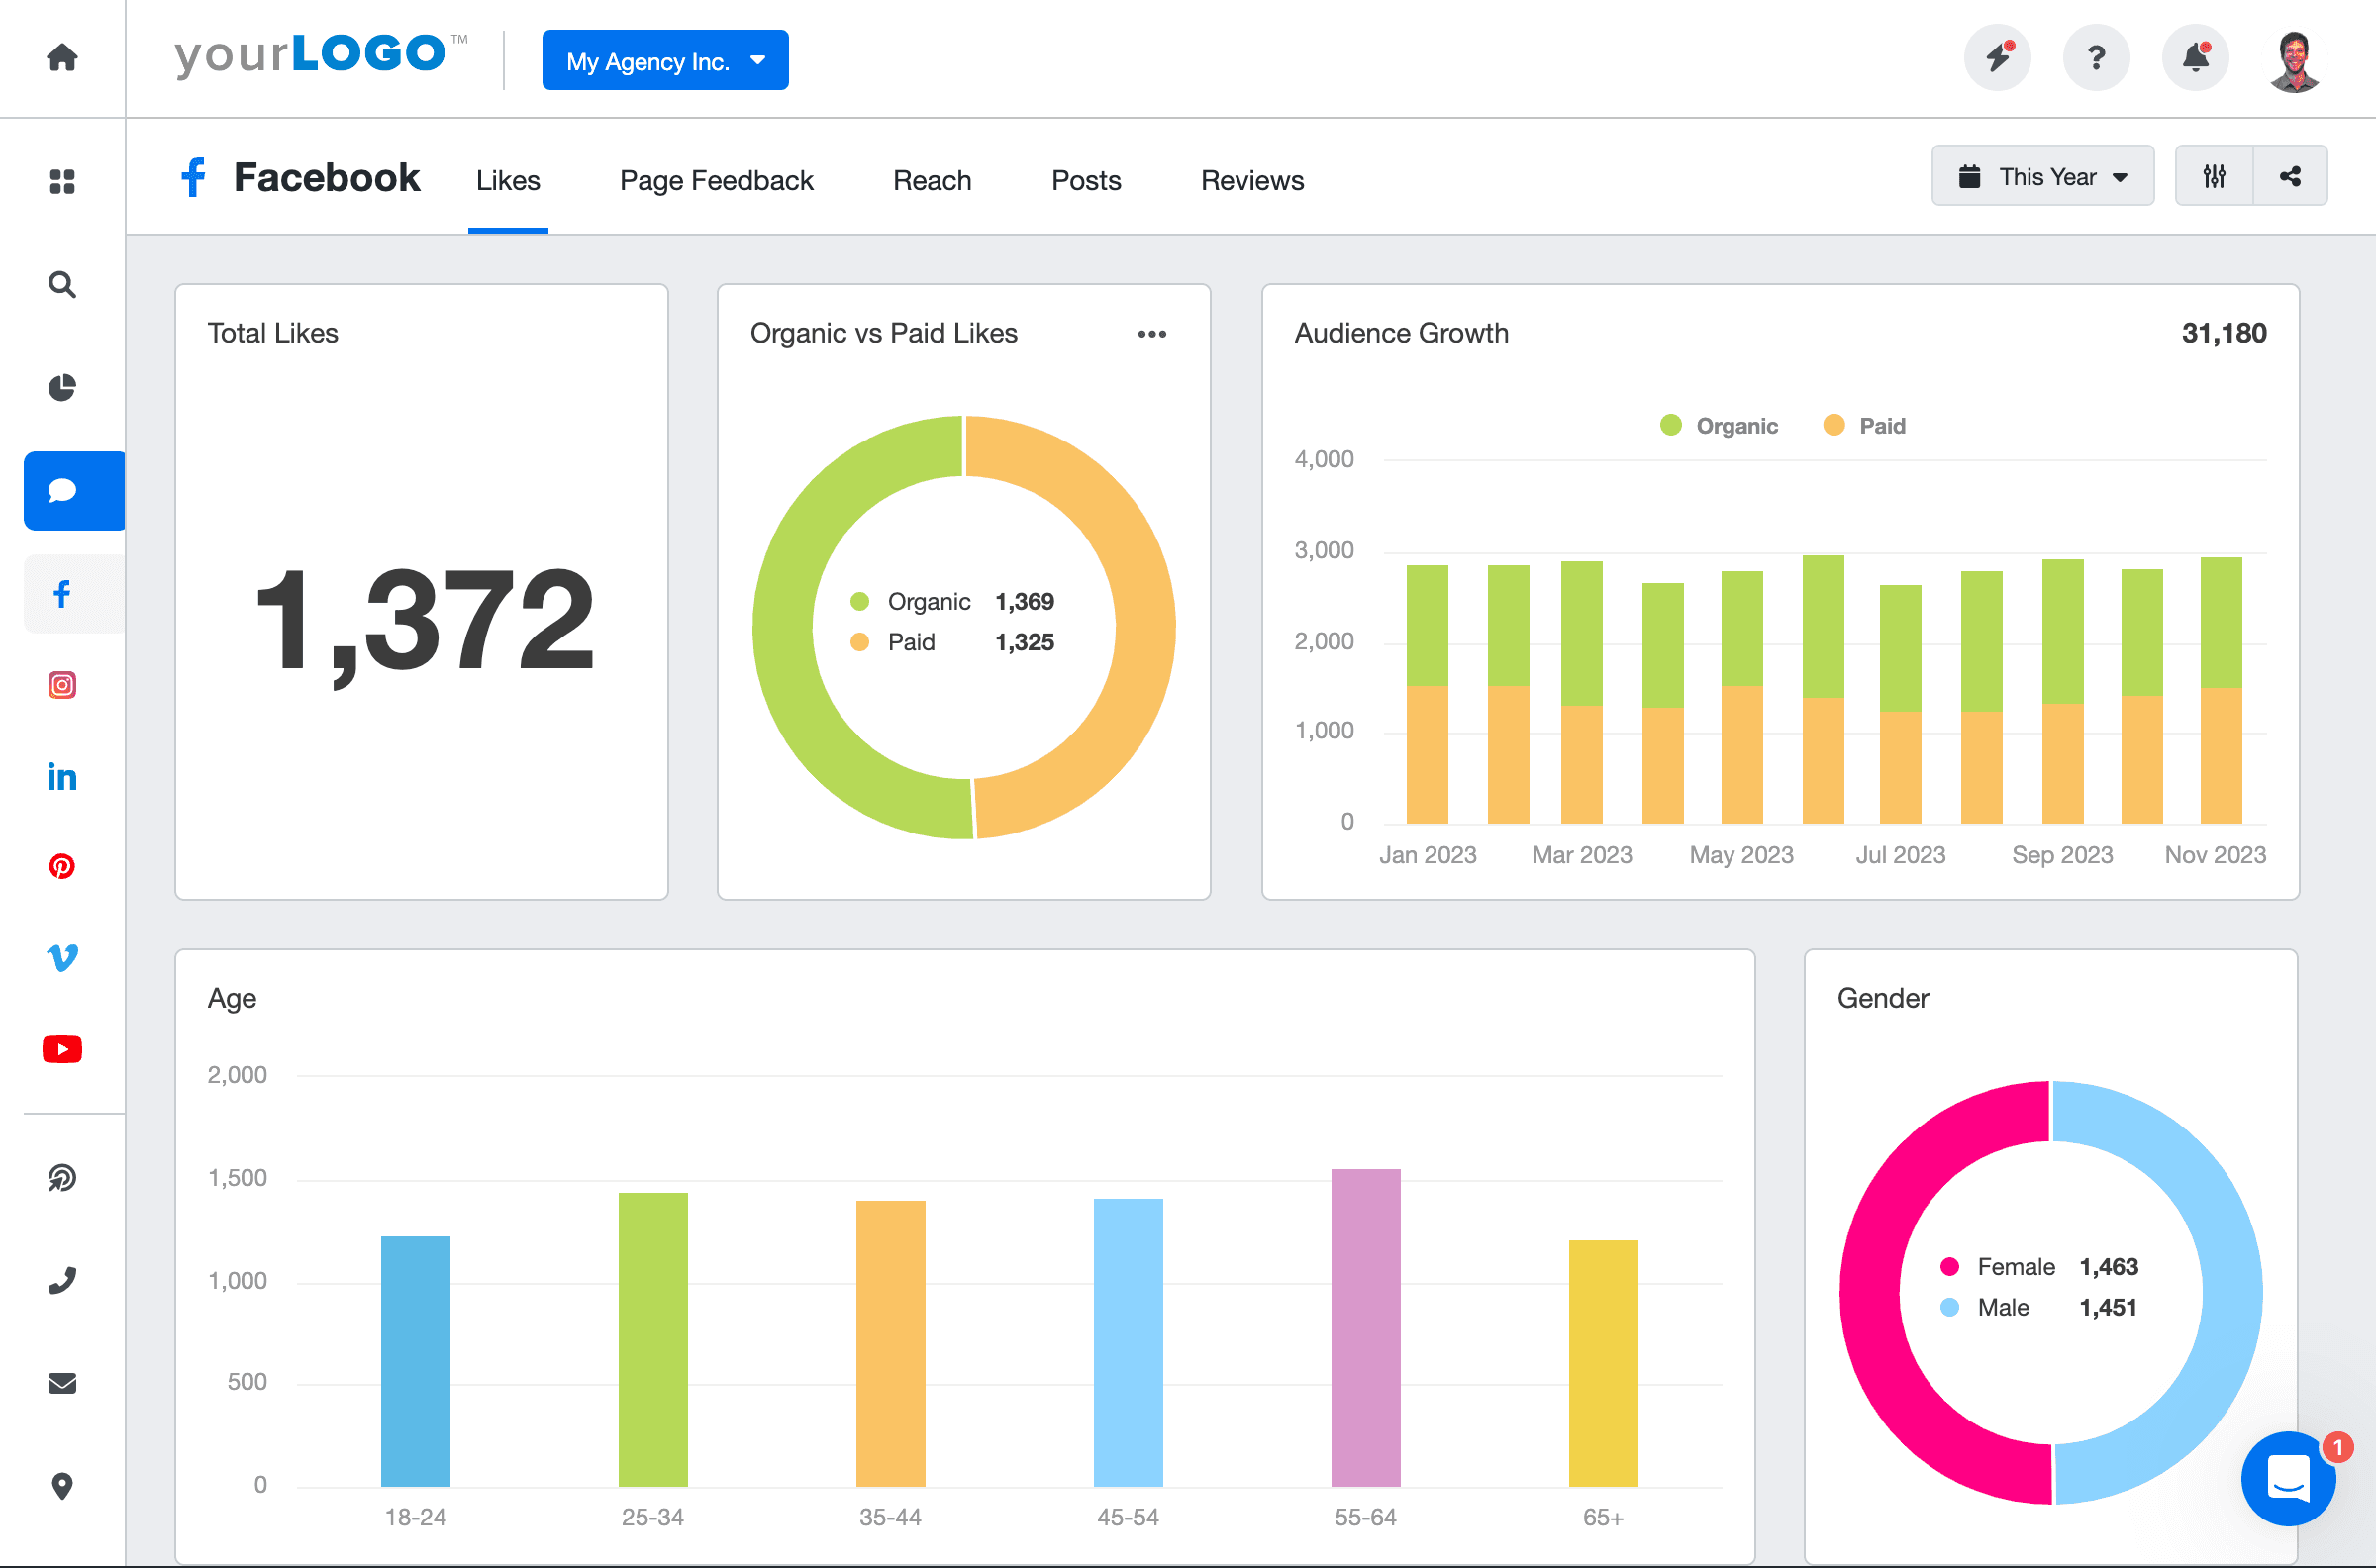
Facebook Dashboard Example
Related Integrations
How To Improve Post Impressions
Improving Post Impressions is critical to amplifying content reach. Here are three tips to boost this metric and drive visibility.
Refine Targeting
Use analytics to understand audience preferences and create tailored content that resonates.
Focus On Quality
Focus on content with high visual appeal and value, which increases the likelihood of Post Impressions.
Engage Influencers
Collaborate with relevant influencers to leverage their follower base and increase content visibility.
Related Blog Posts
See how 7,000+ marketing agencies help clients win
Free 14-day trial. No credit card required.


