Table of Contents
Table of Contents
- What are Instagram performance reports?
- 6 benefits of a professional Instagram analytics report
- Essential insights and metrics for an effective Instagram analytics report
- How to create an Instagram analytics report: Step by step
- How frequently should you send out Instagram performance reports?
- Don’t start from scratch–use a pre-made template instead
7,000+ agencies have ditched manual reports. You can too.
Free 14-Day TrialQUICK SUMMARY:
A professional Instagram analytics report goes beyond surface-level metrics to reveal how posts, Reels, and Stories truly perform. It helps agencies assess the effectiveness of their content strategy, track growth trends, and demonstrate real ROI to clients. This article explains how to create an effective Instagram analytics report, along with the key metrics to track and how to automate the entire process with AgencyAnalytics.
Instagram remains one of the go-to platforms for visual storytelling, and it’s showing no signs of slowing down.
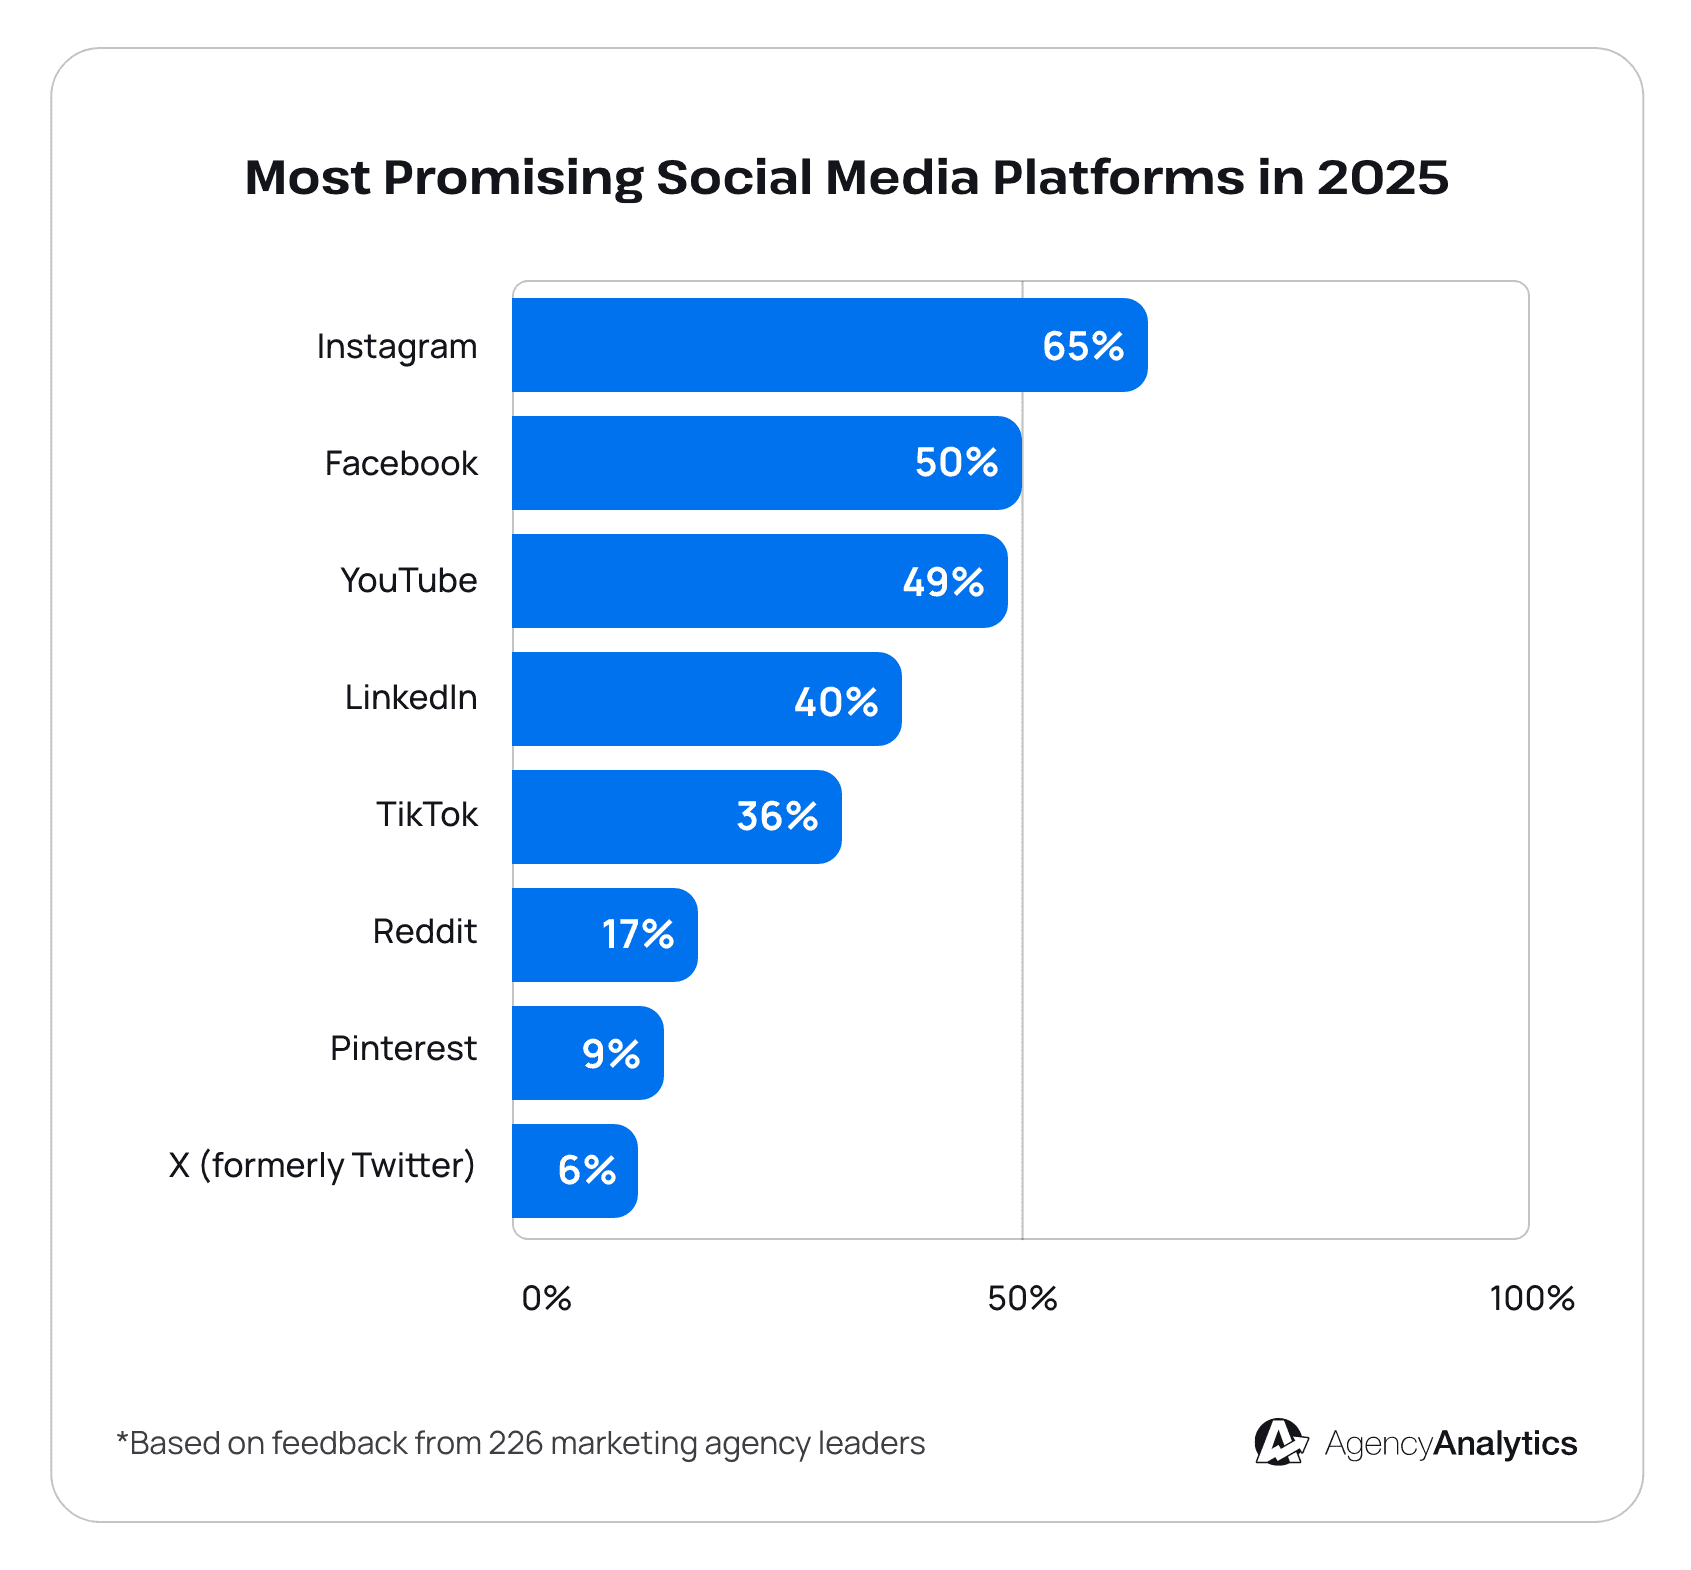
From brands to creators, it’s where audiences discover new ideas, connect with authentic content, and build lasting relationships. The data shows it, too. According to our latest 2025 Marketing Agency Benchmarks Report, it’s the most promising social media platform for driving engagement and growth.
That said, it takes more than a catchy Instagram campaign to keep a client on the roster. What really matters is showing the impact behind the content and what’s driving results.
A well-crafted Instagram analytics report does just that. It’s a way to share deeper insights, like which posts drive the most engagement, how follower growth trends over time, and what content formats deliver the strongest results.
Not sure where to begin? This article covers why Instagram reports matter, which metrics to track, and how often to share updates with clients. We’ll also share how to automate data collection and build professional reports without logging into the Instagram app each time.
What are Instagram performance reports?
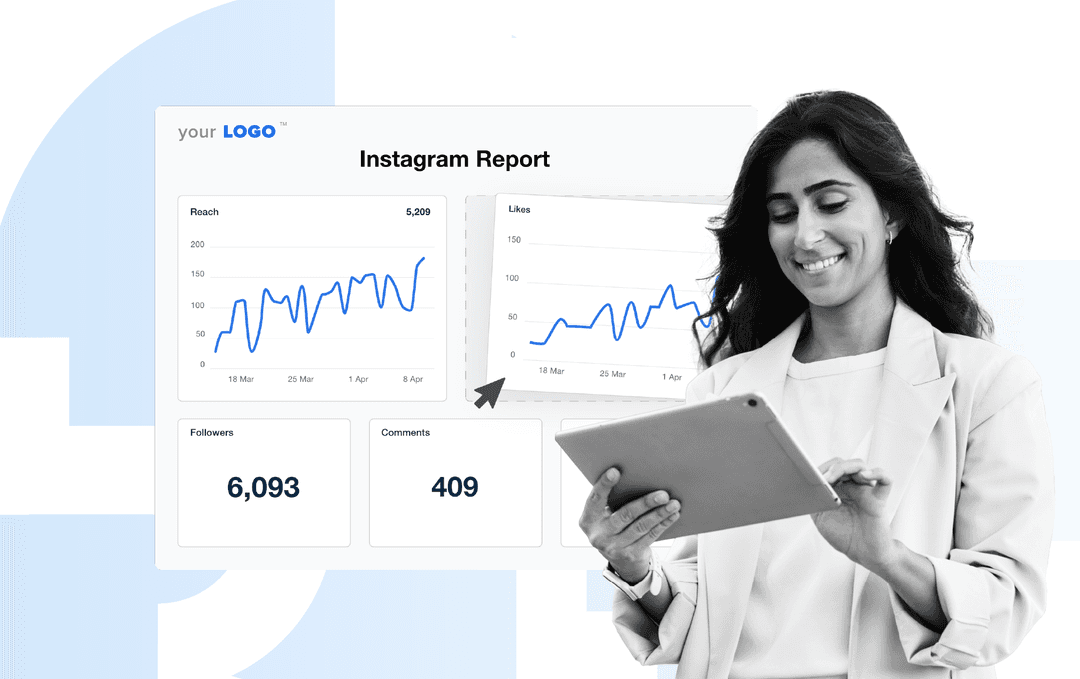
Instagram performance reports give agencies a clear, data-driven snapshot of how each client’s account is performing. They include essential metrics such as follower growth, engagement, reach, impressions, and top-performing content in one place.
With these reports, social media managers can easily highlight wins, measure progress toward campaign goals, and improve social media performance. Consistent Instagram reporting also builds transparency and trust, showing clients the true impact of your strategy.
6 benefits of a professional Instagram analytics report
An Instagram report is more than a bunch of numbers on paper. It’s a way to share tangible results, help clients understand their data, and maximize operational efficiency. Here are six benefits to consider.
1. Save time with automated reporting
Managing several Instagram accounts could get messy if you’re relying on manual reporting. A professional Instagram report template does the heavy lifting by automatically consolidating client data in one place. This reduces the chances of human error and ensures you’ve got a scalable reporting process in place.
We have a diverse roster of clients with different marketing goals and KPIs that they prioritize. Customizable report templates allow our team to deliver the metrics and data that our clients care about. That gives them the best understanding of the success of their campaigns while ensuring all data is at their fingertips.
Paul Echols, Creative Director & Agency Owner, Square 205
2. Customize Instagram reports to fit your clients’ branding
With a customizable report template, it’s easy to add logos, brand colors, and personalized insights to create a cohesive, branded experience. It makes your work feel like a true extension of the client’s brand, which reinforces trust and strengthens your agency’s credibility.
3. Prove ROI with key metrics
Clients often ask: "What’s the ROI of my Instagram marketing?" With a professional analytics report, it’s easy to provide detailed metrics like:
Engagement rates (likes, comments, shares).
Reach and impressions (both paid and organic).
Follower growth and demographics.
Post-level performance insights, including videos, Stories, and carousels.
Use this data to guide content creation efforts, maintain transparency, and show the value of your marketing efforts.
4. Identify what’s working across clients
When you’ve got multiple Instagram accounts to manage, you’re in a unique position to see what’s working across different clients and industries.
Use a professional analytics reporting tool to compare top-performing posts, Reels, and campaigns to uncover what’s working. Spot trends, see what resonates, and use those insights across clients to deliver stronger results every time.
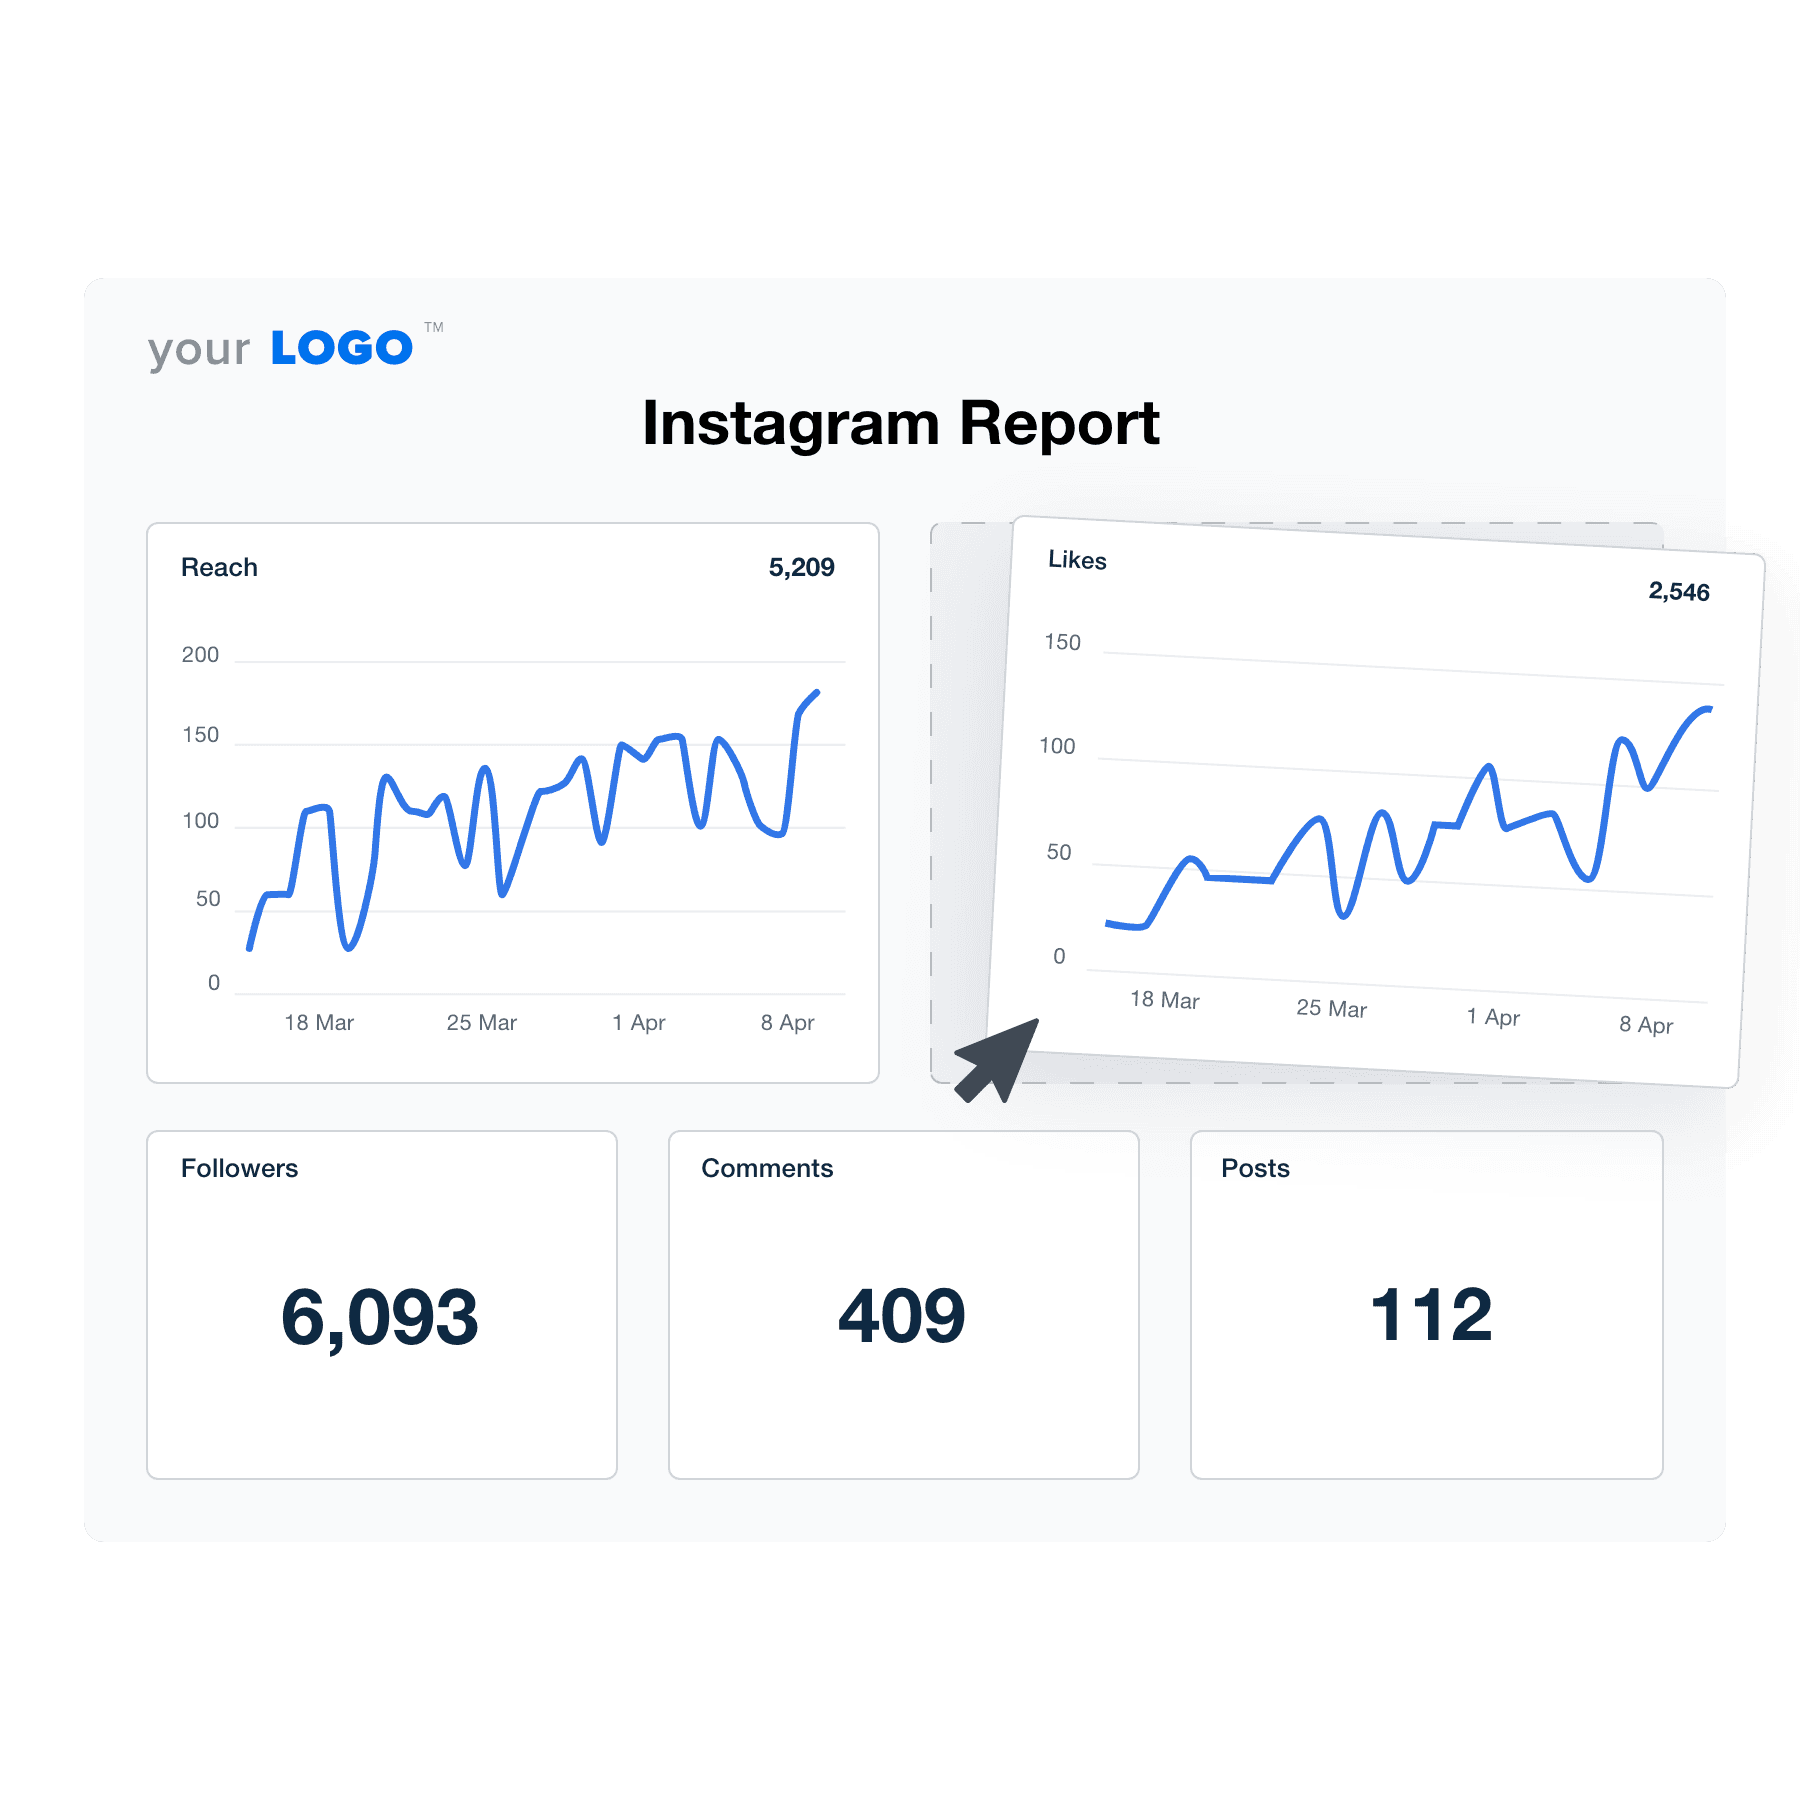
Worried about data accuracy? Use a reporting platform that syncs with the official Instagram API. Impress clients with reliable insights they can trust–try AgencyAnalytics, free for 14 days.
5. Improve client retention with clear insights
When clients can actually see how their Instagram presence is growing, they’ll stay confident in your strategy. Clear, visual reports make this granular performance easy to understand—no fluff, no confusion.
Over time, that transparency turns into stronger relationships and loyal clients who know you’re fully invested in their success.
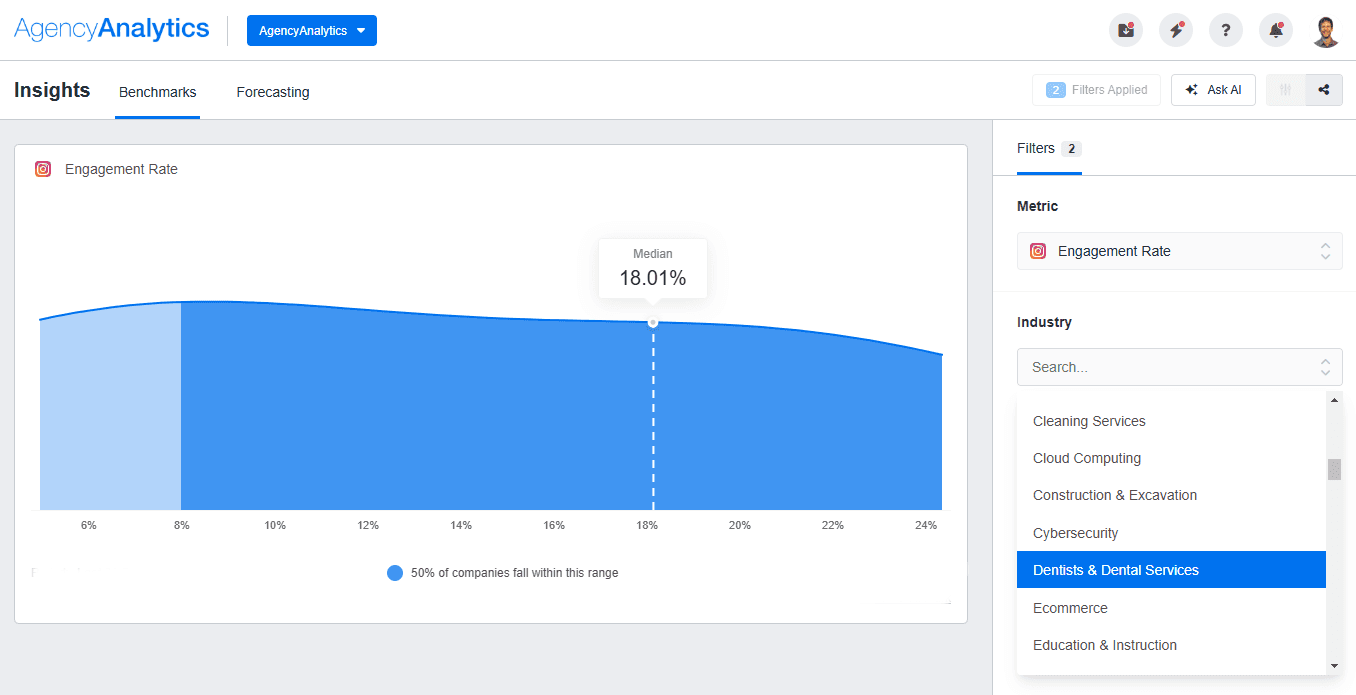
Agency Tip: Provide a competitor analysis by including Instagram benchmarks in your report. That way, clients will see how their metrics stack up against industry standards.
6. Focus on strategy instead of data collection
Pulling metrics by hand takes valuable time away from creative work. With an automated report, your team doesn’t have to dig through posts or screenshots—everything’s already collected and organized. That means less time chasing numbers and more time developing strategies, testing new content ideas, and optimizing campaigns for better results.
Essential insights and metrics for an effective Instagram analytics report
A comprehensive Instagram report is like a well-cooked meal, where each dish contributes to a satisfying feast.
This doc should include:
A branded cover page to set the stage and reflect your client’s identity.
A concise report summary that highlights key takeaways.
Core Instagram metrics such as follower growth, reach, and engagement.
Curious about the ingredients that go into each of these “dishes”? Let’s explore in detail.
Branded cover page & report summary
First impressions matter. A strong, on-brand cover page immediately communicates professionalism and sets expectations for the rest of the report.
For best results:
Keep branding consistent: Use your agency’s colors, logo, and typography across the cover and throughout the report.
Use engaging visuals: Incorporate relevant graphics or imagery that align with your brand style and the report’s theme.
Customize for each client: Tailor the report title, visuals, and summary to match the client’s goals or campaigns.
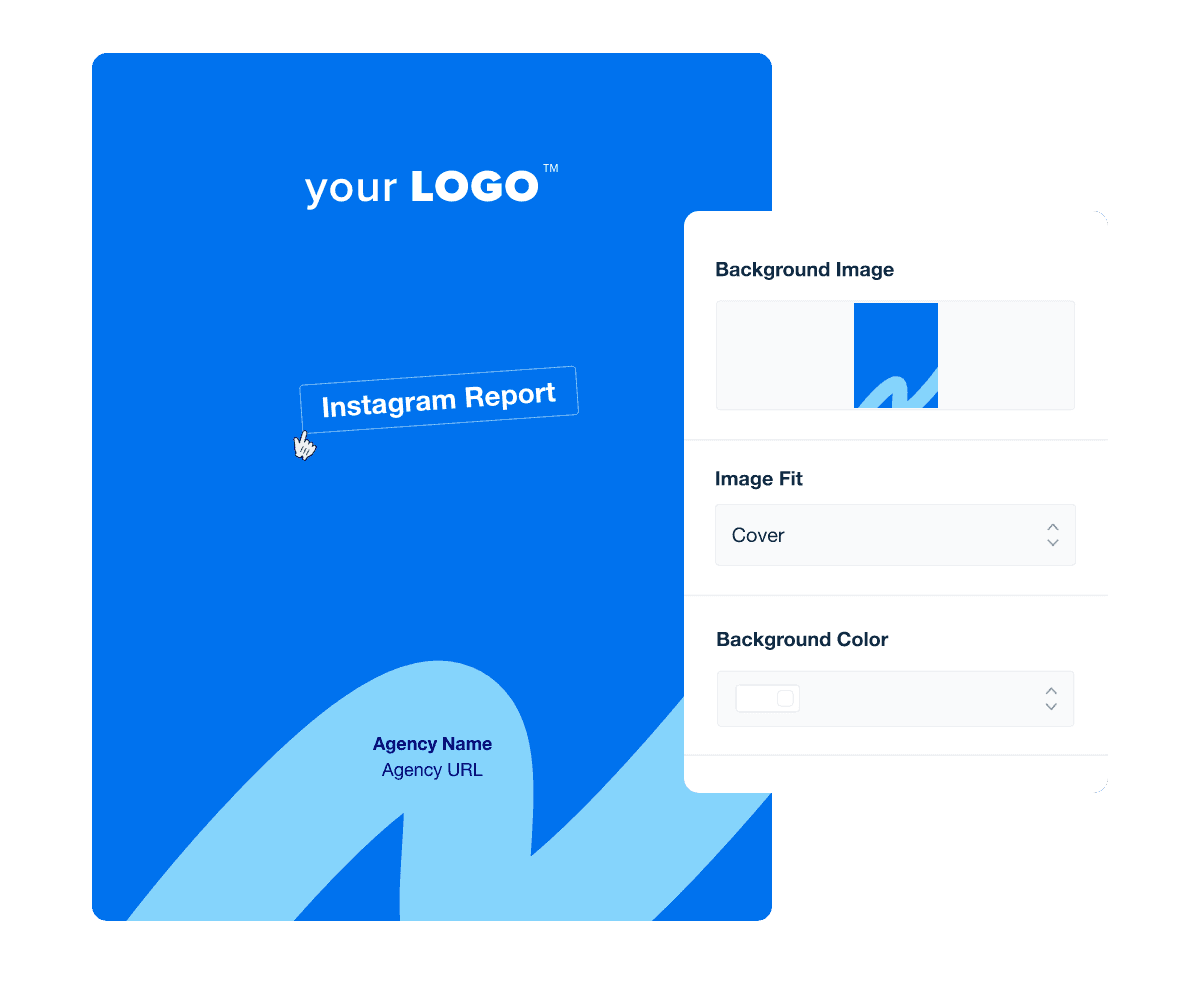
Make every report your own in AgencyAnalytics. Use white-labeling to customize backgrounds, add your agency’s branding, and create reports that match your visual identity. Sign up for a free 14-day trial.
It’s also important to include a concise summary that highlights actionable insights right away. This section sets the stage for the rest of the report, helping clients quickly understand overall performance before diving into detailed metrics.
For maximum impact, lead with clear outcomes, compare results to previous periods or goals, and include next steps or recommendations. Most importantly, frame results around business impact and ROI, not just SEO metrics.
Agency Tip: Use the Ask AI feature in AgencyAnalytics to quickly generate an executive summary, highlight campaign performance, and even identify areas for improvement.
Top metrics to include in Instagram reports
Not all Instagram metrics are created equal–the key is knowing which ones actually matter to your clients. Here’s a breakdown of the top metrics to consider and why each one counts.
Total followers & follower growth rate
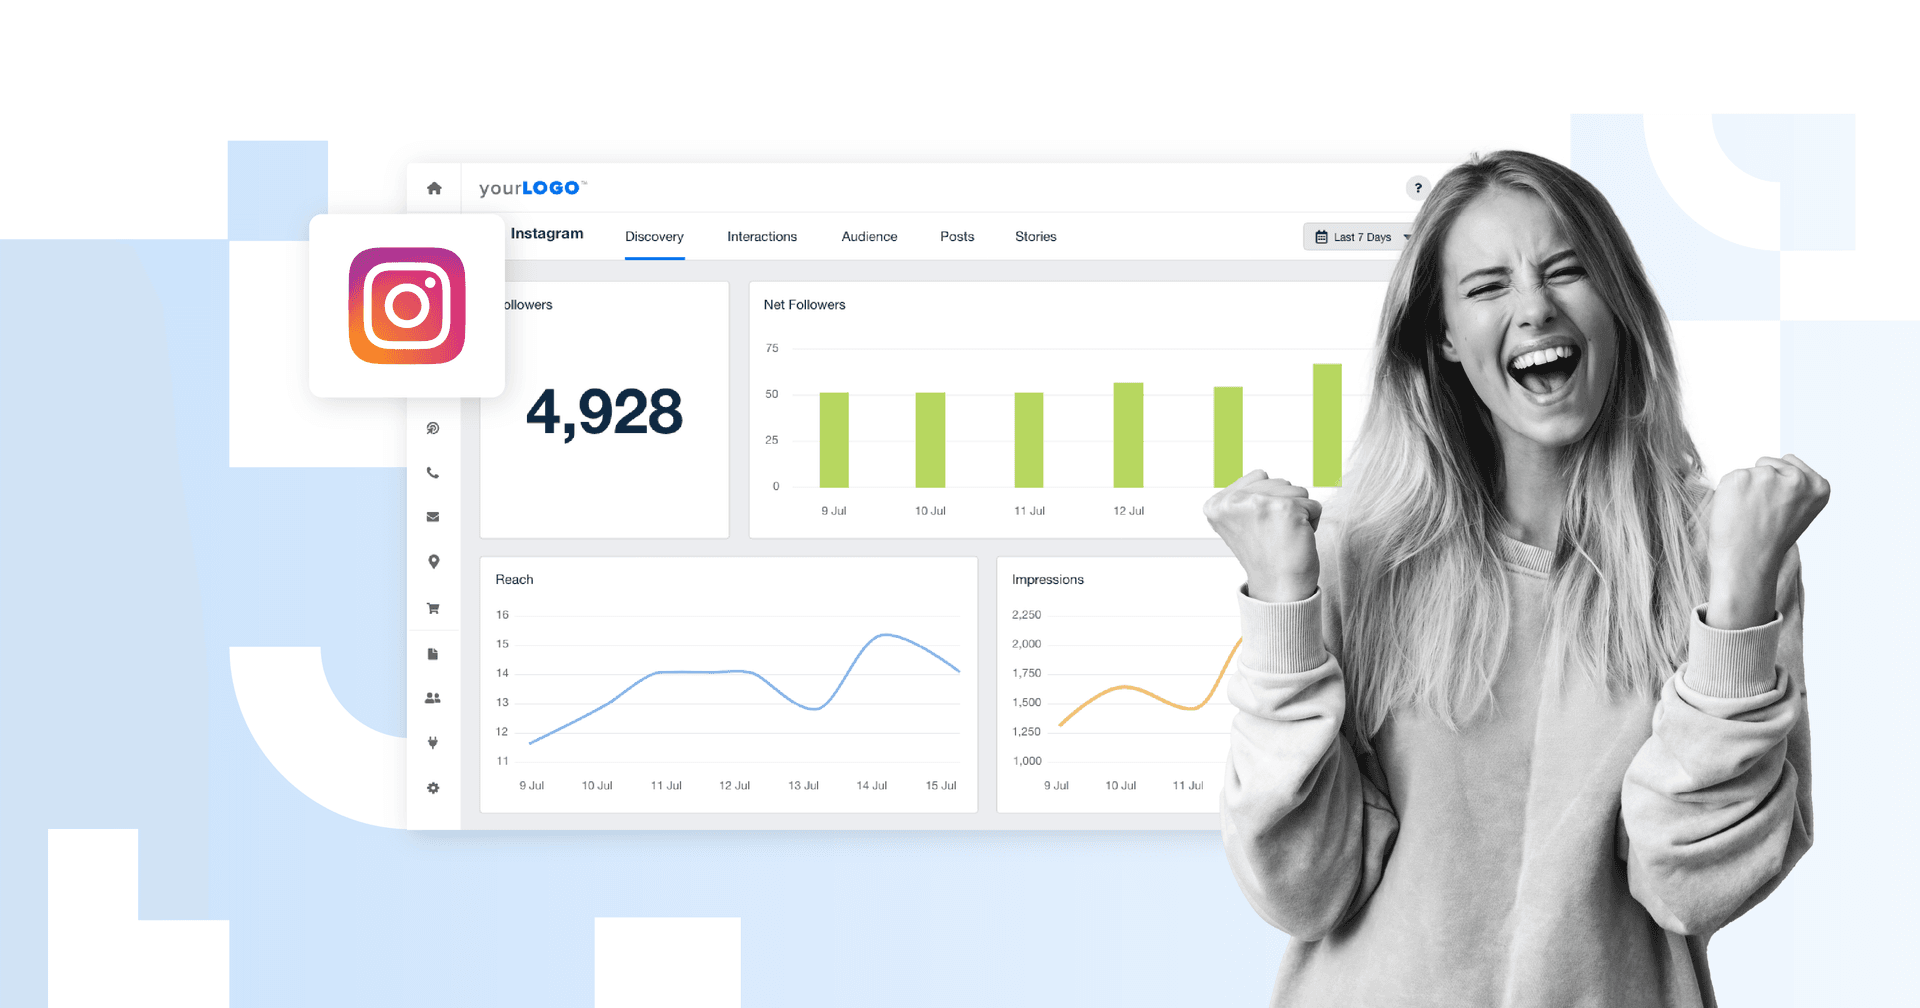
Total follower count reflects the size of your client’s current community, while follower growth rate shows how quickly that audience is increasing (or decreasing).
Together, these metrics reveal how well your content strategy is attracting new followers and keeping existing ones engaged.

View Instagram account insights alongside metrics from 80+ platforms. Streamline the reporting process for your marketing team–explore AgencyAnalytics, free for 14 days.
Reach & impressions
Reach and impressions reveal deeper insights into overall content visibility. For quick reference:
Reach measures the number of unique users who have specific Reels, posts, and Stories.
Impressions count the total number of times a post was viewed, including multiple views from the same person.
Reporting on both provides a more complete view of how far content travels and how often audiences engage with it.
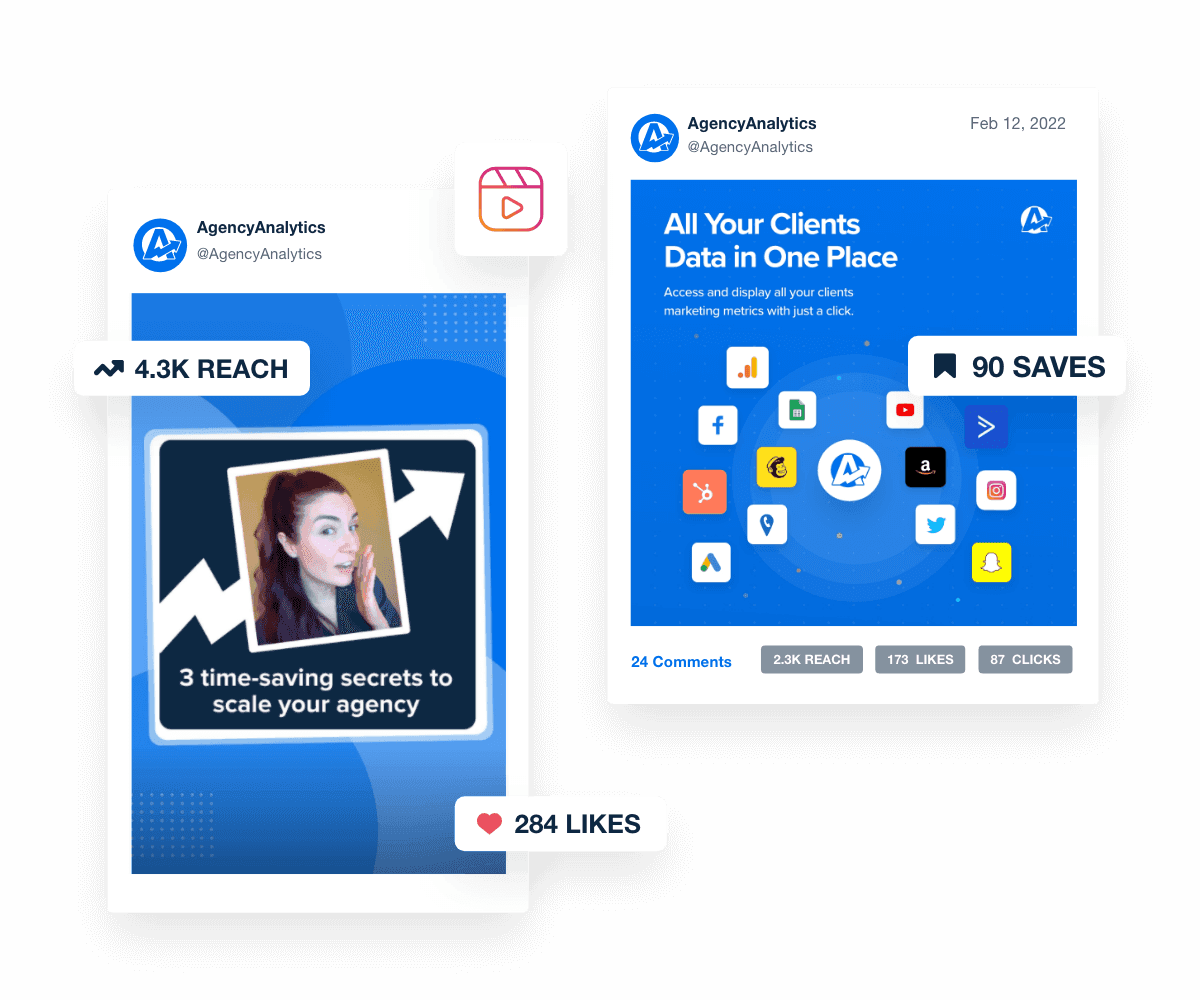
Engagement rate
Engagement rate measures how effectively your client’s Instagram content connects with its audience and drives meaningful interactions. It’s calculated based on total engagements—the combined number of likes, comments, saves, and shares—divided by reach.
Tracking this metric helps assess how well content resonates with the target audience and whether it’s inspiring desired actions.
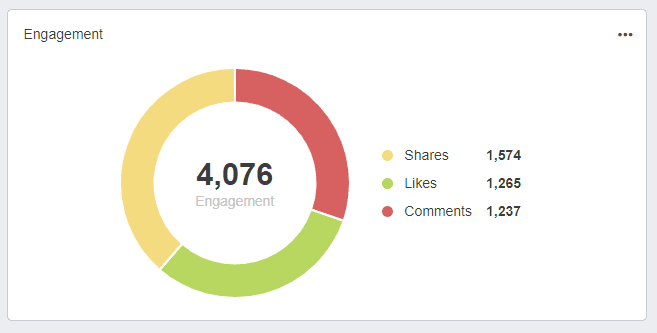
Show clients all the posts that drive engagement. View real-time data and get detailed insights about Instagram performance–try AgencyAnalytics today, it’s free for 14 days.
Audience demographics (age, gender, location)
Understanding who’s engaging with your client’s content is key to shaping an impactful strategy. Instagram offers demographic insights about the audience reached, including:
Top cities
Top countries
Primary age groups
Gender distribution
Use this information to tailor messaging, add new hashtags, or adjust posting times.

Performance by Instagram Posts, Reels, and Stories (Likes and Comments)
Evaluating how individual posts, Reels, and Stories perform helps identify the content types that resonate most with your client’s audience. Metrics such as likes and comments reveal how viewers are engaging with each format—whether it’s quick appreciation on a post, in-depth discussion about a Reel, or passive viewing for Instagram Stories.
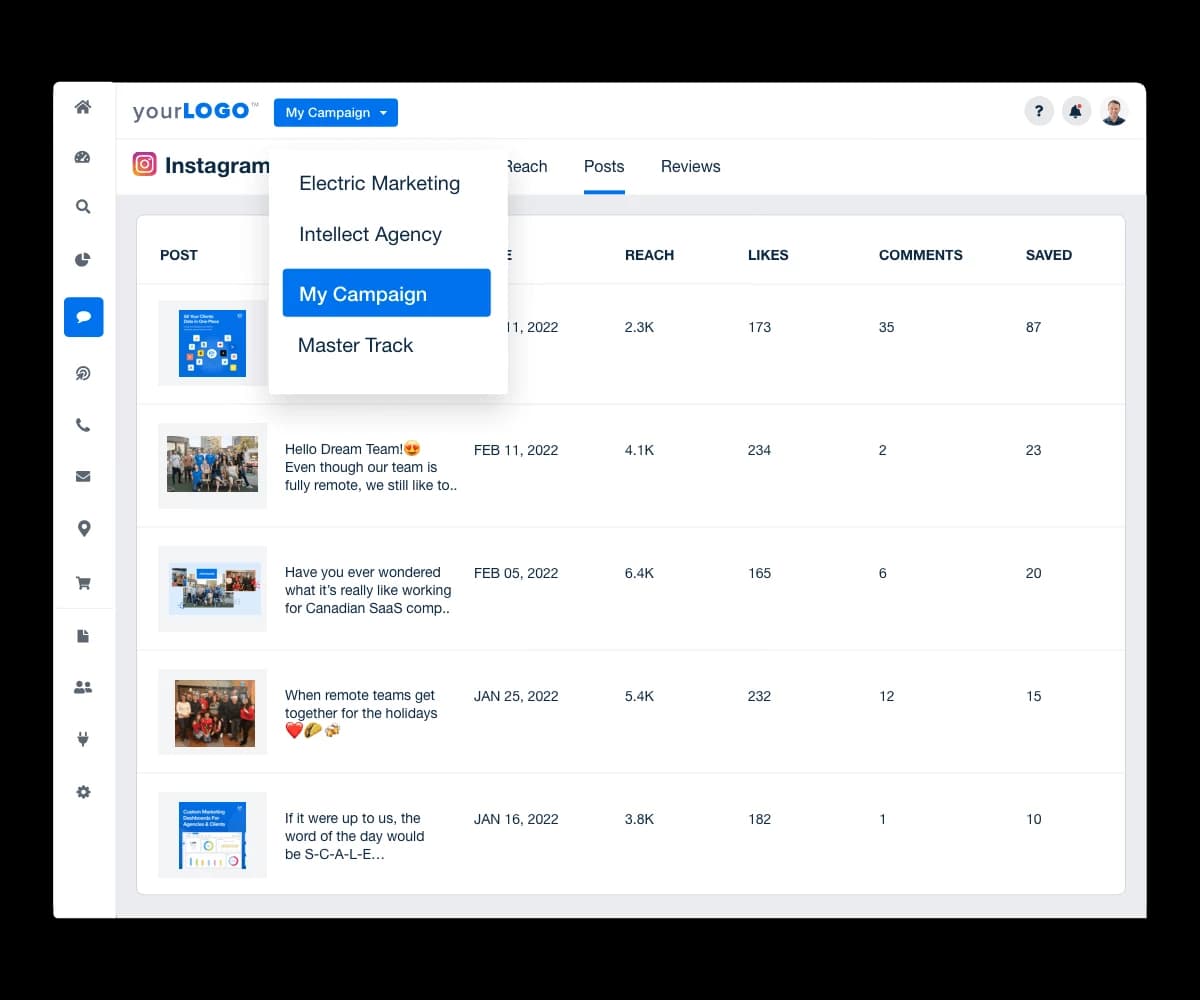
Access Instagram insights without having to log into each client’s account. Identify trends, measure Instagram post performance, and deliver custom reports–try AgencyAnalytics, free for 14 days.
How to create an Instagram analytics report: Step by step
Now that we’ve covered why Instagram data tracking matters and which metrics to focus on, let’s put it into action. Here’s how to create a report using Instagram Insights, along with a time-saving way to automate this process with AgencyAnalytics.
Using Instagram Insights
1. Switch to a professional account
Ensure your client’s profile is set to a Business or Creator account so Instagram Insights is available. This unlocks key metrics like reach, engagement, and audience data, which you’ll use in the report.
2. Set a reporting period and goals
Pick the timeframe—weekly, monthly, or quarterly—and define what you’re evaluating, such as awareness, engagement, traffic, or conversions. Clearly outlined goals determine which metrics you highlight.
3. Open Instagram Insights
Next, go to your client’s Professional Dashboard and tap “See All Insights”. Set the date range to match your reporting period and note the top-level numbers, such as accounts reached, accounts engaged, and follower change.
4. Analyze performance and audience insights
Use “Accounts Reached” and “Accounts Engaged” to see overall traction, then scan Posts, Reels, and Stories to spot which pieces earned the most reach and interactions. In the Audience tab, check out top locations, age ranges, gender mix, and active hours.
5. Compile the report
Summarize the period’s headline metrics, call out a few standout posts (with a sentence on why they worked), and include any shifts in audience behavior. Compile this data in Google Sheets or Excel, keep it visual with a few screenshots, and add short commentary for context.
Using AgencyAnalytics
Not in the mood to manually compile Instagram data? With AgencyAnalytics, you don’t have to.
Automatically pull performance data directly into your account and easily stream into a pre-built Instagram report template. Even view Instagram metrics alongside data from 80+ platforms! That way, clients get the complete picture of marketing performance.
Not sure where to start? Here’s how to set it up step by step.
(Want to skip the overview and go straight to a free template in AgencyAnalytics? Sign up for a 14-day trial, no credit card required.)
1. Set up an Instagram reporting integration
After signing into your AgencyAnalytics account:
Go to “Data Sources” in the left-hand menu.
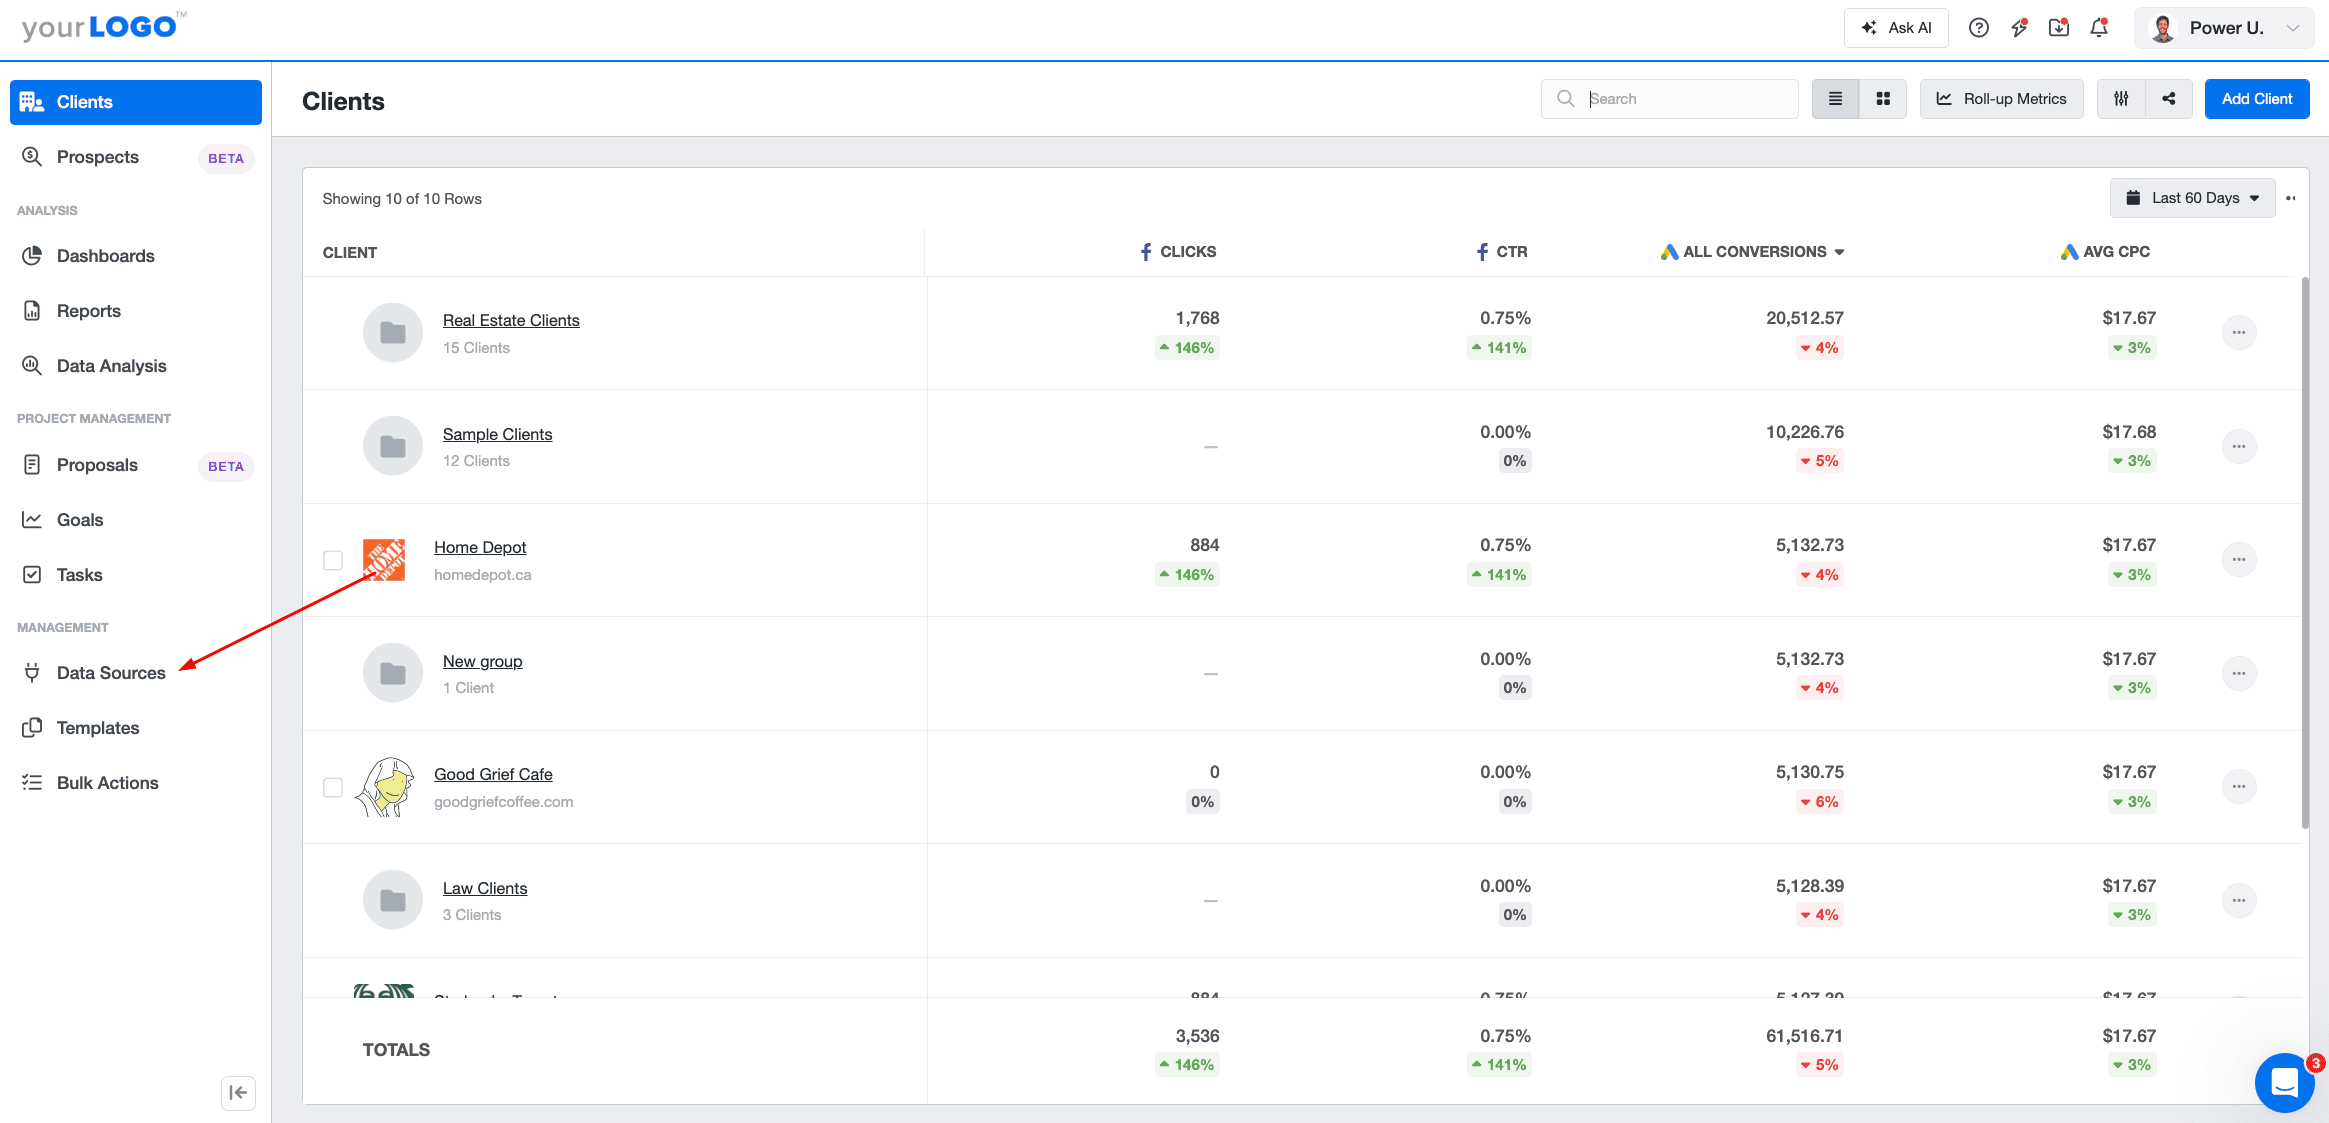
Click “Connect Data Sources” in the top-right corner.
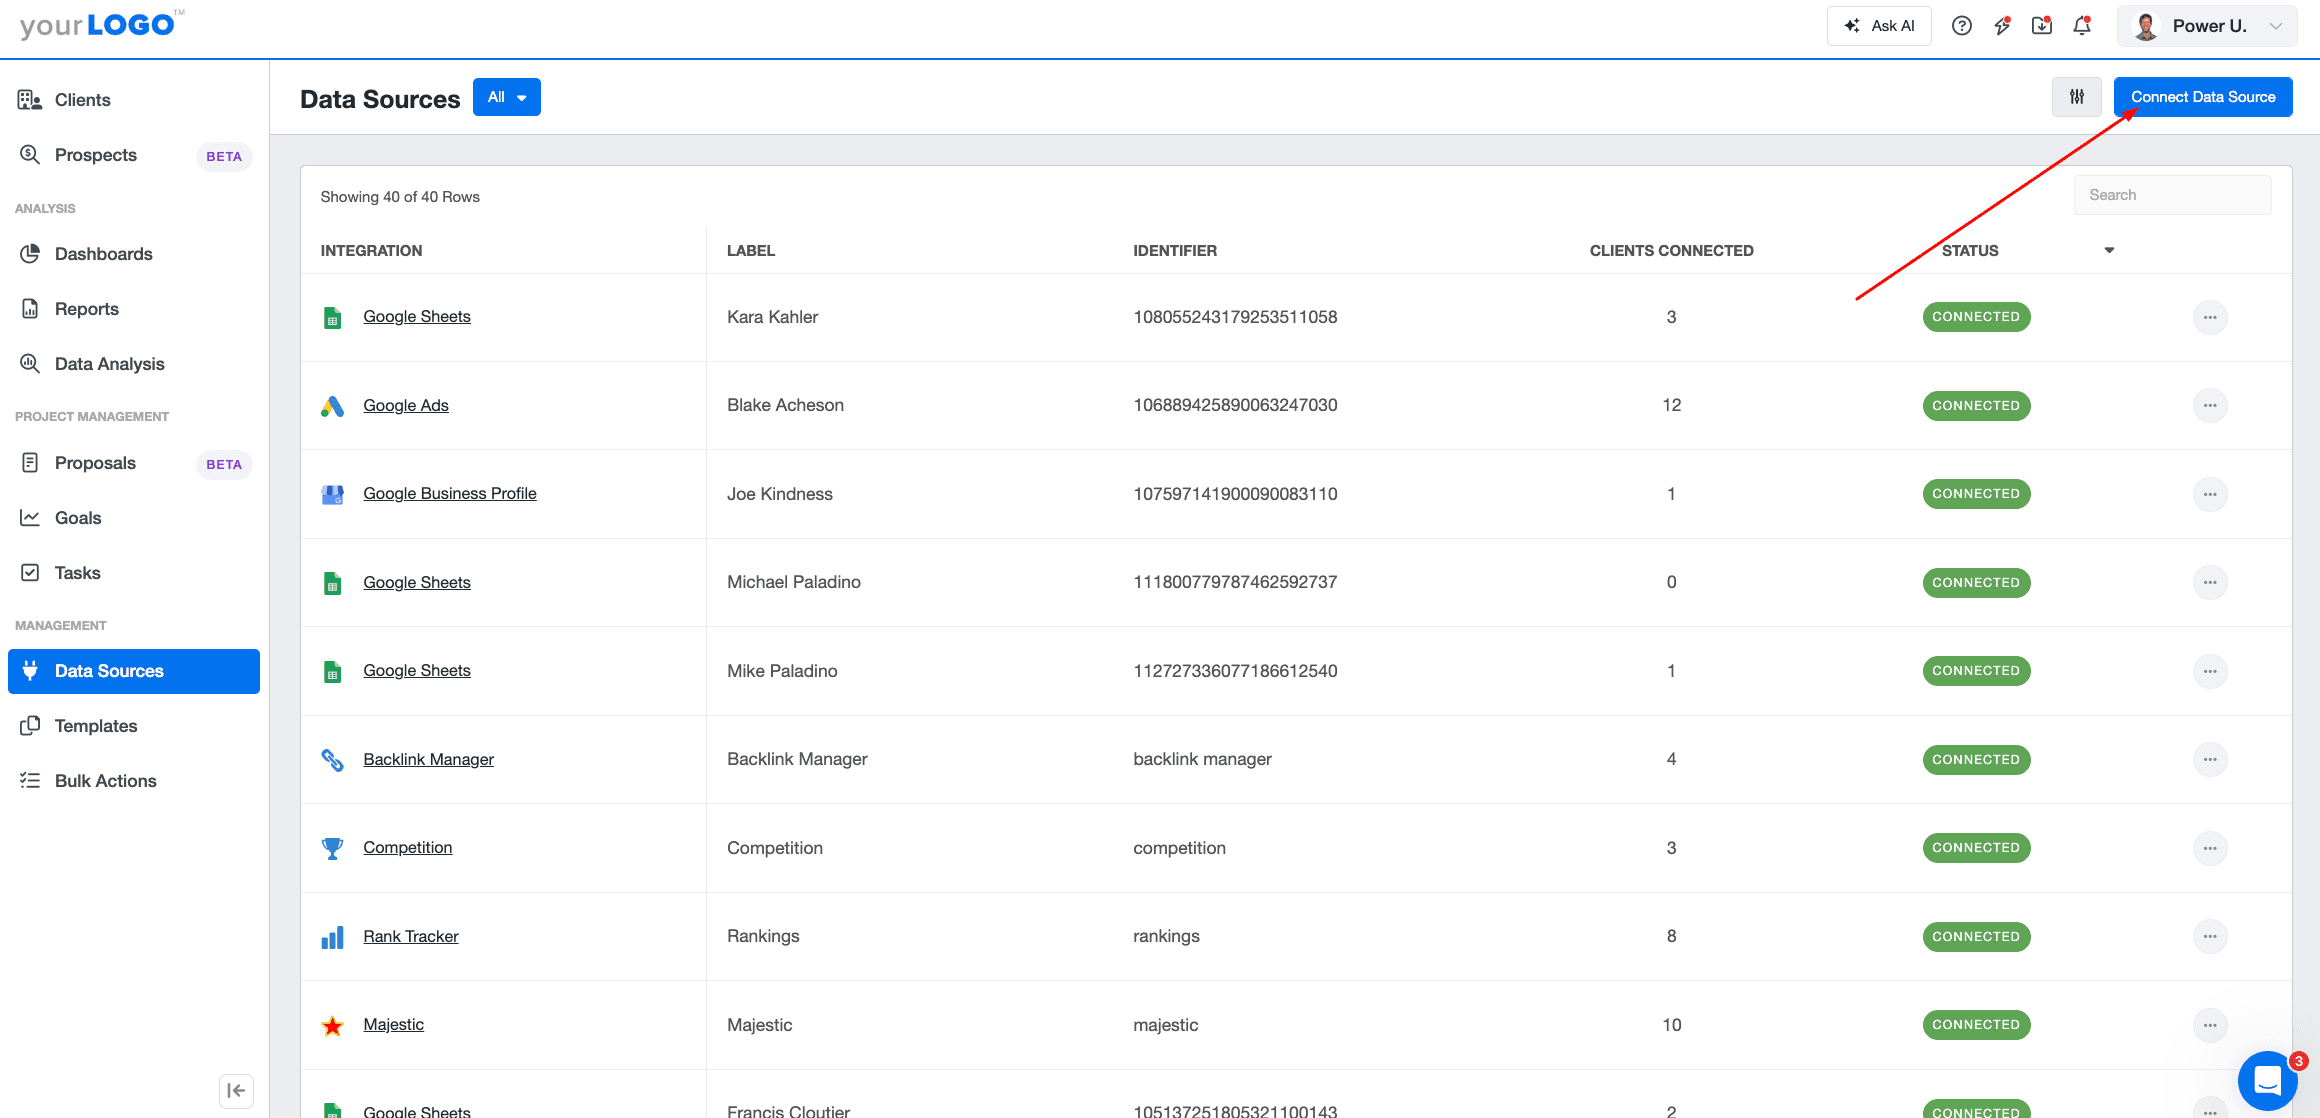
Select your client’s account, then choose Instagram from the list of integrations.
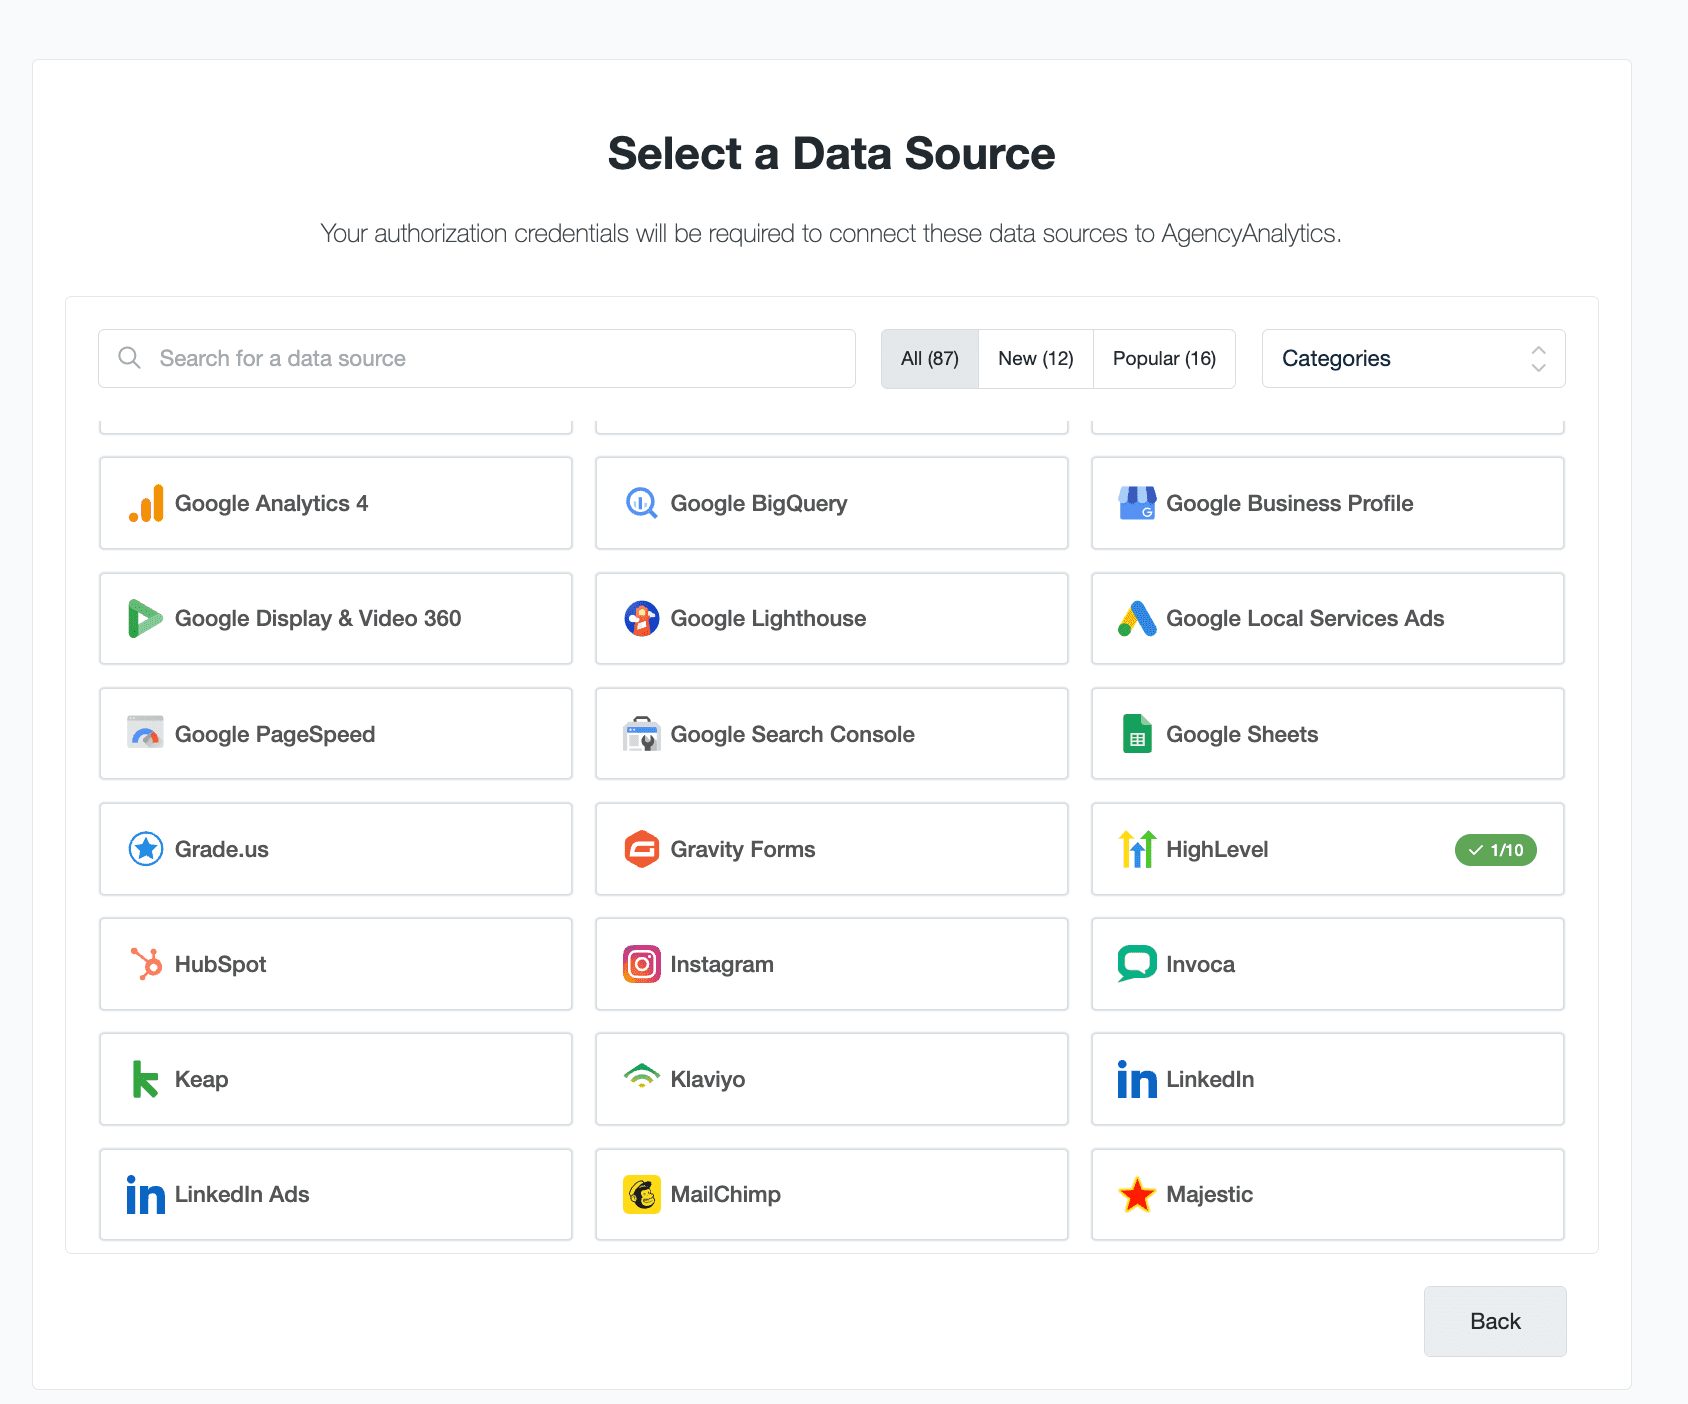
Click + Connect New Account, enter your client’s credentials, and you’re done! Once connected, your client’s Instagram data will start syncing automatically.
2. Create a customized Instagram report from a template
Once your integration is successfully connected:
Head to “Templates” in the left-hand menu.
Navigate to “Design Templates → Report → Document”.
Select the Instagram Report Template and give your new report a name.
From there, make the report your own. Refine the layout, adjust widgets, experiment with data visualizations, and much more. It’s also a good idea to combine your client’s Instagram metrics with Google Analytics data. This makes it easier to show how social engagement translates into website traffic, conversions, and overall ROI.
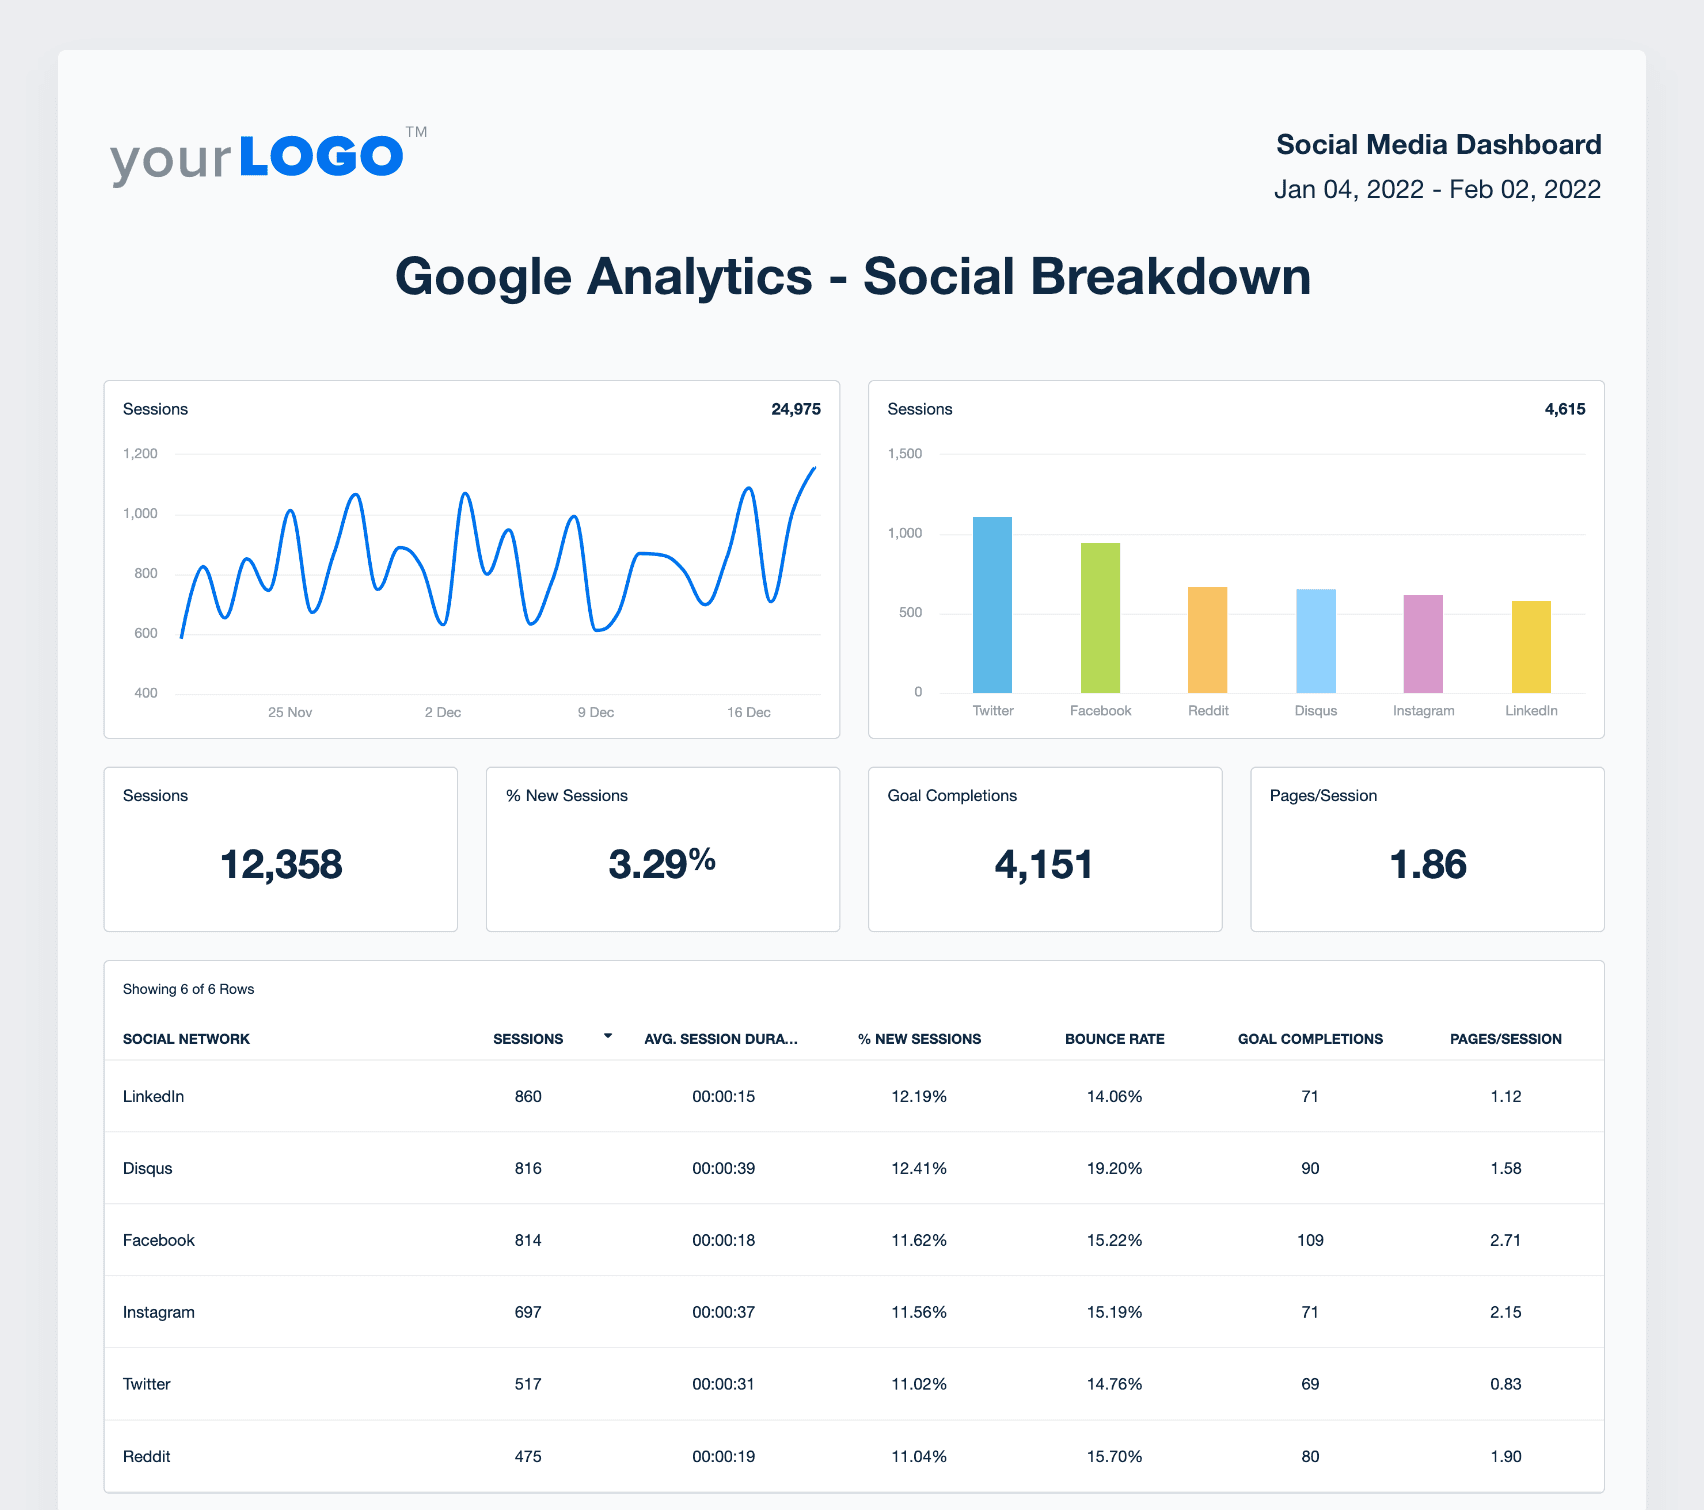
3. Schedule report delivery and automate
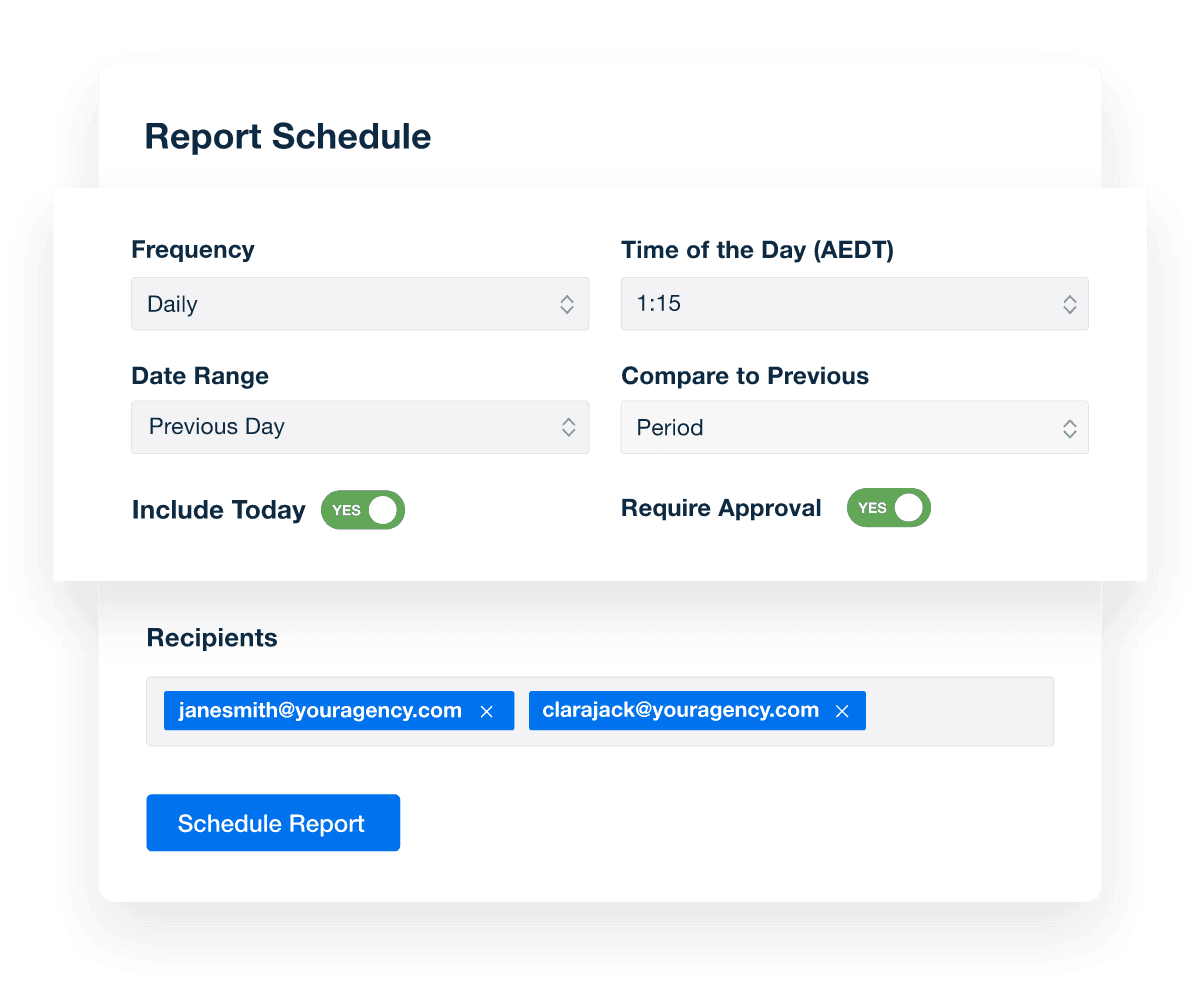
When your report is ready, click “Schedule” at the top of the page to automate delivery.
Choose how often you want it sent—weekly, monthly, or quarterly—then set the day, time, and date range. Once scheduled, your reports will be automatically delivered to your clients, keeping them informed without any manual effort.
How frequently should you send out Instagram performance reports?
The ideal reporting frequency depends on your client’s preferences, campaign goals, and overall timeline. There’s no one-size-fits-all approach, but your cadence should give enough time for meaningful results to emerge. In most cases, monthly reports strike the right balance.
Our monthly reporting gives them a look at the month as a whole. We have several other touchpoints throughout the month, but we allow data to accumulate to provide insight into their account's overall performance.
Jamie Contreras, CEO, Optemyz Solutions
That said, some campaigns call for different rhythms:
Weekly reporting works best for fast-moving or time-sensitive initiatives, such as event promotions, product launches, or seasonal campaigns. They provide real-time insights into audience engagement and allow quick pivots if something isn’t performing as expected.
Quarterly reports are ideal for long-term initiatives–like brand awareness or community-building campaigns—where progress is measured over time. This cadence offers a broader view of overall growth, patterns, and sustainability.
Ultimately, choose a reporting schedule that aligns with each client’s strategy, goals, and capacity to review insights. The right frequency ensures consistent communication while maintaining the value of your reports.
Don’t start from scratch–use a pre-made template instead
As we’ve covered, creating an Instagram analytics report doesn’t have to be complicated.
With the right setup, you’ll have everything you need to track performance across posts, Stories, and Reels—all in one place. Measure unique accounts reached, make data-driven decisions, and view metrics that show exactly how your clients’ content is performing.
Instead of piecing together data across multiple Instagram accounts, invest in a platform like AgencyAnalytics. Automate data retrieval across 80+ platforms, customize dashboards, generate an 11-second Smart report, and so much more!
AgencyAnalytics takes digital marketing campaigns to the next level. The dashboards empower agencies and clients, providing a one-login solution to understand campaign performance across SEO, Google Ads, Social Media, and more.

Bonfire
Ready to try a free Instagram report template in AgencyAnalytics? All you have to do is sign up for a free 14-day trial today.
FAQs: Creating an Instagram Analytics Report
Still have questions about Instagram analytics reports? Don’t worry—we’ve got you covered.
An Instagram analytics report is a data-driven summary that shows how a client’s Instagram account is performing. It includes key metrics like follower growth, engagement rate, reach, impressions, and post-level performance. These reports help agencies track trends, highlight wins, and provide clear, visual proof of social media impact over time.
Agencies should create Instagram analytics reports to clearly show clients what’s working, where to improve, and how content is driving results. These reports build trust, save time with automated workflows, and help retain clients by consistently proving ROI and campaign effectiveness.
An Instagram report should include follower count and growth rate, engagement rate, reach, impressions, audience demographics, and performance by post, Reel, and Story. These metrics provide a complete view of content effectiveness and help agencies shape smarter, data-backed strategies.
To create a manual Instagram analytics report, switch to a professional account, open Instagram Insights, select your reporting period, and gather key metrics like reach, engagement, and follower growth. Add screenshots, commentary, and organize the data in Google Sheets or Excel to share with clients.
Automate Instagram reporting by using AgencyAnalytics. Connect your client’s Instagram account, use a pre-built report template, customize the layout, and schedule reports for automatic delivery. This eliminates manual work and gives clients real-time access to performance insights.

Written by
Paul Stainton is a digital marketing leader with extensive experience creating brand value through digital transformation, eCommerce strategies, brand strategy, and go-to-market execution.
Read more posts by Paul StaintonSee how 7,000+ marketing agencies help clients win
Free 14-day trial. No credit card required.


