Table of Contents
QUICK SUMMARY:
Instagram analytics reveal how an Instagram account performs across reach, impressions, engagement rate, follower growth, and content effectiveness. These insights help agencies understand what resonates, when audiences interact most, and how content contributes to business goals. This guide breaks down the most important Instagram analytics metrics, how to interpret Instagram Insights, and why agencies benefit from using a reporting platform with cross-channel context and automated reporting features.
Tracking Instagram metrics is straightforward. Translating those numbers into business impact takes more skill.
Clients often check Instagram Insights themselves, but those page-level metrics rarely tell the full story. What they actually want are account insights that explain why engagement shifts, which content formats perform best, and how Instagram activity supports broader goals.
They’re usually running campaigns across multiple channels, too. Without connecting social analytics to website traffic, email activity, or sales data, results stay siloed. That’s where agencies step in—with context, clarity, and a clearer narrative around performance.
To support stronger reporting, agencies often combine Instagram analytics tools with centralized dashboards that display historical data, cross-channel metrics, and customizable views. This approach helps your team see which Instagram posts drive engagement, identify optimal posting times, highlight top-performing content, and uncover meaningful patterns across longer date ranges. It also gives clients clearer insight into how social activity contributes to growth.
In this guide, we’ll cover the Instagram analytics metrics that matter most, how to turn them into meaningful insights for clients, and how a unified reporting platform helps agencies present results with more clarity and less manual work.
What are Instagram analytics?
Instagram analytics are the performance insights that show how an Instagram account attracts, engages, and retains an audience. These insights include reach, impressions, engagement rate, follower demographics, content interactions, and long-term trends across different content formats. Understanding these numbers helps agencies refine strategy, improve creative decisions, and explain what’s actually driving performance.
Most baseline metrics appear within Instagram Insights, which gives Business and Creator accounts access to audience details, profile visits, content results, and account insights across Reels, Stories, and feed posts. But agencies often need deeper visibility—especially when clients expect historical data, flexible reporting, and a clearer picture of how Instagram activity influences traffic, conversions, and sales.
To support that work, agencies often look beyond native insights and use third-party marketing analytics tools with advanced features like customizable dashboards, cross-platform comparison, longer data retention, and automated reporting. These tools help teams assess specific metrics, compare results across channels, and maintain consistency in a scalable reporting workflow.
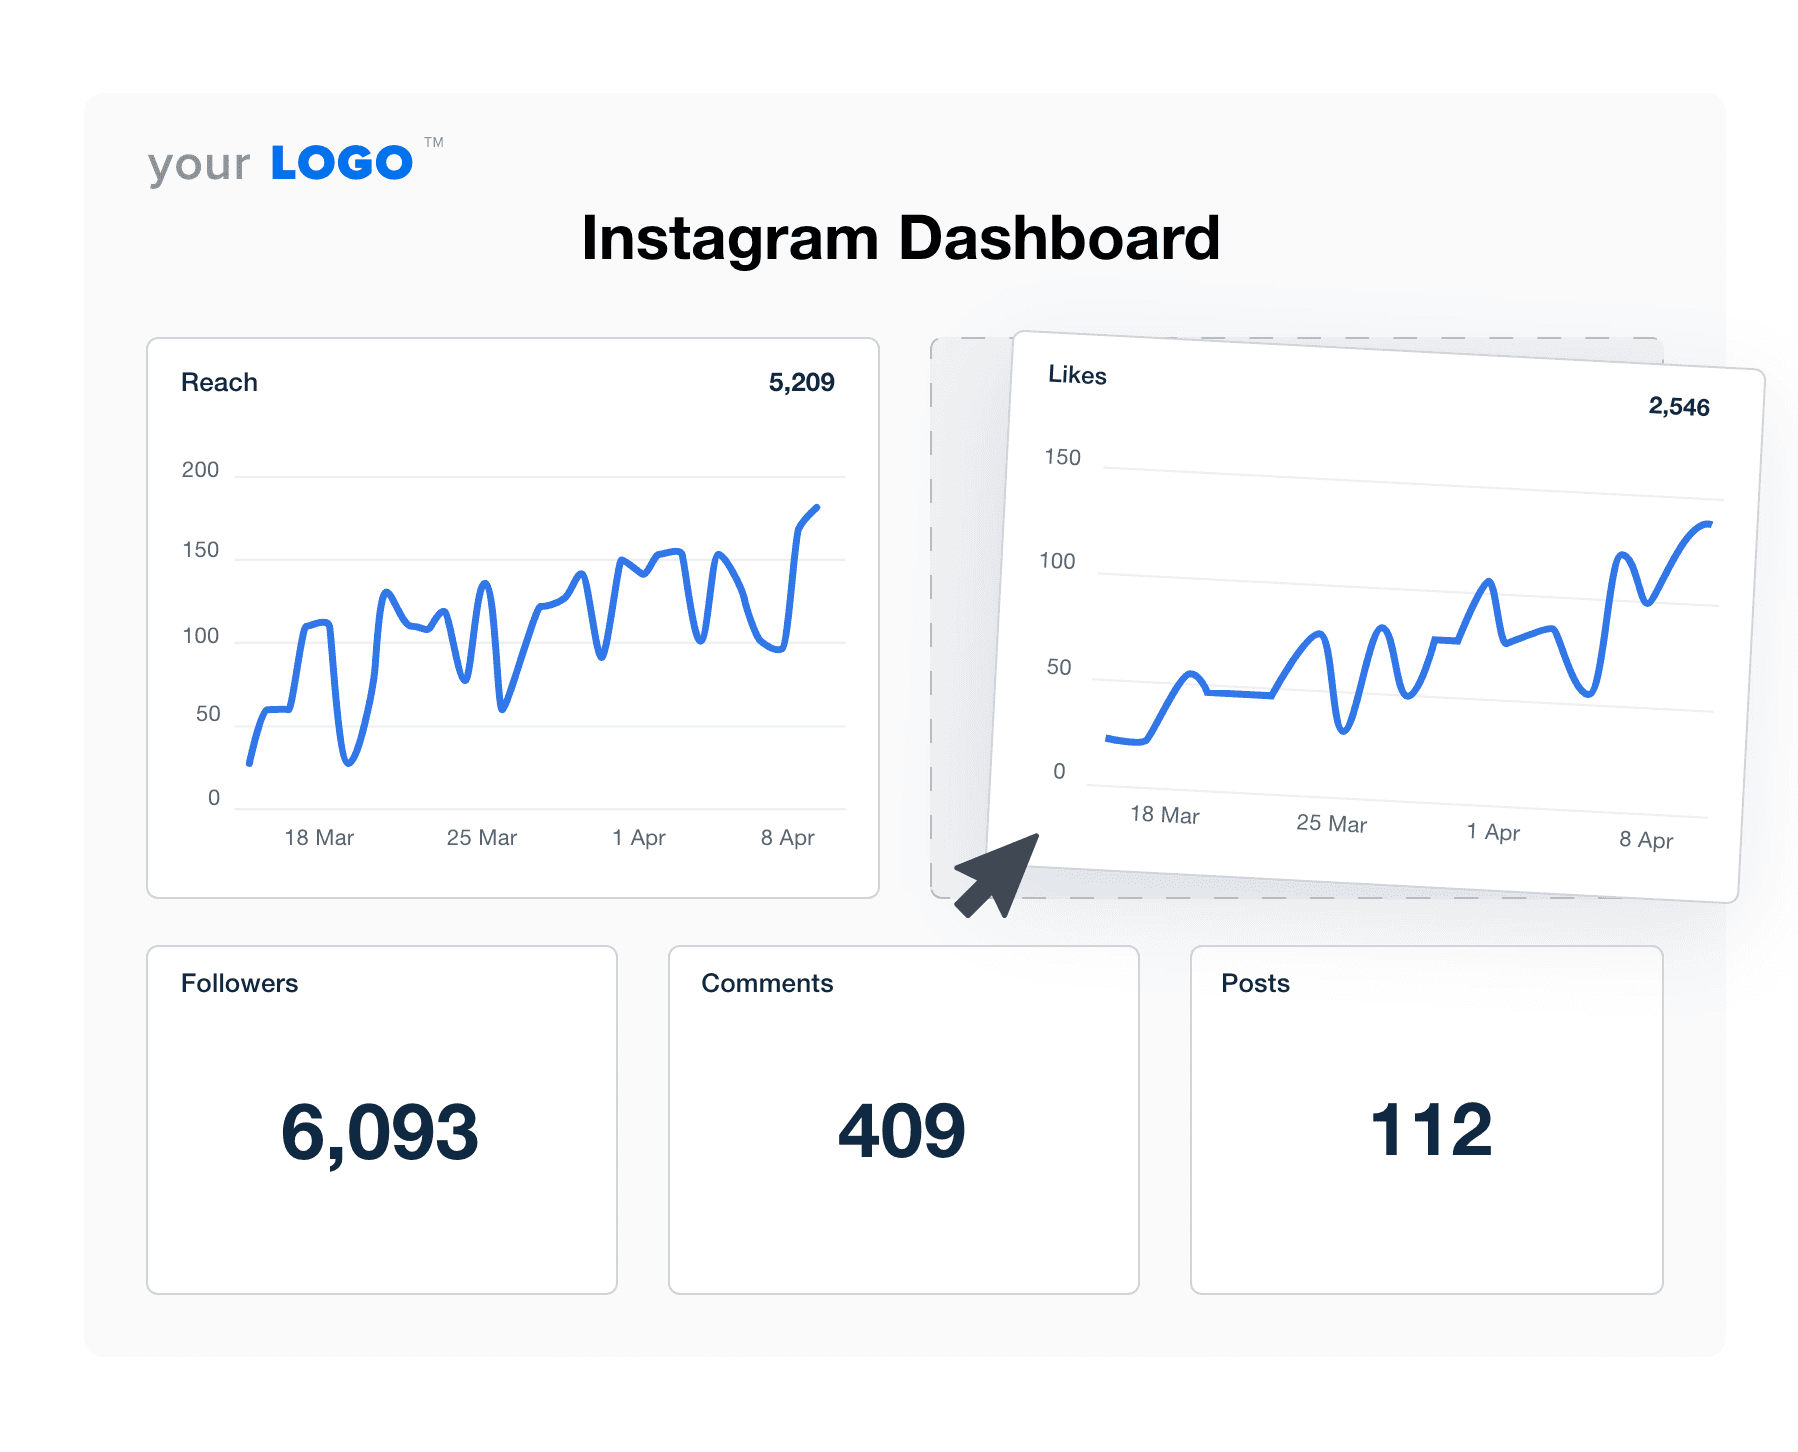
Using a dedicated reporting platform also helps agencies view Instagram performance alongside website activity, ad campaigns, and email data. This cross-channel view makes it easier to analyze video views, understand which Instagram posts perform best, track unique accounts reached, and highlight how Instagram contributes to growth across broader marketing efforts.
Why Instagram analytics matter
Instagram analytics are a core part of any performance-driven social strategy. They show what resonates with audiences, where engagement rate trends up or down, and how Instagram activity supports your clients’ business goals.
We rely completely on social media analytics. They help us make better decisions (backed by data). Otherwise, we’d be winging it, and you shouldn’t be winging it when it comes to the success of your clients' businesses.
Hayley Peters, Co-Owner, OhMyDigital
More specifically, here’s why they’re essential to client reporting and informed decision-making.
These data points give your agency more accurate account insights, help you explain results clearly, and support more strategic decisions across channels.
Use Case | Description |
|---|---|
Optimize Content Strategies | Analyze engagement metrics and audience demographics to identify what content performs best. Then adjust messaging, formats, and timing to match these preferences. |
Measure Campaign Effectiveness | Evaluate influencer analytics alongside performance data from Instagram Stories, Reels, and sponsored posts. Track engagement, reach, and conversions to understand what’s working. |
Understand Target Audience Behavior | Identifying when and how Instagram followers engage is a strategic way to optimize posting times, formats, and messaging. |
Track Long-Term Performance | Monitor growth trends, average engagement rates, and content effectiveness to show progress over time and inform future strategies. |
Support Business Objectives | Align analytics with bigger goals like product launches, ad spend optimization, and brand visibility. |
Clients care about results. Detailed Instagram analytics help your agency connect content performance to real outcomes—like traffic, conversions, and long-term audience growth.
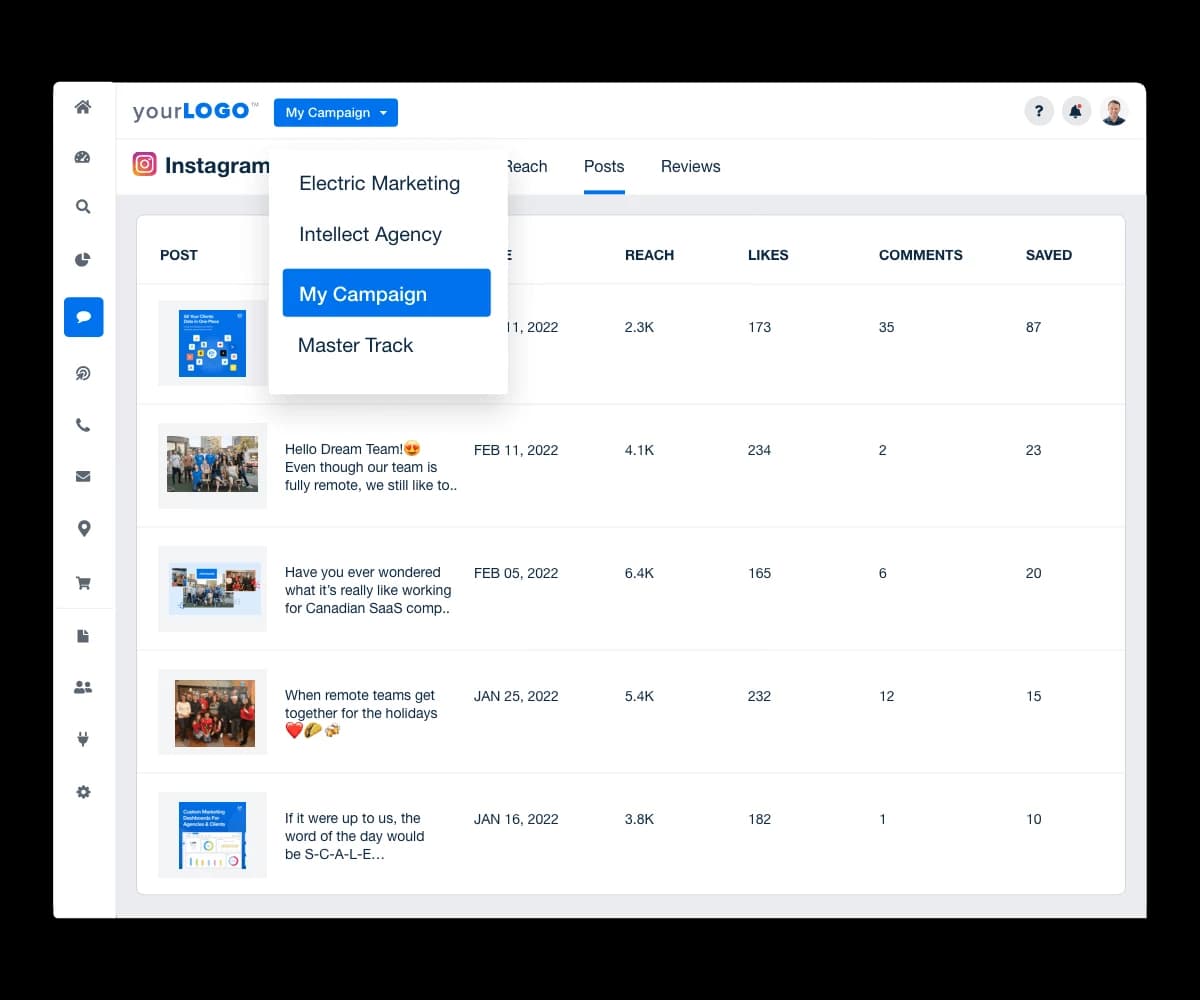
Access detailed Instagram profile insights across multiple clients. Ensure your social media managers have the data they need to make informed decisions–try AgencyAnalytics, free for 14 days.
Top Instagram analytics metrics to measure and track
To measure the effectiveness of a client’s Instagram presence, look at analytics from two angles: audience behavior and content performance. These Instagram analytics give your agency clearer account insights, support stronger reporting, and highlight the content that drives the highest engagement rate.
1. Instagram audience insights
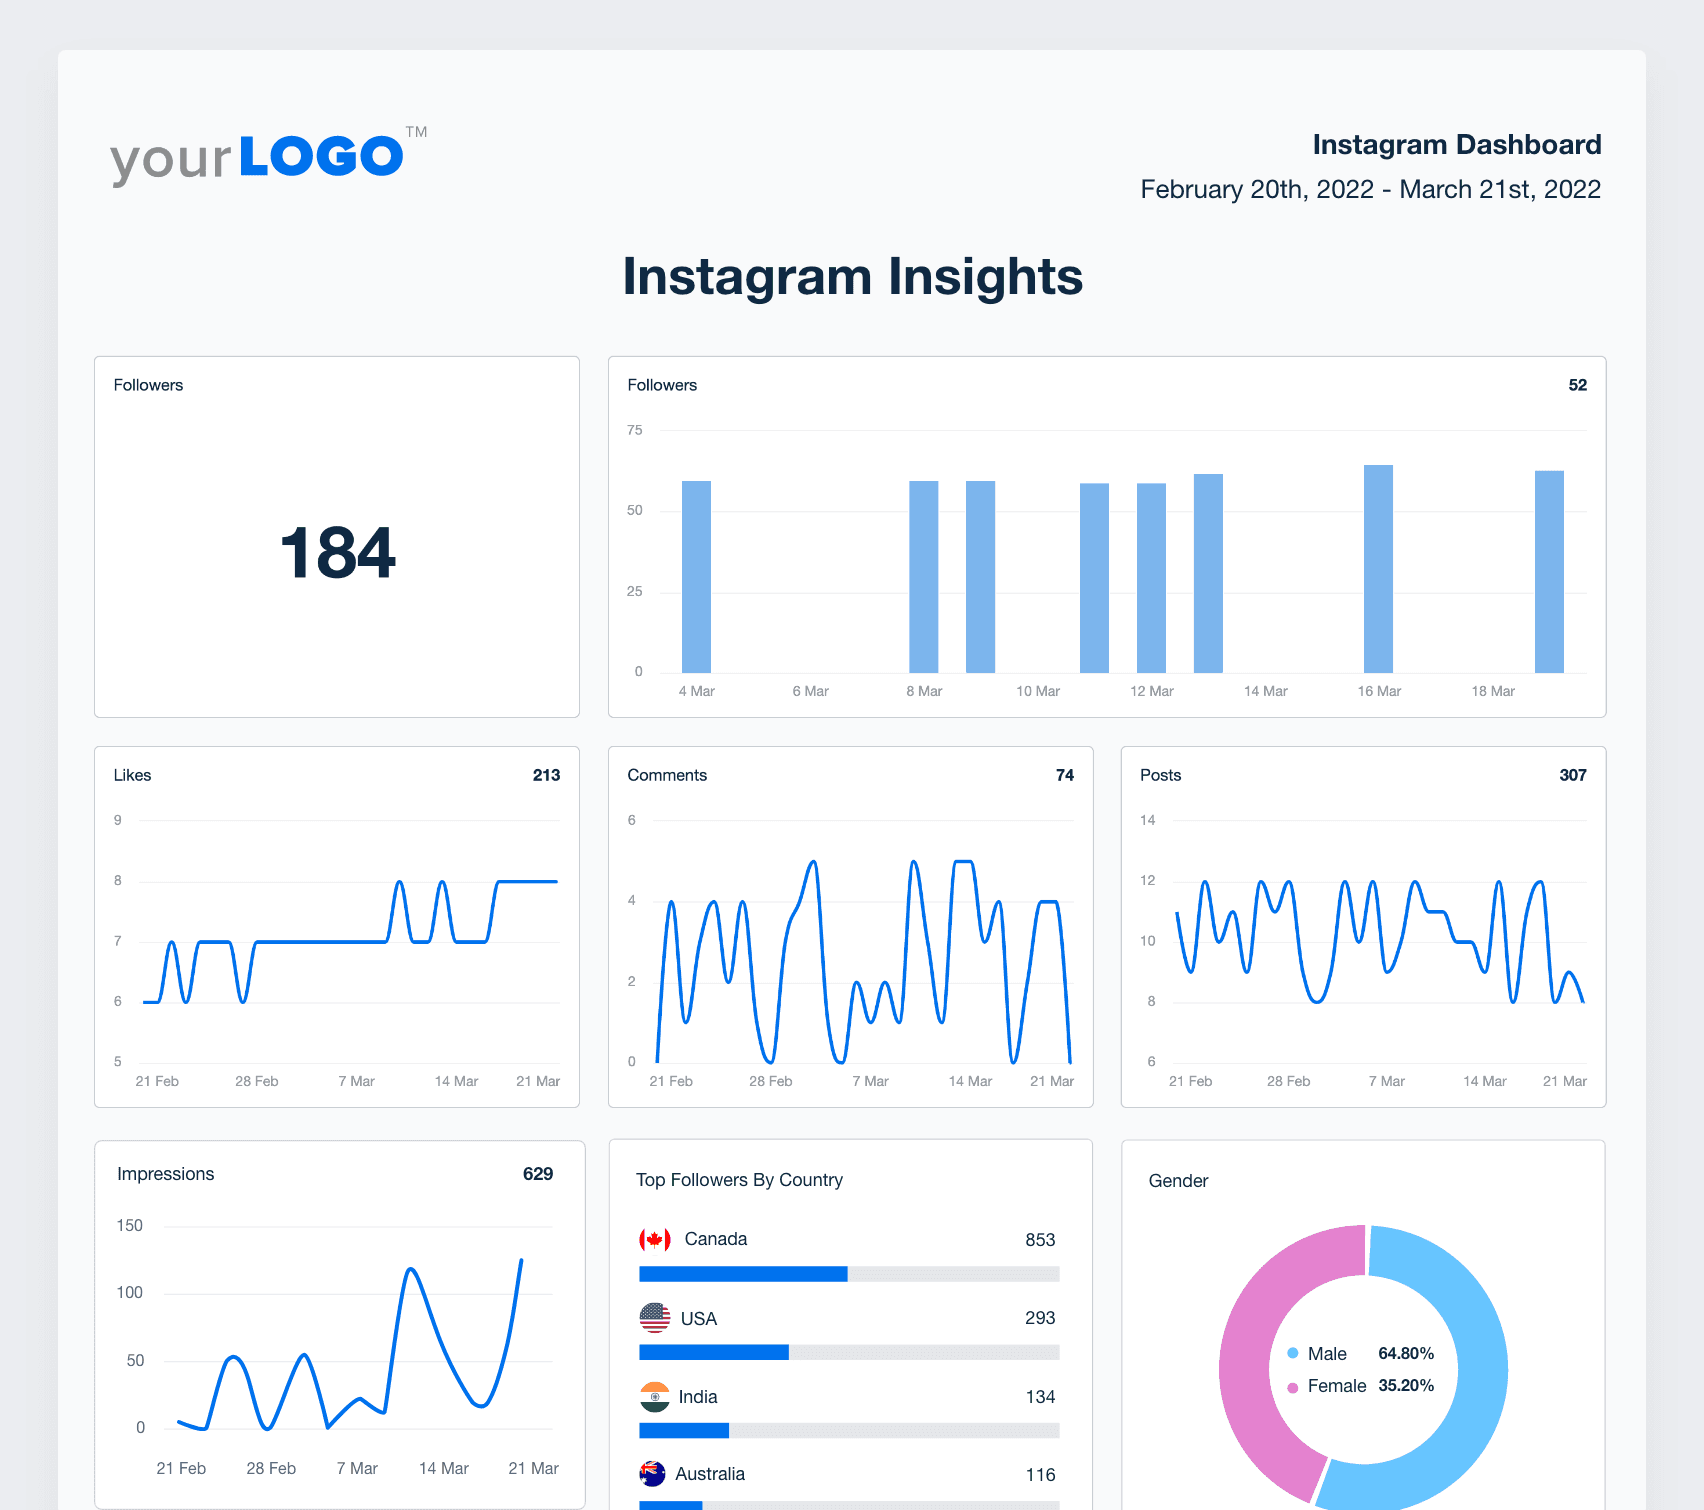
Instagram audience insights help your agency understand who is interacting with your client’s content. These details highlight audience demographics, behavior patterns, and changes in follower activity over time.
These metrics often include age distribution, age ranges, top locations, and unique accounts reached. Tracking these patterns helps your team refine targeting and identify new audience segments worth exploring.
2. Instagram content insights
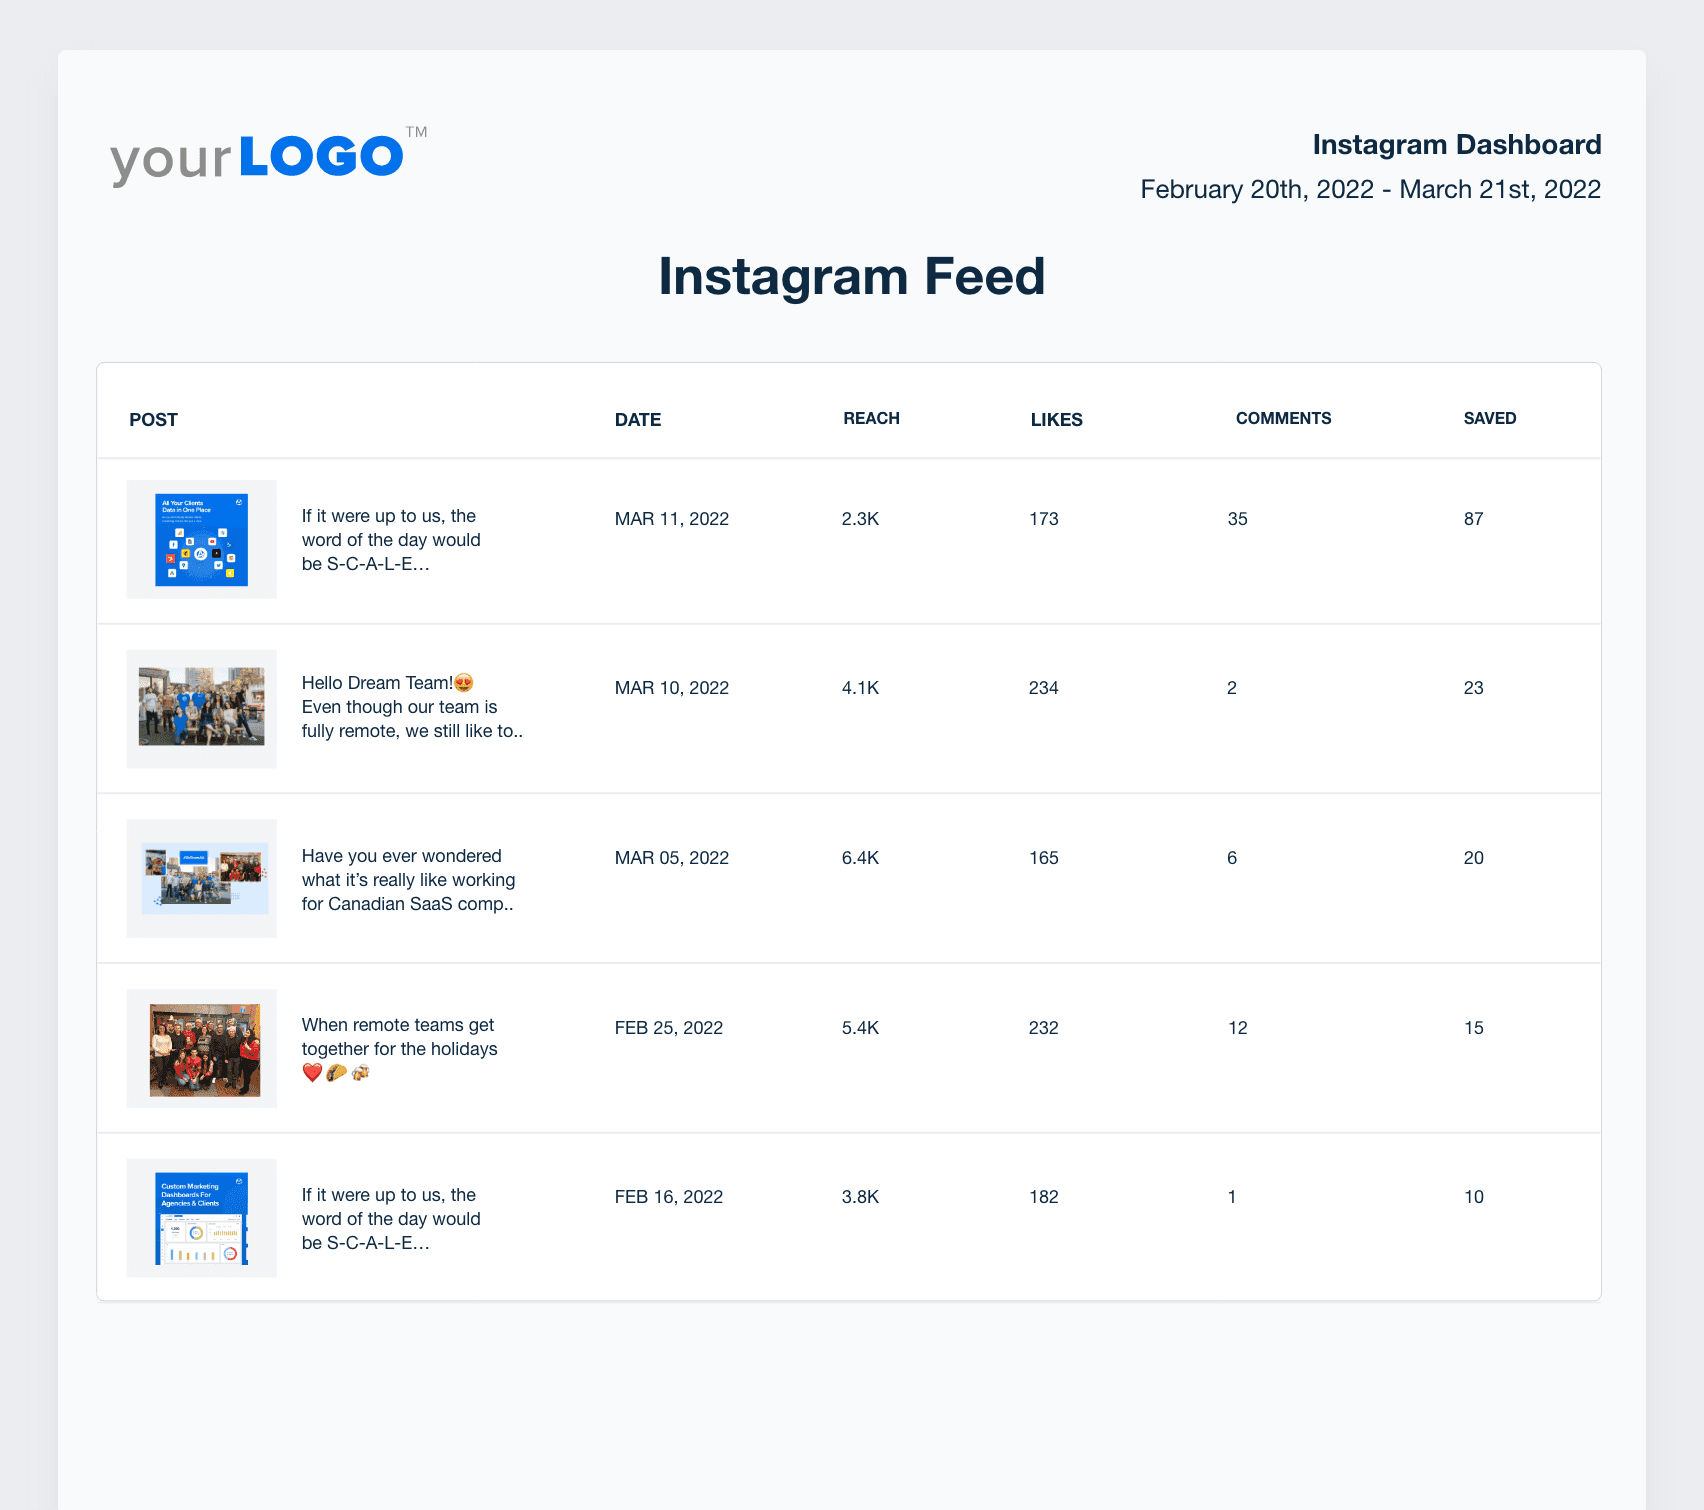
Instagram content insights show how each post, Reel, or Story performs. Reviewing these metrics helps your team understand which formats drive the strongest interactions, which Instagram posts perform best, and where there are opportunities to improve engagement.
Content insights also help you evaluate video views, saves, comments, and other specific metrics that show how well each format contributes to your client’s broader goals.
3. Follower growth rate
Follower growth rate measures how quickly an Instagram account gains or loses followers over a specific period. Unlike a simple follower count, this metric highlights momentum and helps your team identify positive trends, stagnation, or sudden drops worth investigating. Reviewing historical data provides helpful context when explaining long-term performance to clients.
A steady growth rate suggests the content is relevant and compelling. On the other hand, a decrease may indicate a disconnect between what’s being shared and audience expectations.
Our clients are busy and don't understand marketing. Having key metrics that reflect business growth makes their lives easier and allows them to make good decisions quickly.
Lane Rizzardini, Co-Owner, Marion Relationship Marketing
4. Reach and impressions
These are both key social media analytics, but each has its own specific purpose and value. Reach reflects how many unique users saw a particular post, while impressions represent the total number of times a post is viewed.
Comparing reach trends across different date ranges helps your team determine when your client’s audience is most active and whether certain formats consistently attract more unique accounts.

Other Instagram analytics tools stop at in-app metrics. Instead, get the full picture by viewing Instagram metrics alongside paid ads performance, YouTube analytics, and more. Explore AgencyAnalytics today, free for 14 days.
5. Interactions & engagement rate
Interactions include actions like likes, comments, post shares, and saves, which reflect how users are responding to content. Consistent engagement tracking also reveals how interest changes as your content mix evolves, giving you clearer insight into what keeps audiences active and involved.
Engagement rate calculates the percentage of followers or viewers who take those actions, providing a normalized way to measure content performance. It can be assessed per post or averaged across an account.
A consistently high engagement rate shows that content is prompting real interaction, not just views. This reflects relevance to both the audience and Instagram’s algorithm, which boosts reach. Over time, strong engagement also leads to deeper brand interest, more profile visits, and an increased chance of conversion.
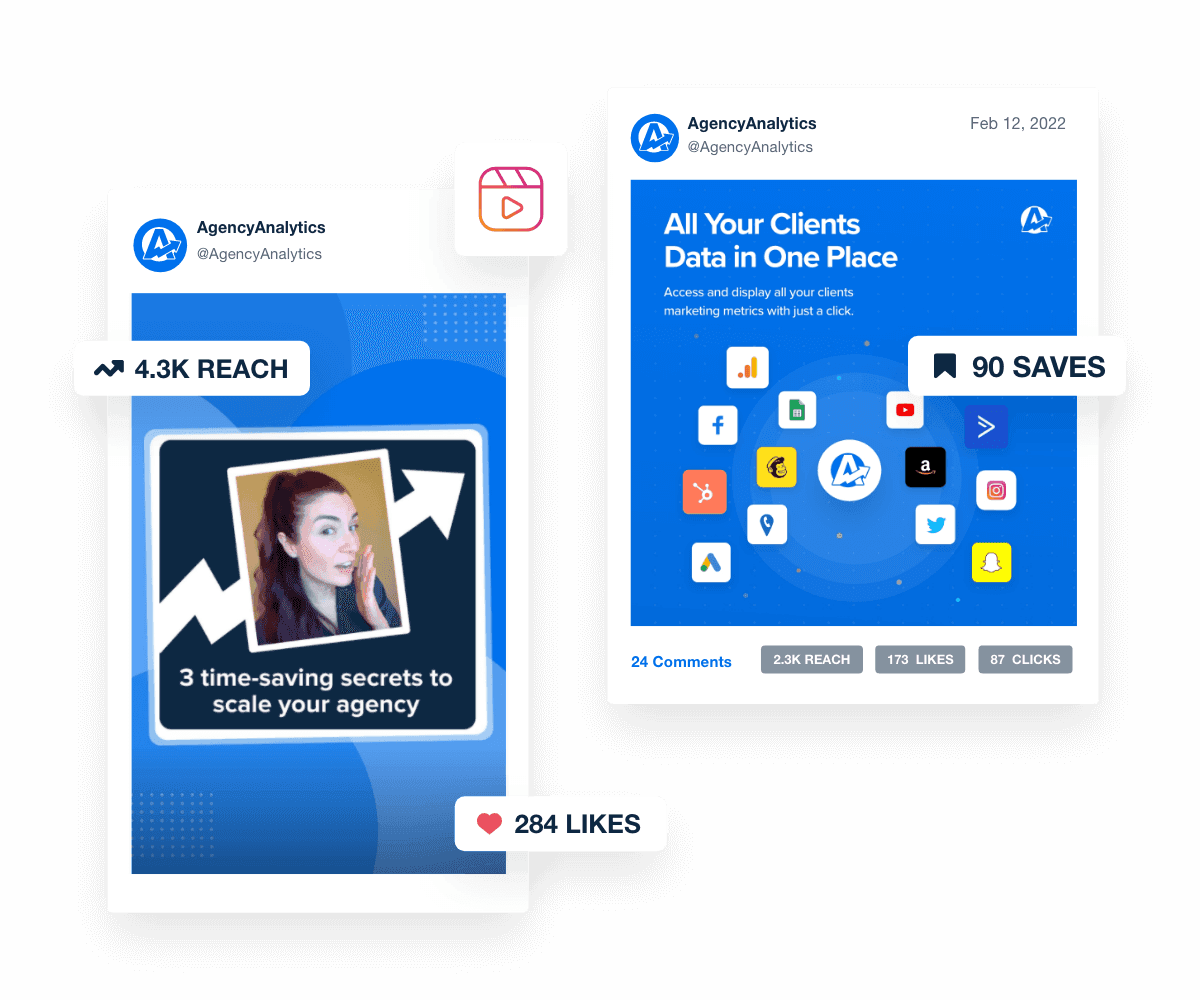
Pull in key Instagram analytics and see which posts drive the most engagement. View these valuable insights via the Instagram integration in AgencyAnalytics; it offers much more than other analytics tools. Try it free for 14 days.
6. Audience growth and demographics
This data shows whether the right people are finding and staying on a client’s Instagram account. Tracking growth alongside engagement helps determine if new followers match the target market. These insights are especially valuable for any Instagram business account aiming to reach a defined target market with more precision.
It’s also a way to discover untapped markets, create more tailored messaging, and ensure the right audiences are being reached.

Agency Tip: Simplify campaign reporting with a Meta report template. It’s designed to showcase performance across the Meta ecosystem in a professional, visual format.
7. Content performance by format
Analyzing content performance by format provides insights into what resonates most with a client’s audience. For example, Reels might drive higher impressions, while carousel posts could generate more saves or comments. This allows your team to tailor content strategies based on format-specific strengths and campaign goals.
It also highlights which formats generate strong top-performing content, helping your team refine creative decisions going forward.
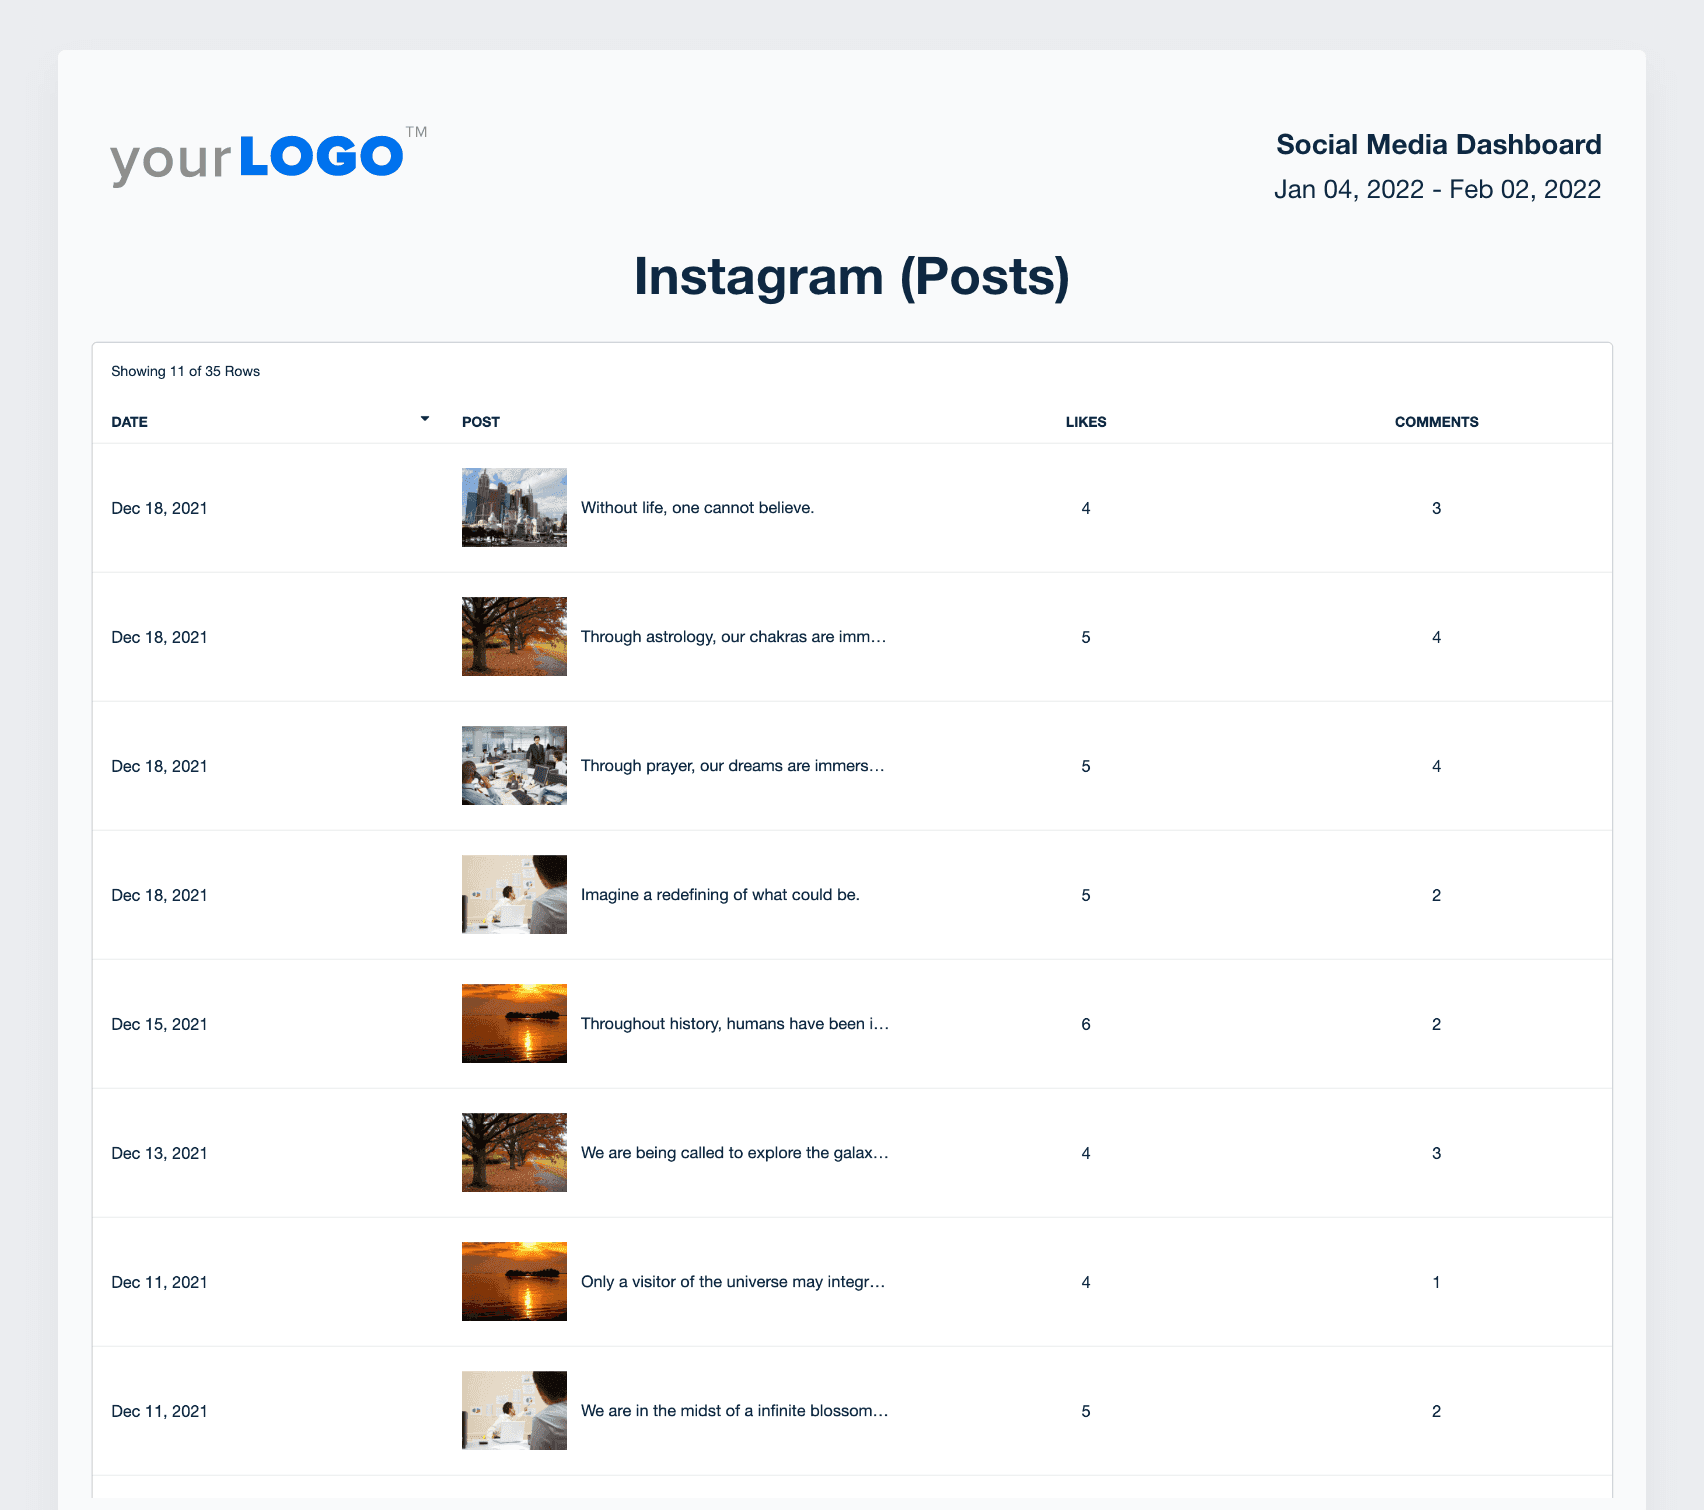
8. Website traffic from social channels
Tracking website traffic from Instagram shows how well content drives users to the client’s site. One key metric is click-through rate (CTR), which measures the percentage of users who click links in posts, Stories, or the bio.
A high CTR suggests the content is capturing attention and driving meaningful action. For instance, this may include exploring a product page, joining a mailing list, or completing a purchase. These insights help agencies refine messaging, optimize link placement, and improve conversion paths.
To get the full picture, use tools like Google Analytics to measure website traffic from Instagram and other social media channels. This helps your agency connect social engagement to on-site behavior and attribute conversions more accurately.
When reviewing this data across multiple channels, you’ll often spot patterns that help you reverse engineer the content or messaging that drives stronger on-site behavior. Pairing these insights with performance from Instagram ads gives clients a more complete picture of their funnel.
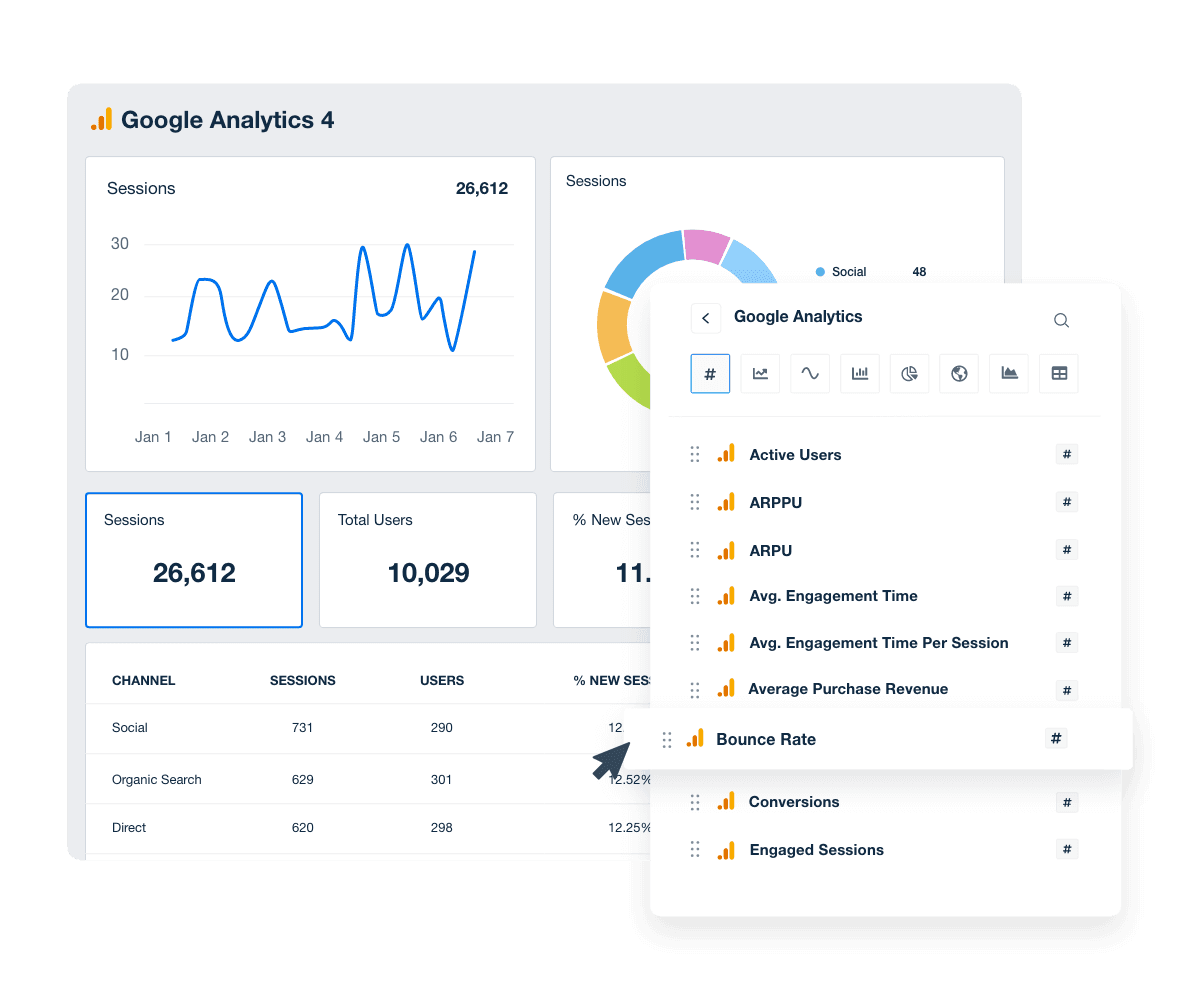
Get more advanced capabilities than a free Instagram analytics tool. Share web traffic insights across multiple social media platforms and give clients a more holistic view of performance. Try AgencyAnalytics today–it’s free for 14 days.
9. Conversion rate
Conversion rate measures the percentage of Instagram users who take a desired action after interacting with a post or ad (e.g., making a purchase or signing up for a newsletter). Similar to tracking website traffic, tools like Google Analytics reveal which Instagram posts or campaigns actually lead to conversions. This gives agencies clear insight into which formats and messages drive tangible results.
10. Return on investment (ROI)
Return on investment (ROI) reflects the profitability of your client’s Instagram marketing efforts. It’s calculated by comparing generated revenue to the cost of advertising or content creation. Showing the total number of conversions attributed to Instagram also makes it easier for clients to understand how social efforts support larger initiatives designed to grow sales. Understanding this metric helps identify which campaigns drive meaningful results and where to scale back. That way, resources are directed toward efforts that actually contribute to the client’s bottom line.
We decided early that the only metric that matters to us is client revenue. Social media agencies often focus on impressions, clicks, engagement, and visibility. However, we found that those numbers are just preliminary data points. They aren't the ones that matter, and you can't run a business based on impressions. You have to have revenue. Michael Gasser, Co-owner, Squeeze Marketing
Bonus: Tactical posting insights
Beyond core metrics, there are more granular factors that also affect content performance. These subtle details often determine whether a post drives engagement or gets buried in the feed.
These insights are especially useful when determining the best posting cadence, tracking optimal posting times, and understanding how content performs across different date ranges. To boost Instagram content reach, it’s a good idea to consider:
Active Times & Posting Frequency: Identify when a client’s audience is most active on Instagram (e.g., weekday mornings vs. weekend evenings). Then, schedule posts around those prime times and decide on an ideal posting cadence.
Top-Performing Days: Analyze which days consistently yield higher engagement to guide weekly publishing patterns.
Hashtag Performance: Monitor which hashtags drive the most reach and engagement. This helps your team focus on high-performing tags and eliminate those with low impact.
Trending & Niche Hashtags: Stay updated on trending, industry-specific hashtags to boost relevance in ongoing social media campaigns.
Tracking these insights might seem like extra work. However, it supports smarter content planning, ensuring posts go live when they’re most likely to be seen and engaged with.
How to use analytics to improve your Instagram strategy
Measuring Instagram metrics is only part of the job. To drive real impact, agencies use these insights to guide decisions, understand audience behavior, and clearly communicate the value behind each campaign.
Here are a few best practices to keep in mind.
Set specific goals & KPIs
Choose targets that are measurable and tied to business outcomes (e.g., increase website traffic by 20%). This will provide direction and focus for your client’s Instagram marketing strategy. Tracking specific metrics ensures your strategy supports outcomes your clients actually care about—whether that’s reach, engagement, website activity, or sales.
When analyzing social media metrics, it’s important to prioritize them based on the KPIs that are important to your client. For example, a newly launched local restaurant may be looking for impressions and reach for awareness purposes. Always consider your clients’ goals and what’s needed to move the needle forward.
JC Polonia, Founder, Digitality Marketing
Analyze historical trends
Review past performance to spot patterns in engagement, reach, and follower behavior. For example, track how Reels perform month-over-month or how engagement shifts after the launch of influencer marketing campaigns. That way, it’s easier to identify what’s gaining traction, flag underperforming tactics, and make informed adjustments.
Reviewing historical data across a consistent date range helps your team identify patterns in performance and gives clients a clearer view of long-term progress.
Cut out unnecessary fluff
Focus on the metrics that align with each client’s specific goals, whether it’s engagement rate, follower growth, or conversion performance. This keeps reporting relevant and avoids the trap of vanity metrics.
Vanity metrics are those stats that you like to show off to make the efforts you're making look good for you, but in the end, really don't mean anything, especially towards the end business goals you really want to achieve.
Nathan Hawkes, President, Arcane Marketing
Benchmark performance
Use industry benchmarks to give clients a broader context for their results. This will show how their metrics stack up against similar brands and where there’s room for improvement. Benchmarks also help frame results from Instagram Insights in a way that’s easier for clients to understand, especially when comparing their engagement or reach to similar brands.
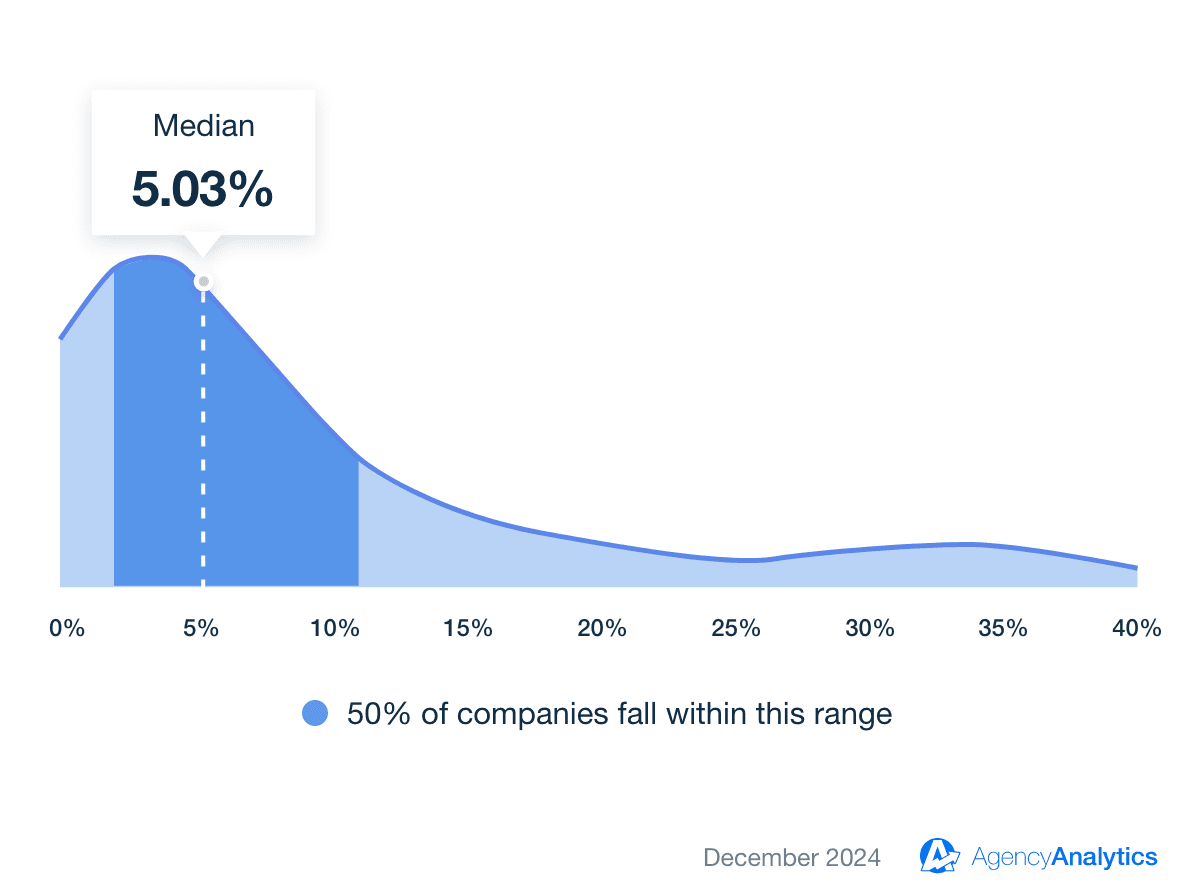
Share competitor analysis insights and valuable macro context for Instagram benchmarks. Access first-party benchmarks sourced from 150,000+ campaigns on the AgencyAnalytics platform–try it free for 14 days.
Using these approaches makes it easier to translate raw Instagram analytics into a strategy your clients trust—and keeps your reporting focused on meaningful results across all channels.
How to create Instagram analytics reports with AgencyAnalytics
Instagram’s built-in analytics focus on in-app metrics like reach, impressions, and follower growth. Many third-party Instagram analytics tools also stop there, offering limited context and no clear link to broader marketing performance. That gap makes it harder to compare channels, understand attribution, or tell a complete story of what’s driving results.
AgencyAnalytics eliminates that gap. It goes beyond the limits of a basic social media analytics tool, combining Instagram data with insights from Google Analytics, ecommerce platforms, email tools, and more. Instead of switching between dashboards or spreadsheets, your team gets one centralized view. This makes it much easier to report on Instagram performance as part of a cohesive, cross-channel marketing strategy. This unified view also simplifies the process of building a custom dashboard for each client, keeping their key Instagram analytics, website metrics, and ad performance in one place.
Many times, our clients were tired of clicking into 13 different dashboards to gather data from each platform. With AgencyAnalytics, all of the data is in one place, which has proved to be very beneficial for both us and our clients. Christopher Marrano, Founder & CEO, Blue Water Marketing
Wondering how it all works? Here are a few ways to use our platform and deliver high-impact reporting.
Step | Description |
|---|---|
Connect Data Sources | Pull in data from over 80 integrations, including Instagram, Facebook analytics, TikTok, LinkedIn, Google Analytics, Shopify, and more. Centralize social, web, ecommerce, email, and CRM performance in a centralized dashboard. |
Set Up a Custom Analytics Dashboard
| Create tailored dashboards using drag-and-drop widgets, white label branding, and data visualizations. Give each client a dashboard that reflects their goals and highlights the metrics that matter most. |
Automate Client Reporting | Smart reporting features such as 11-second Smart reporting, pre-built templates, and AI-generated insights make client reporting a breeze. Dashboards also update automatically, which ensures you’re able to track real-time performance without excessive manual work. |
Control Data Access | Set granular user permissions and give clients secure logins to view only the data relevant to them. This provides on-demand access to campaign performance and reduces back-and-forth communication. |
By automating the reporting process, your agency saves time, delivers clearer insights faster, and shows clients the full impact of their Instagram efforts—without extra work behind the scenes.
This reporting process also standardizes how your Instagram analytics reports look, ensuring that every client sees consistent data and understands how their Instagram performance fits into the bigger picture.
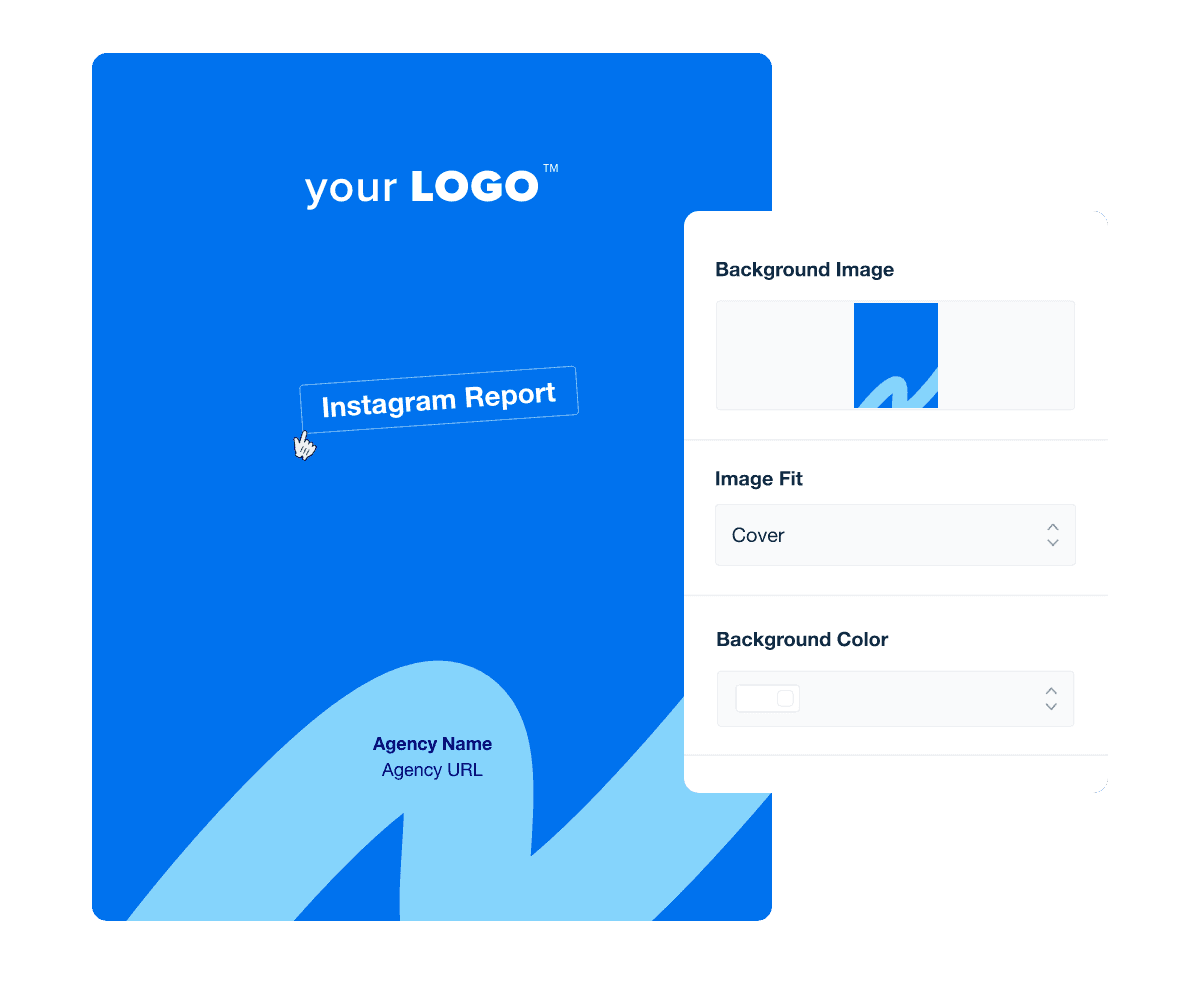
Take Instagram management to the next level. Use white labeling to create professional, branded reports that present your clients’ most important Instagram analytics clearly and confidently. Try the full range of features in AgencyAnalytics, free for 14 days.
Instagram analytics summary and key takeaways
As we’ve covered, there’s no shortage of Instagram data. The real value comes from translating those insights into clear takeaways your clients will understand and act on.
To recap, remember to:
Review Your Current Process: Confirm that the Instagram analytics you track align with each client’s goals. Check whether Instagram data is viewed alone or as part of a broader, multi-channel strategy.
Tailor Reports To Each Client: Highlight what matters most, such as engagement trends, conversion metrics, or audience growth. Keep the insights actionable and avoid unnecessary clutter.
Automate Reporting Delivery: Save time with scheduled reports and live dashboards. Automation ensures clients always have access to current data, without constant follow-ups.
Use A Client Reporting Tool: Invest in a platform like AgencyAnalytics to automate data retrieval. View social media insights, ad analytics, email metrics, and other key data in a visual, intuitive user interface.
Even the best standalone Instagram analytics tool has limits when results span multiple channels. Whether you’re tracking platform-specific performance or connecting social metrics to revenue, AgencyAnalytics brings everything together in one place and helps you present insights with confidence. Whether you’re tracking platform-specific performance or tying social metrics to broader ROI, AgencyAnalytics brings everything together in one platform.
Ready to turn raw Instagram analytics data into meaningful takeaways? Start your free 14-day trial today.
Impress clients and save hours with custom, automated reporting.
Join 7,000+ agencies that create reports in under 30 minutes per client using AgencyAnalytics. Get started for free. No credit card required.
FAQs that help you make sense of Instagram analytics
Everything you need to interpret key metrics, explain results to clients, and improve your reporting workflow.
To view analytics inside the app, switch to an Instagram business account or creator account. Then tap Professional dashboard or Insights to see reach, impressions, engagement rate, audience demographics, and content performance. These in-app metrics give a quick snapshot, but agencies often supplement them with tools that offer historical data, custom date ranges, and deeper account insights.
The best tool depends on how much context your agency needs. Native Instagram Insights works for basic reporting, but agencies typically choose platforms that combine Instagram data with website activity, ads, email, and other channels. A unified analytics tool like AgencyAnalytics provides deeper visibility, automated reporting features, and the ability to create a custom dashboard for each client.
In some way, yes. ChatGPT can be used to help you interpret the data you export or summarize, but it doesn’t connect directly to Instagram’s API. Many agencies use AI to clarify trends, identify top-performing content, or simplify complex insights before adding them to a client report.
For live metrics and accurate performance tracking, rely on dedicated Instagram analytics tools. And when you want AI support that works inside your reporting workflow, AgencyAnalytics offers built-in AI reporting features that turn your clients’ Instagram data into clear, ready-to-share insights automatically.
Manually gathering screenshots and metrics may take hours—which can become very time-consuming, especially when you're managing multiple clients.
With automated reporting tools, agencies create an Instagram analytics report in minutes. Prebuilt templates, drag-and-drop widgets, and scheduled delivery help keep your team focused on strategy instead of data collection.
Use a reporting platform with white-label reporting capabilities. Upload your logo, brand colors, and custom layouts to present a polished, professional report that aligns with your agency’s identity. This also centralizes your clients’ Instagram analytics, website metrics, and ad performance in one branded experience.
To write a professional Instagram analytics report, focus on five essentials:
Define the client’s goals.
Highlight specific metrics tied to those goals.
Add context using historical data and comparison across date ranges.
Explain why certain posts performed well or fell short.
Provide clear next steps rooted in the data.
These steps turn raw analytics into a reporting narrative your clients instantly understand.
Use a custom Instagram analytics dashboard that consolidates all your client’s data—Instagram metrics, website traffic, conversions, and campaign activity. This view reduces switching between tools, simplifies engagement tracking, and helps your team spot opportunities early.
A free Instagram analytics tool offers basic visibility into reach, impressions, and engagement, but agencies usually need more context. When you’re managing multiple clients, advanced reporting features—like white labeling, longer data retention, approval workflows, and cross-channel insights—become essential for presenting results with confidence.
Instagram’s native View Insights feature gives a quick snapshot of performance, but agencies often need more detailed insights than what the platform alone provides.
Many teams start by comparing several tools, including free options and third-party platforms like Sprout Social or Hootsuite, but these still have limits—especially when clients want cross-channel context or reporting tied to business goals.
While Instagram offers useful baseline metrics, upgrading to a platform with flexible dashboards and automated reporting helps agencies deliver a clearer story of what’s working and why.

Written by
Kyra Evans is the Manager of Content Marketing at AgencyAnalytics. She has over 15 years of experience writing content for SaaS, tech, and finance brands. Her work has been featured by HuffPost and CBC, and she serves an engaged social media readership of over 30,000 community members.
Read more posts by Kyra EvansSee how 7,000+ marketing agencies help clients win
Free 14-day trial. No credit card required.


