Post Shares
Client Reports
Demonstrate how an audience responding to posts affects the client’s bottom line.
Optimizing Content Strategies
Leverage Post Shares to optimize content according to audience preferences.
Social Proof
Highlight Post Shares to showcase brand authority and build trust with potential clients.
Campaign Evaluation
Observe the impact of posts on a target audience beyond likes and comments.
Why Tracking Post Shares Is Important
On social media, engagement activities generally indicate interest. Tracking Post Shares provides a window into the mind of a target audience, offering insights into what they love to see on the feed and what isn’t resonating. When posts record high engagement and shares, social media algorithms view them as useful and will further amplify the visibility of the post to a larger audience.
Tracking Post Shares is a fundamental method for understanding audience behaviors. By studying an audience's preferences, demographics, and purchasing decisions, brands know how to strategically create content that will lead to increased audience engagement.
Finally, Post Shares aid in social listening. Analyzing posts with high engagement and shares helps to identify audience pain points and language of expression.

Stop Wasting Time on Manual Reports... Get Insights Faster With AgencyAnalytics
How Post Shares Relate To Other KPIs
Post Shares are part of a larger community of KPIs, such as Conversion Rates, Reach, and Brand Awareness, that collectively provide a comprehensive view of campaign effectiveness and performance.
Post Shares directly impact reach and engagement rates. The more people from a target audience share a certain post, the greater the chances of reaching and engaging interested consumers. Thus, reach is increased without additional costs associated with boosting the ad.
This metric might not have a direct effect on Conversion Rates, but it acts as a catalyst and gives a post a fair chance at reaching a wider audience who might be looking to make a purchase or sign up for a free trial immediately.
Context Is Vital for Post Shares
Post Shares do not always mean that an audience resonates deeply with a post. Sometimes, it’s quite the opposite. An audience may share a post that they disagree with and consider controversial while stating reasons for their opposing views.
While this will bring attention to a brand, it might position them in a negative light and achieve the opposite of what they aimed for; hence, brands are advised to stay away from controversial content and marketing campaigns with a controversial base.
The only way to assess how what you are saying is perceived is by studying the reactions. Whether someone clicks, shares, and/or replies are the “facial expressions” and “words” that a person shares back that can tell you how well your conversation is going.
How To Track Post Shares
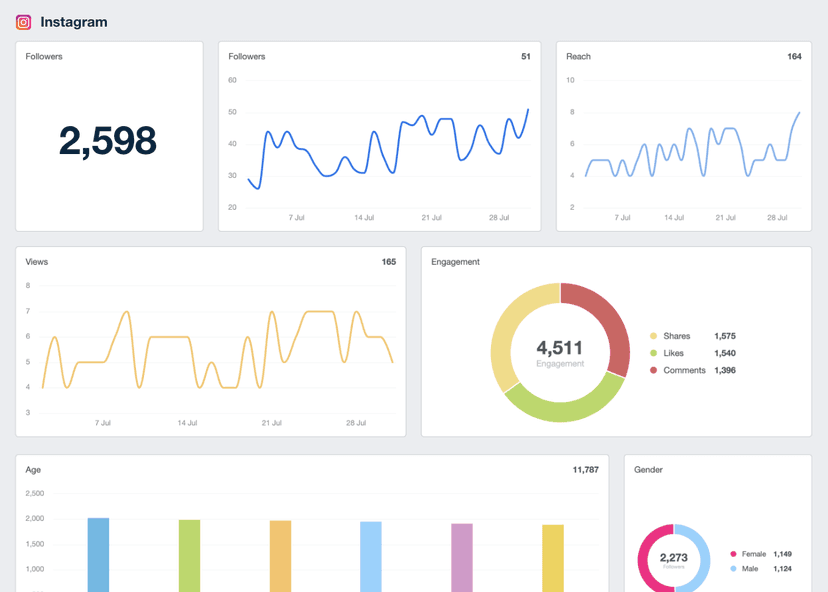
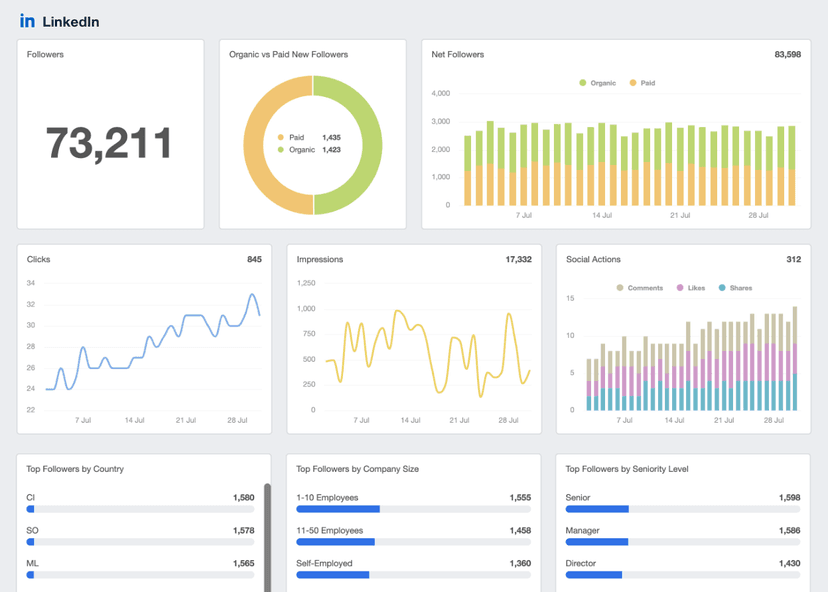
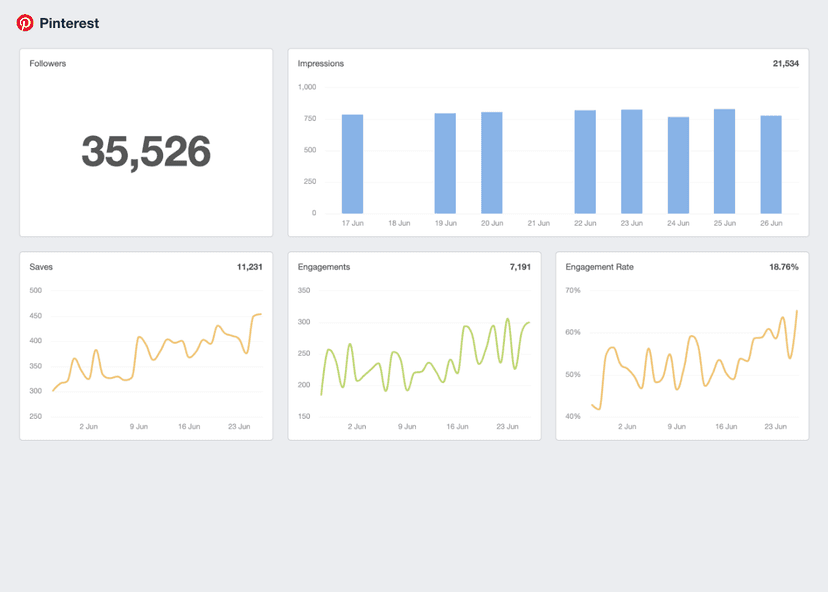
To monitor Post Shares, check the number of times a post has been shared by unique users on a social media platform. Using a client reporting tool like AgencyAnalytics displays social media analytics from multiple platforms, making it easy to compare Post Shares alongside other related metrics.
How To Set Post Sharing Benchmarks and Goals
Establishing a dedicated benchmark on Post Shares may be difficult because of differences in industries, audience segments, brands, and campaign goals. However, a healthy amount of shares often shows that the brand messaging resonates with the target audience.
To set realistic goals, analyze industry benchmarks, internal historical data, industry historical data, and business objectives. Be sure to focus on long-term business objectives, as this will avoid undue pressure and give room for measurable growth.
Why Post Shares Matter to Clients
For clients, Post Shares indicate that campaign efforts are effective beyond graphs, tables, and reports. It signifies increased visibility and brand exposure. When an audience shares a post, it means they’re not just engaging actively—they’re helping to foster brand recognition in their own community.
Also, Post Shares provide social proof for clients, which strengthens the overall perception of a client’s brand, showcasing credibility, expertise, and authority in the industry. Clients understand that attention is the new currency and will do their best to have it. Post Shares are an excellent way to increase the number of people exposed to a client’s brand messaging.

Why Post Shares Matter to Agencies
Agencies are always looking to iterate, experiment, and replicate results. When a post records an impressive amount of shares, agencies often want to know why; hence, they begin a thorough analysis to discover what they did differently and how to keep things in their favor, either by optimizing content or perfecting targeting strategies.
Post Shares are the symbol that validates an agency’s efficiency and campaign effectiveness. For agencies, Post Shares go beyond mere numbers; They show an agency’s ability to create compelling thought-leadership content reflecting expertise in audience engagement and fostering connections.

Report smarter for your clients with just a click.
Best Practices When Analyzing and Reporting on Post Shares
Figures, statistics, and data from advertising campaigns only move the needle when they’re carefully reported and duly analyzed. Here’s how to use Post Share analytics to guide decision-making and enable stakeholders to allocate resources accordingly.
Analyze Over Time
Weekly, monthly, and yearly analysis of Post Shares makes it easy to spot trends and patterns.
Compare Across Channels
Contrasting results between social media platforms will reveal which audiences are most receptive.
Measure by Campaign
Compare Post Shares across campaigns to understand the most effective strategies and messaging.
Put in Context
The effects of Post Shares are more evident when they're reported in relation to other KPIs like Conversion Rates and Engagement Rates.
Align to Client Goals
Show clients how exactly a change in Post Shares brings them closer or farther from their specific goals.
Visualize Performance
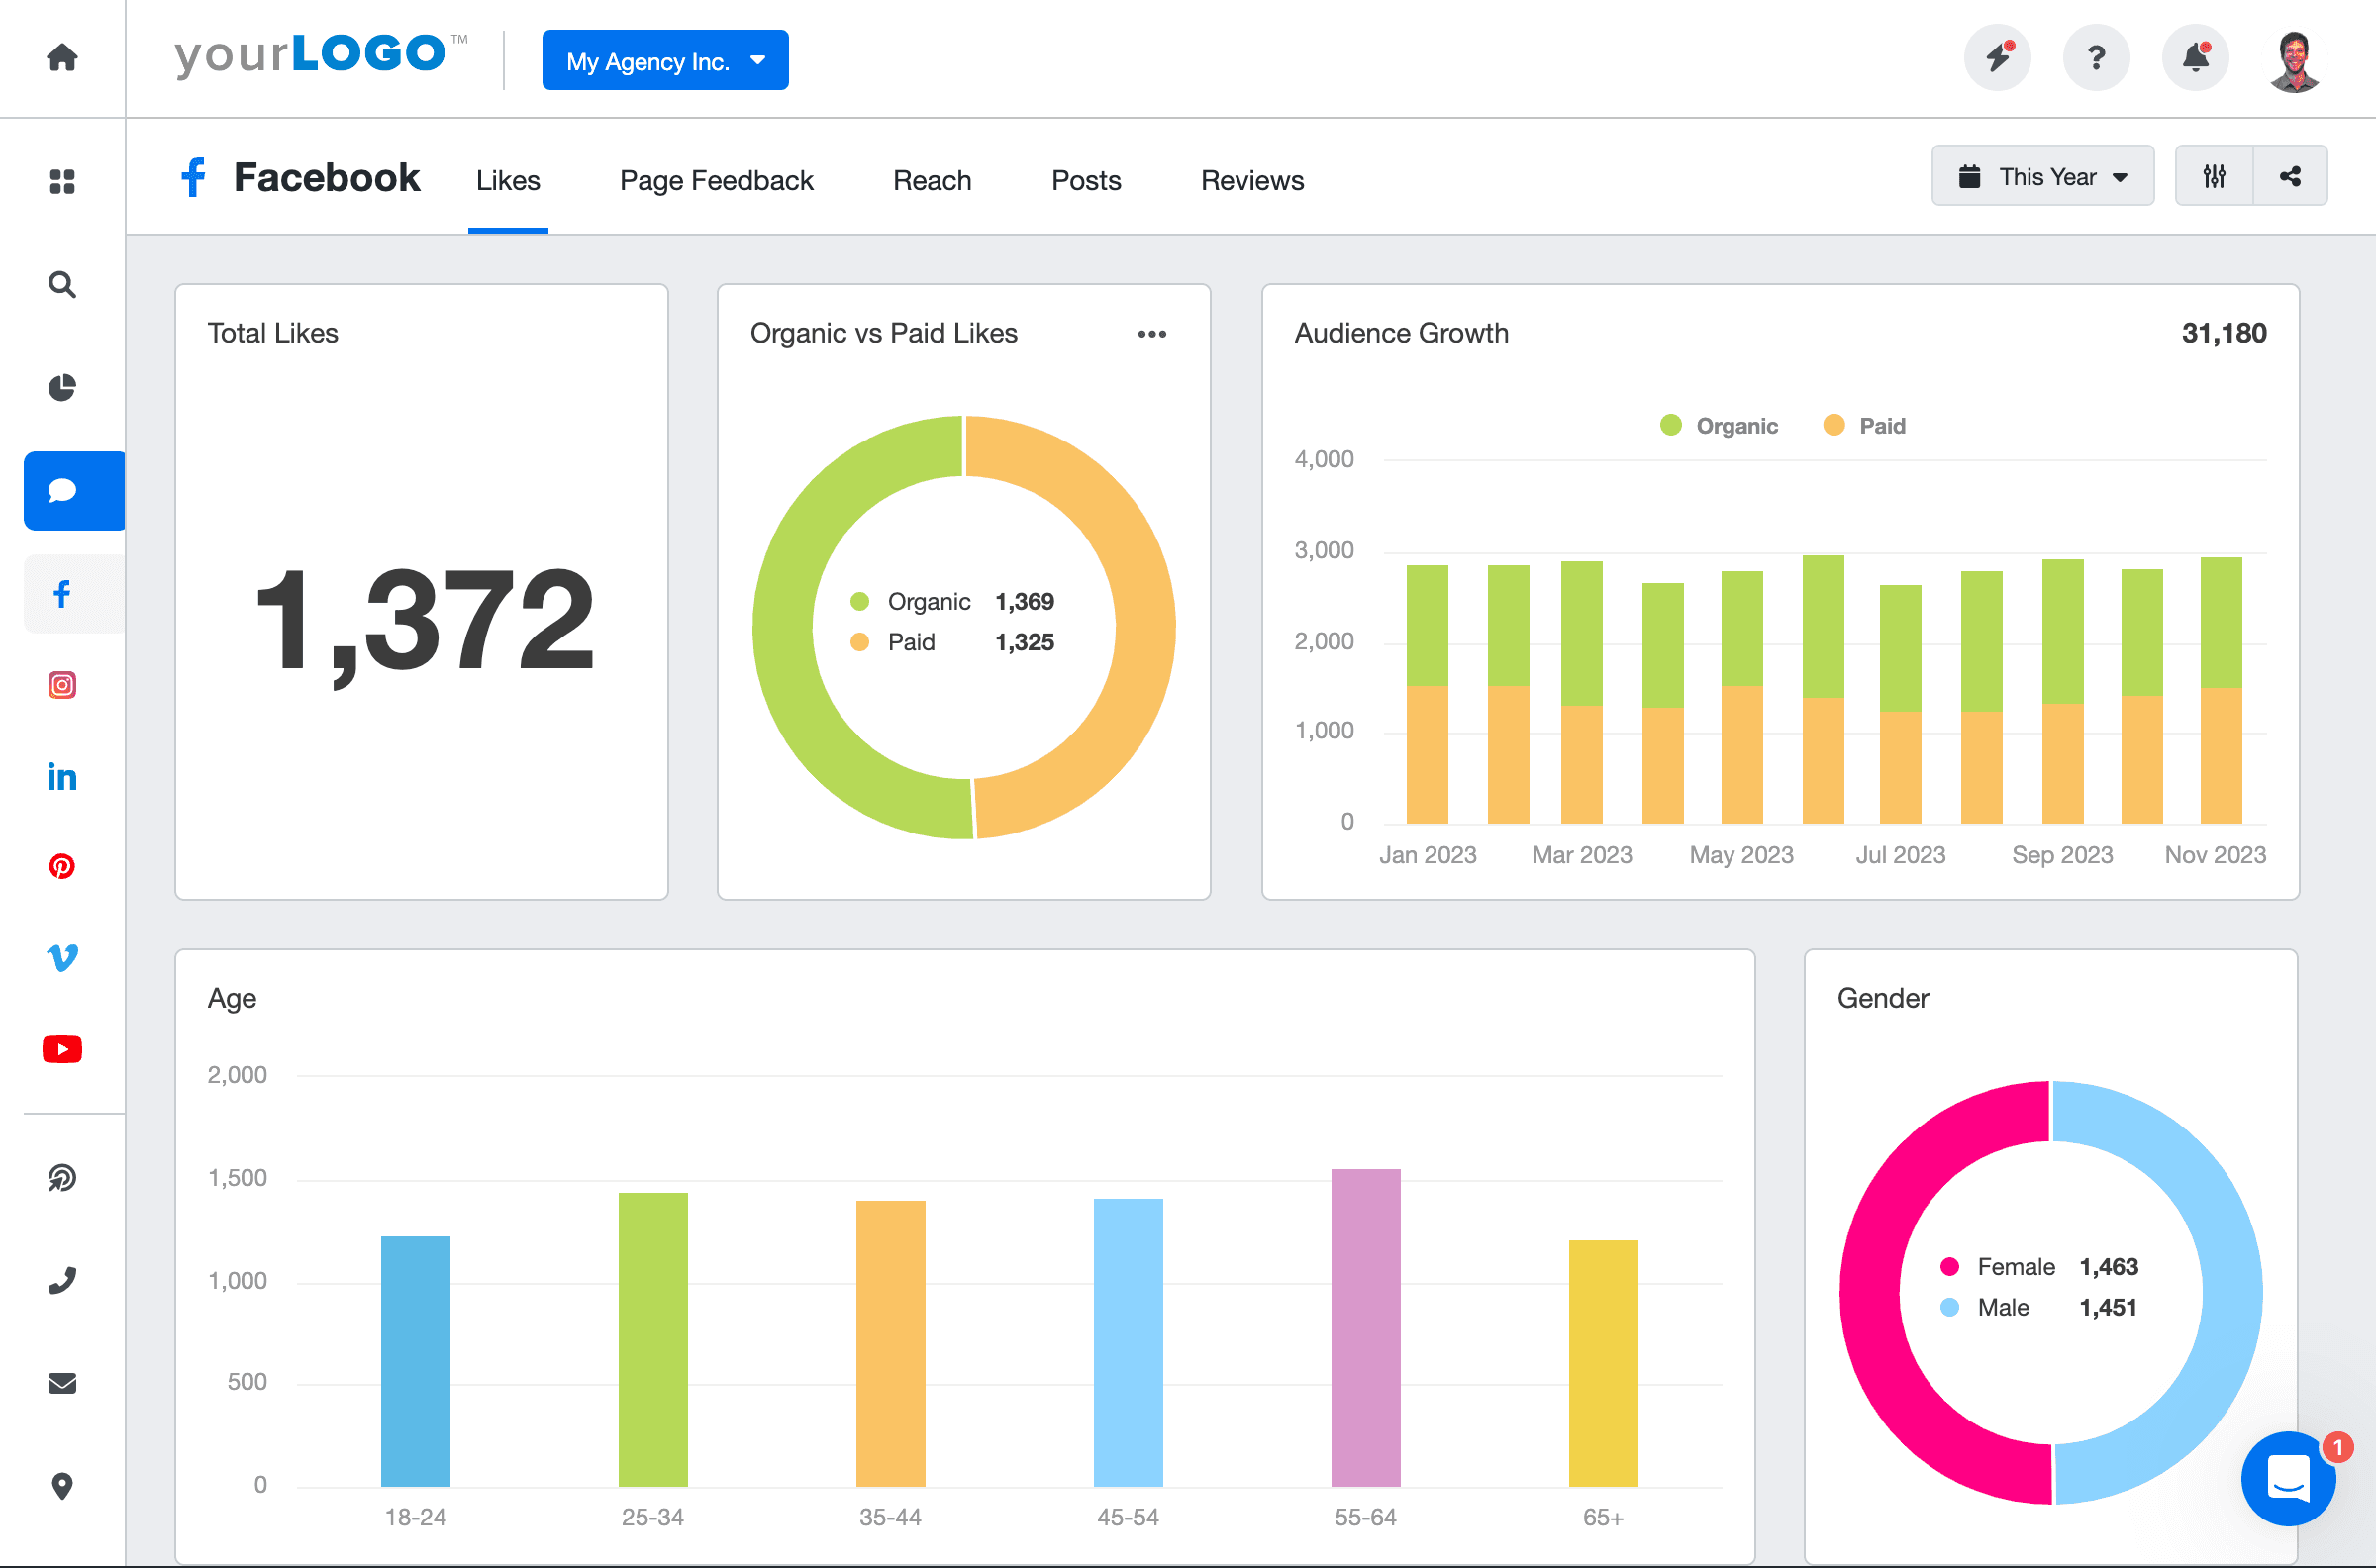
Visualizing Post Shares using graphs, charts, and tables makes data actionable, digestible, and easier to spot trends.
Facebook Dashboard Example
How To Improve Post Shares
Follow these practical tips to improve Post Shares and strengthen social authority.
Optimize Content Quality
Whether a video or a photo carousel, high-quality content will capture attention better than low-quality content.
Improve Audience Targeting
Experiment with different audience segments to find the most responsive target demographic.
Include Clear CTAs
Encourage users to share by asking directly or prompting them with clear CTAs to provoke action.
Related Blog Posts
See how 7,000+ marketing agencies help clients win
Free 14-day trial. No credit card required.


