Table of Contents
QUICK SUMMARY:
Facebook Ads benchmarks provide valuable insights into campaign performance across key metrics like cost per click (CPC), click-through rate (CTR), and website conversion value. Understanding these benchmarks helps identify optimization opportunities, evaluate ad efficiency, and set realistic client expectations. Learn how to interpret Facebook Ads benchmarks to strengthen your value proposition and improve results.
Facebook advertising continues to be a go-to choice for clients. But to truly achieve success, your agency’s decisions must be rooted in data.
Unfortunately, just saying, “This was a good month!” isn’t enough–you need context to truly understand what “good” means when it comes to Facebook Ads.
That’s where Facebook Ads benchmarks come in. By exploring the industry averages for a variety of metrics, your agency gains an understanding of exactly where your clients’ performance stands in relation to their competitors. Simply put, benchmarks are essential for evaluating success, identifying growth opportunities, and fine-tuning campaigns for better outcomes.
This blog post dives into the most important Facebook Ads benchmarks and explains how they differ across sectors. By comparing your client’s performance to these industry standards, you’ll uncover actionable insights to enhance Facebook ad strategies and maximize ROI.
Even better? The benchmarks shared in this article reflect the median values from more than 150,000 reports pulled by our extensive network of 7,000+ agency customers—giving you a realistic view of the current results of agencies just like yours.
Here’s a quick peek at the benchmarks we’ll explore:
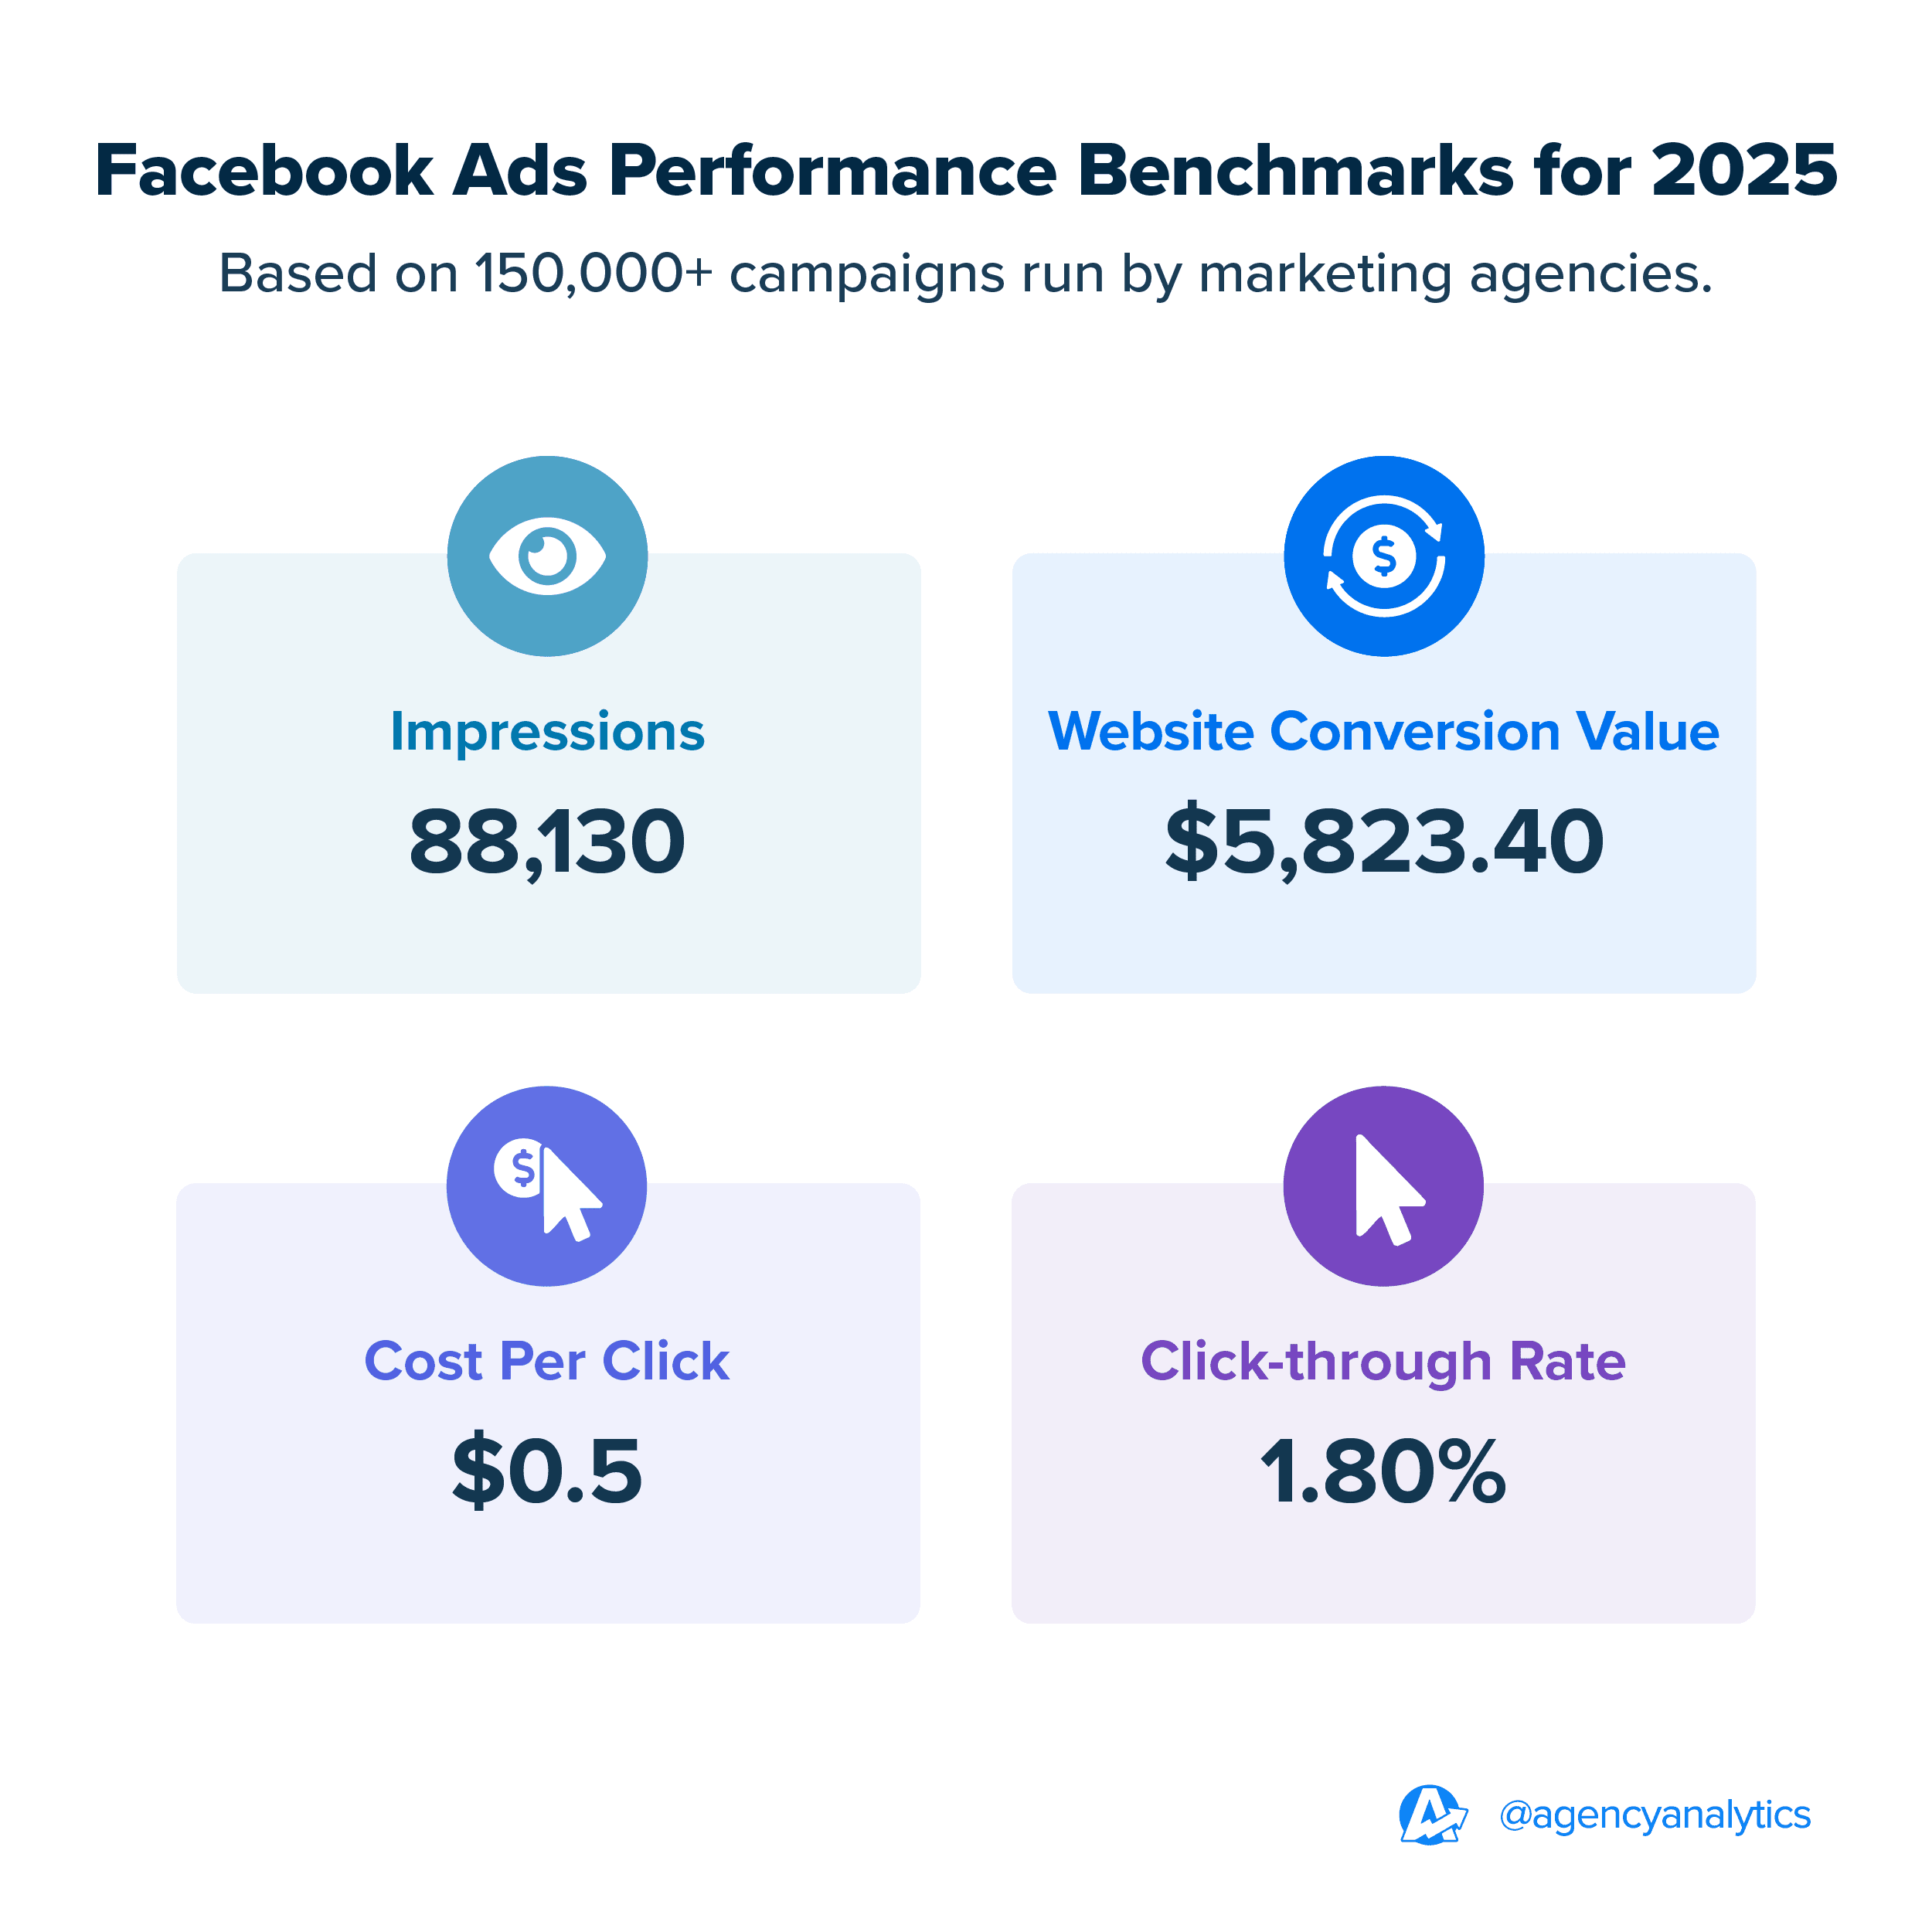
Stay tuned as we break down what the data tells us based on benchmarks from over 150,000 marketing campaigns. This way, you’ll be well aware of the Facebook Ads standards achieved by other agency professionals.
Why Facebook Ads Benchmarks Matter
Facebook Ads benchmarks provide a critical reference point for assessing campaign performance. By comparing metrics to industry standards, agencies are equipped to gauge success, optimize strategies, and build trust with clients.
Let’s explore the importance of Facebook Ads benchmarks through the lens of campaign evaluation, client satisfaction, and data-driven results.
Key Facebook Ads Benchmarks and Why They Matter
Facebook Ads benchmarks represent industry averages for metrics such as cost per click (CPC), click-through rate (CTR), and website conversion value. These metrics serve as performance baselines, helping agencies determine whether campaigns are underperforming, on track, or exceeding expectations.
By leveraging these benchmarks, agencies gain a clearer understanding of where campaigns stand relative to industry norms. For example, a high CPC in one industry might be standard, while the same figure in another might signal ad inefficiency.
Here’s a quick breakdown of these key metrics to keep in mind:
Average Cost Per Click (CPC): The amount paid for each click on an ad. A lower CPC indicates cost-efficient traffic, while a higher CPC may signal competition or valuable audience segments.
Average Click-through Rate (CTR): The percentage of people who click on an ad after seeing it. A higher CTR suggests that the ad is engaging and relevant to the audience.
Average Impressions: The total number of times an ad is displayed. Impressions measure reach and visibility but don’t indicate direct interaction.
Average Website Conversion Value: The average revenue generated per conversion on a website. This metric helps assess the financial impact of ad campaigns.
Tracking these metrics provides a clear picture of Facebook ad performance and opportunities for optimization.
Why Facebook Ads Benchmarks Keep Clients Happy
Meeting or exceeding industry benchmarks is a powerful way to satisfy client expectations.
After all, clients expect measurable results that align with their business goals–benchmarks provide a clear point of comparison to demonstrate progress. By regularly analyzing metrics against industry standards, agencies deliver transparent reporting that reassures clients their campaigns are on track.
Here are a few ways to use benchmarks during client conversations:
Highlight Campaigns That Outperform Benchmarks: For example, achieving a 3.5% click-through rate (CTR) in an industry where the average is 1.7% proves the ad is engaging and well-targeted, reinforcing the value of your services.
Benchmarks Help Contextualize Wins: A $10,000 website conversion value may be exceptional compared to the industry median of $5,500. It demonstrates the campaign’s ability to convert traffic into significant sales.
When clients see their campaigns surpassing industry benchmarks, it builds trust and confidence. Proactively addressing gaps also strengthens relationships, reduces churn, and positions your agency as a committed, results-driven partner.
How Facebook Ads Benchmarks Improve Campaigns
Benchmarks act as a guide for optimizing campaigns and achieving key objectives. Use these performance insights to:
Identify Underperforming Metrics To Adjust and Optimize: Say the cost per click (CPC) for a client in the Personal Services sector is higher than expected. Leverage this data to refine audience targeting or improve ad relevance.
Pinpoint Inefficiencies in the Conversion Funnel: If a retail campaign has a high number of impressions but a CTR that’s lower than industry standards, it may indicate an issue (e.g., with the landing page experience or offer).
Benchmarks provide the clarity needed to identify underperforming metrics and ensure strategic campaign improvements.
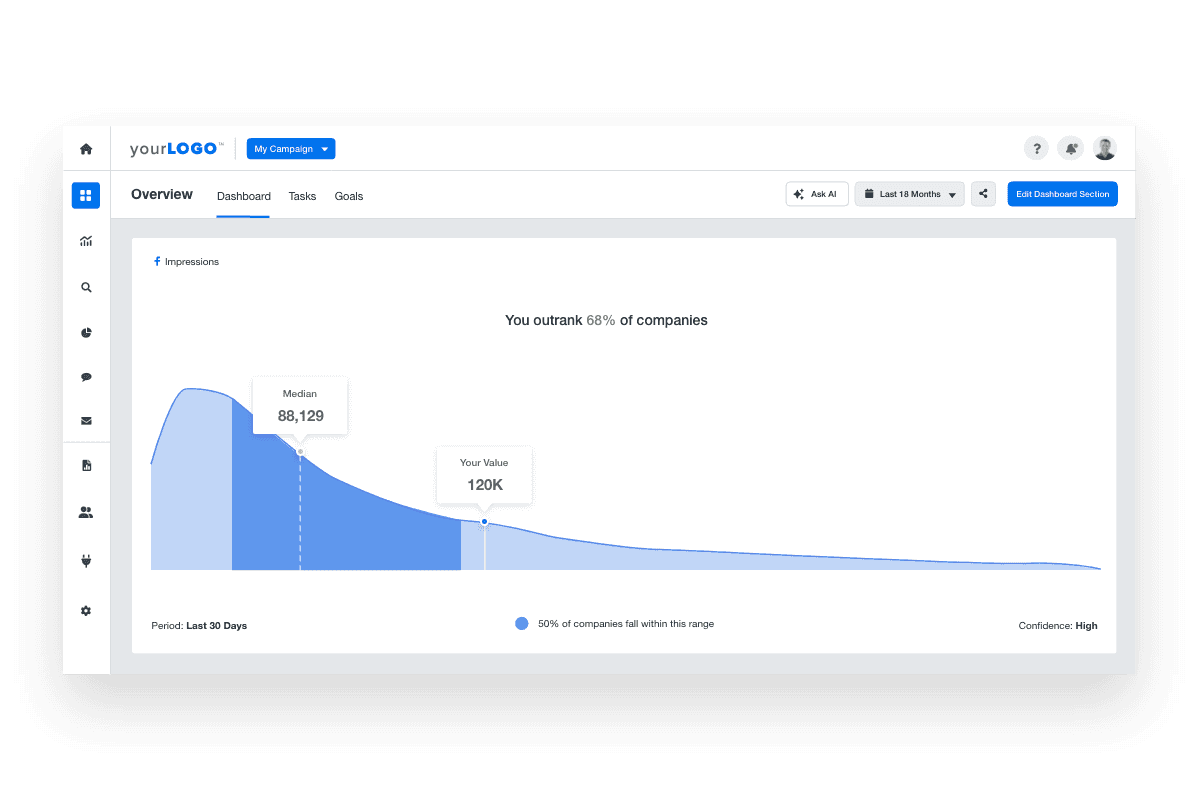
Access data-driven benchmarks and share reliable insights that matter–all without additional job training. Explore AgencyAnalytics, free for 14 days.
The Value of Industry Benchmarks
Industry benchmarks are more than a couple of numbers on paper. These performance insights provide a reliable frame of reference, allowing agencies to go a step further than surface-level results. Let’s explore their significance further.
What’s the Difference Between Average Vs. Median Values?
When talking about Facebook advertising benchmarks, it’s important to distinguish between average and median values. Here are specific definitions to know:
Average Values: These are calculated by adding up all data points and dividing by the total number of entries. That said, averages may be skewed by extreme outliers. For example, a few campaigns with unusually high advertising costs will inflate the average, making it less representative of typical performance.
Median Values: Conversely, median figures provide a more balanced view by avoiding distortion from outliers since they reflect the midpoint value in a dataset. This is especially important for benchmarks since a small number of extreme results will dramatically affect the average.
At AgencyAnalytics, we use median values in benchmark reporting because they better reflect realistic campaign performance. While averages are more familiar, they may mislead agencies into making decisions based on skewed data. Medians, on the other hand, provide a clearer and more accurate picture of industry norms.
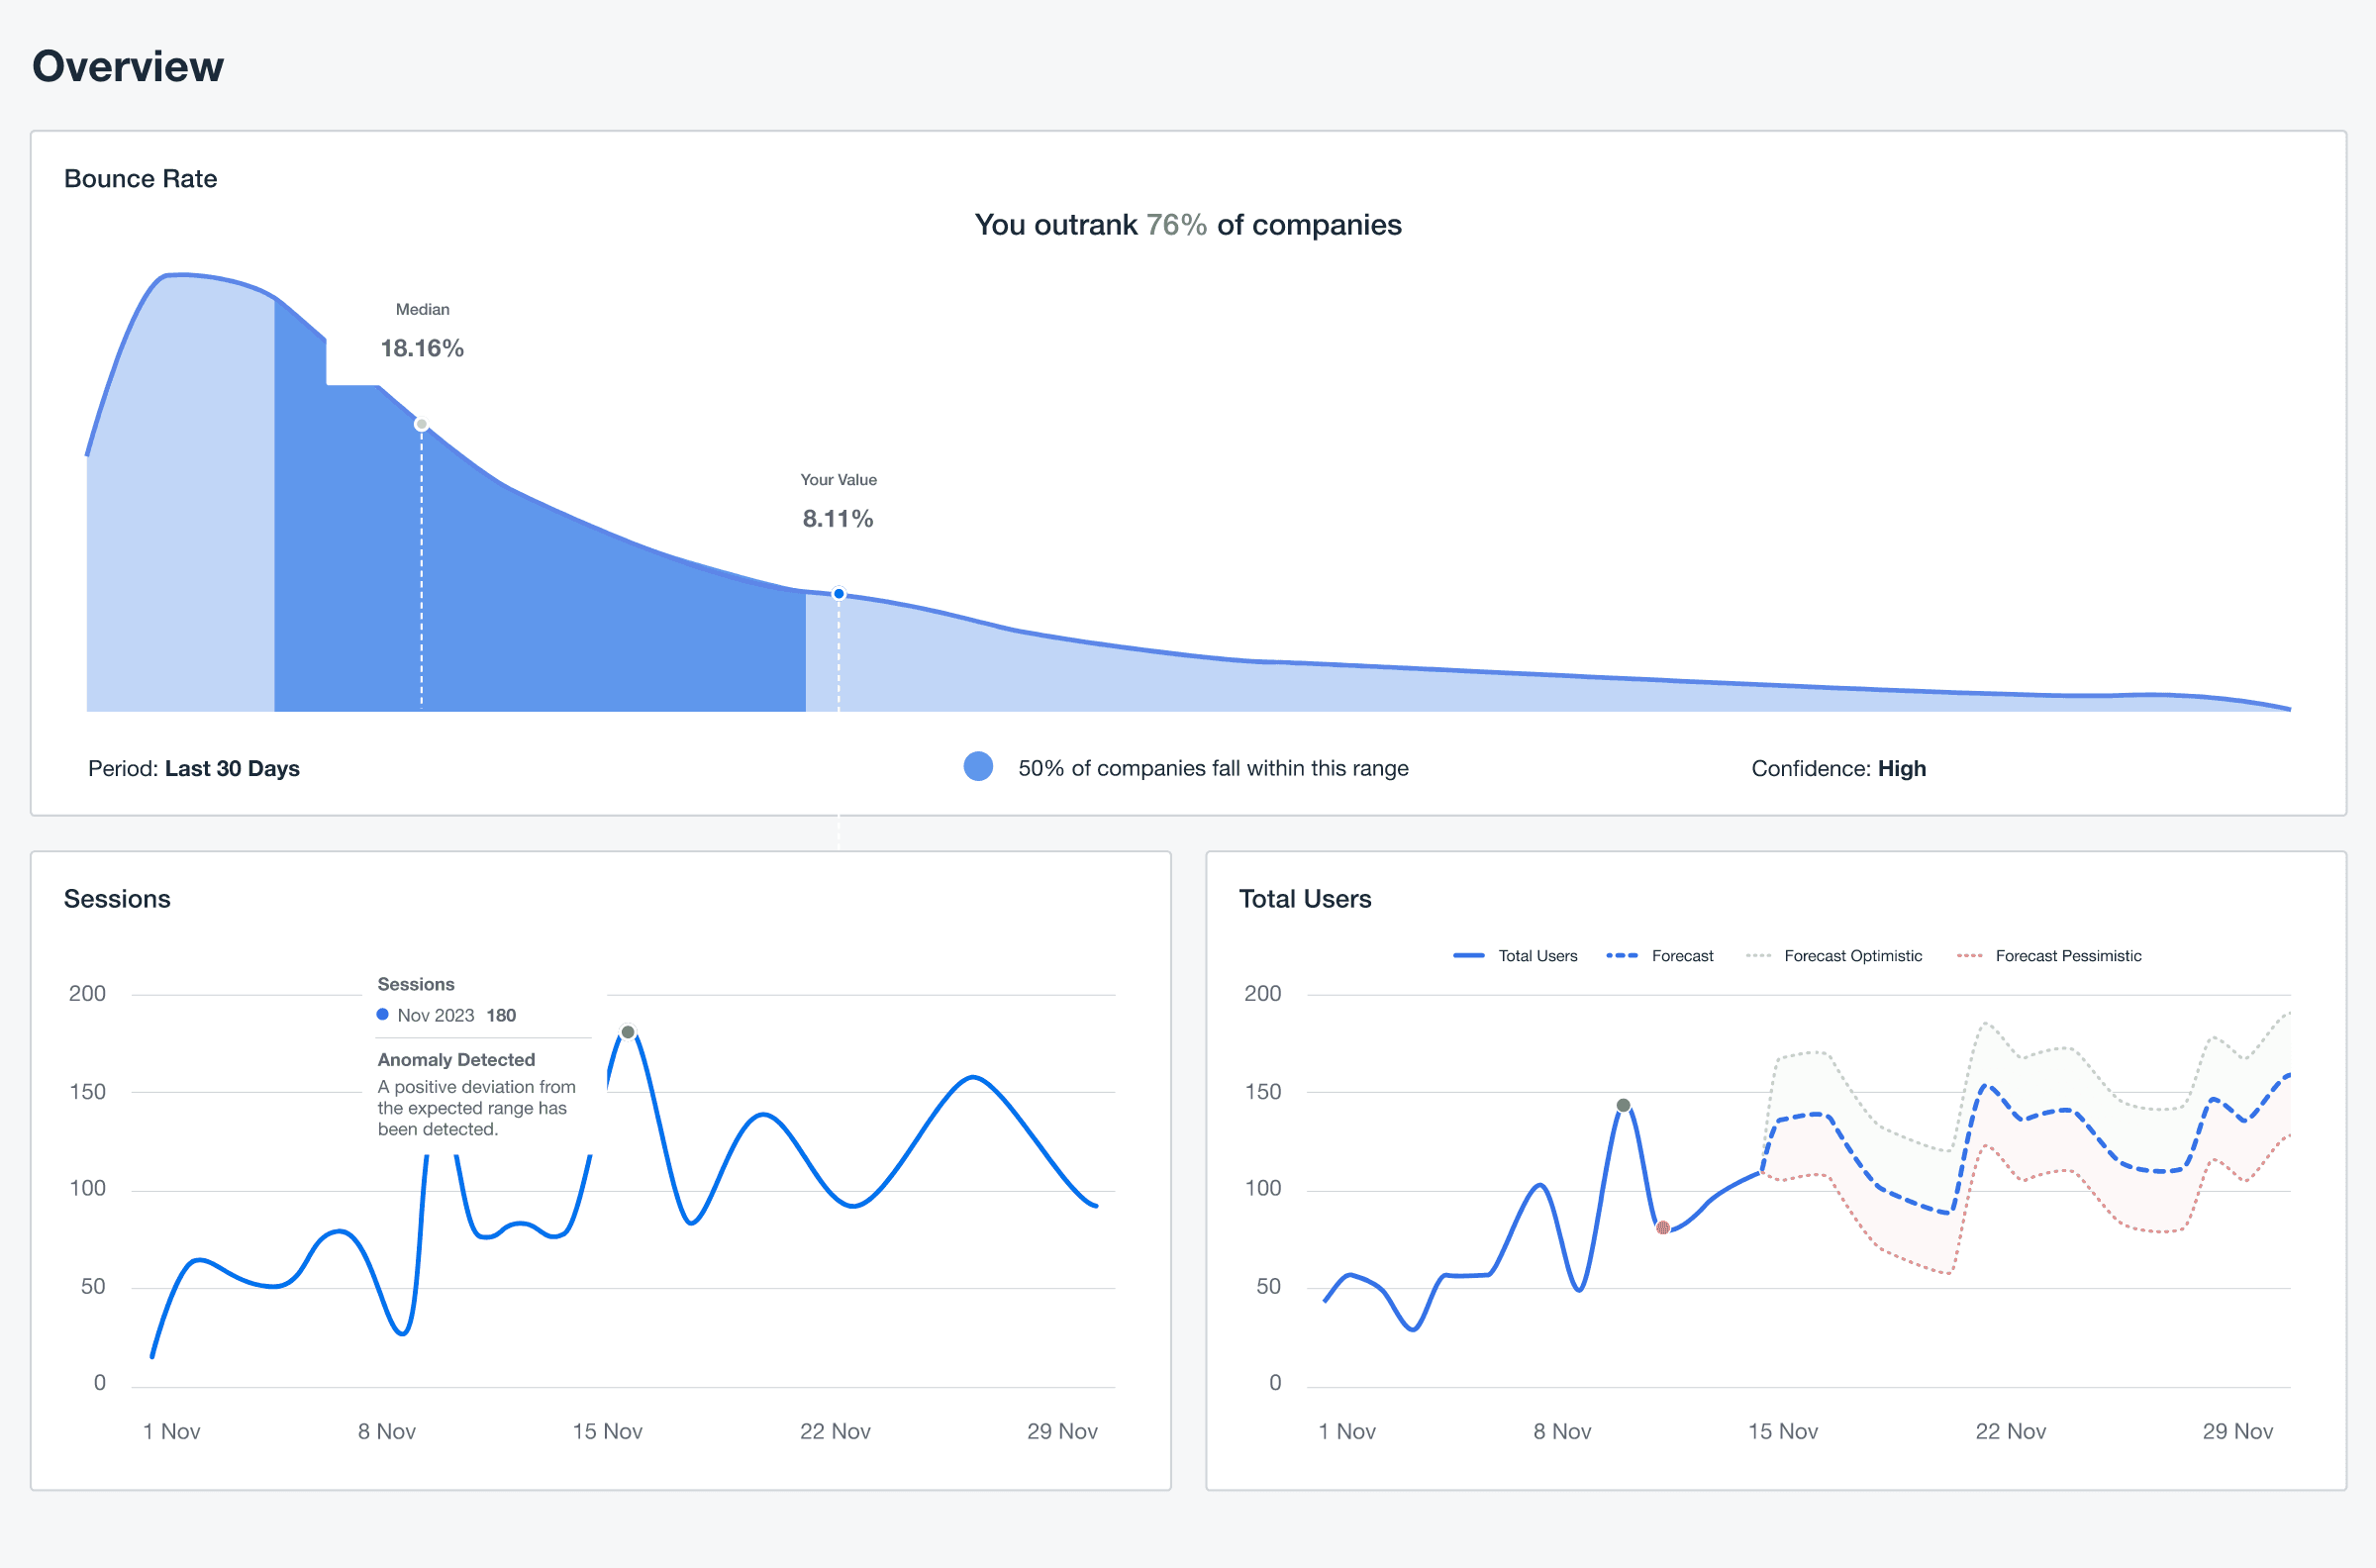
Use benchmarks to keep client campaigns on the right track. View median values across the Real Estate sector, retail businesses, and other industries–try AgencyAnalytics, free for 14 days.
Common Misconceptions About Facebook Ads Benchmarks
Industry benchmarks are often misunderstood–these are a few common (but incorrect) beliefs:
Benchmarks Are Static: Some assume benchmarks remain constant, but they actually fluctuate based on trends, seasons, and shifts in consumer behavior.
Meeting Benchmarks Equals Success: Hitting benchmark numbers doesn’t always mean a campaign is successful. To truly assess performance, agencies should also consider a client’s campaign objective, audience nuances, and competitive landscapes.
Benchmarks Apply Universally: Industries and platforms aren’t created equally. Benchmarks vary significantly across sectors–even within different campaign types.
Benchmarks are a valuable tool for guiding strategy, but they’re only one piece of the puzzle. By interpreting them thoughtfully, agencies are better positioned to deliver results that matter.
How Agencies Use Benchmarks To Improve Campaigns
As campaigns progress, benchmarks act as a performance checkpoint to keep goals on track.
For instance, if a restaurant client’s campaign achieves a CTR of 1.2% (falling below the industry median of 2.08%), it might indicate that the creative isn’t resonating. Adjusting visuals, ad quality, or the call-to-action could quickly turn engagement around.
Ensure your client’s goals align with industry standards. Whether it’s a Facebook ad CTR benchmark or another performance insight, this data is all at your fingertips. Check out AgencyAnalytics today with a free 14-day trial.
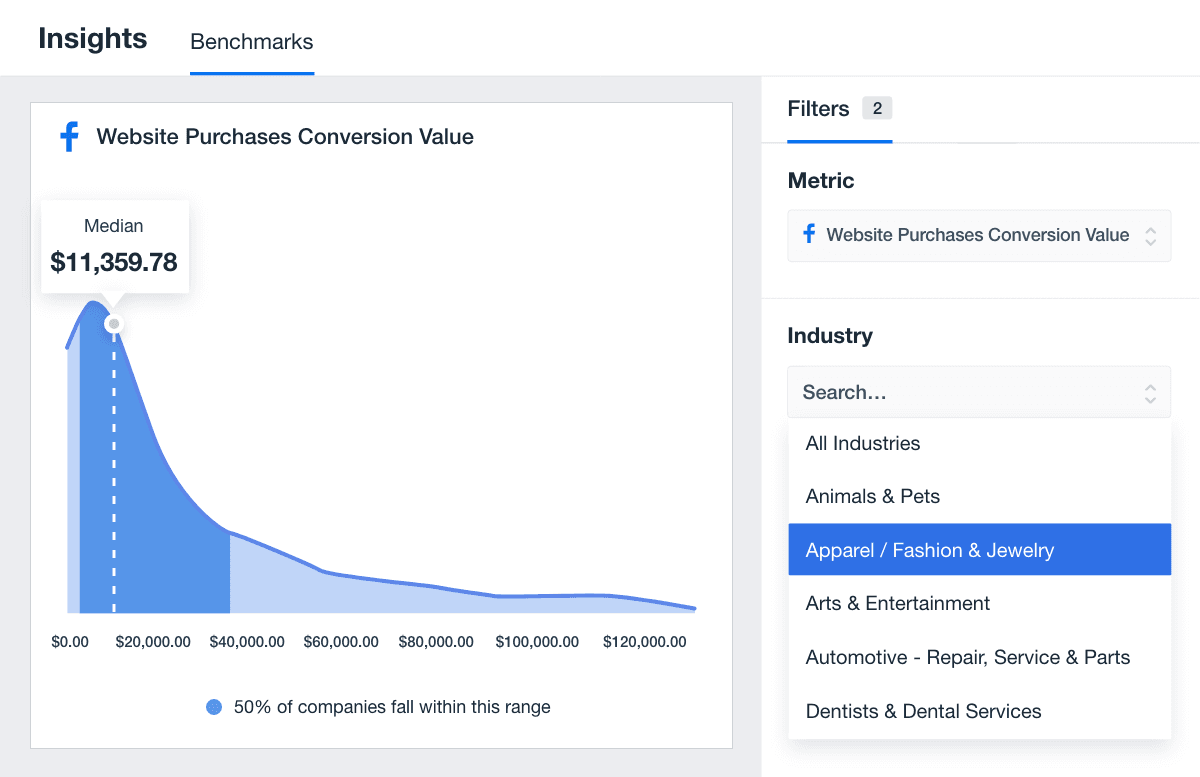
Benchmarks also highlight successes that deserve recognition. For example, say a campaign in the Apparel & Fashion sector is on track to surpass a website conversion value of $15,000 (compared to the business category avg of $11,359.78).
This proves that the strategy drives high-value enrollments and delivers measurable Facebook Ads ROI for the client.
Facebook Ads Benchmarks for 2025
Now that we have an understanding of the relevance and importance of industry-specific benchmarks, let’s explore key Facebook advertising benchmarks derived from 150,000 digital marketing campaigns on the AgencyAnalytics platform.
Average Facebook Ads Monthly Spend
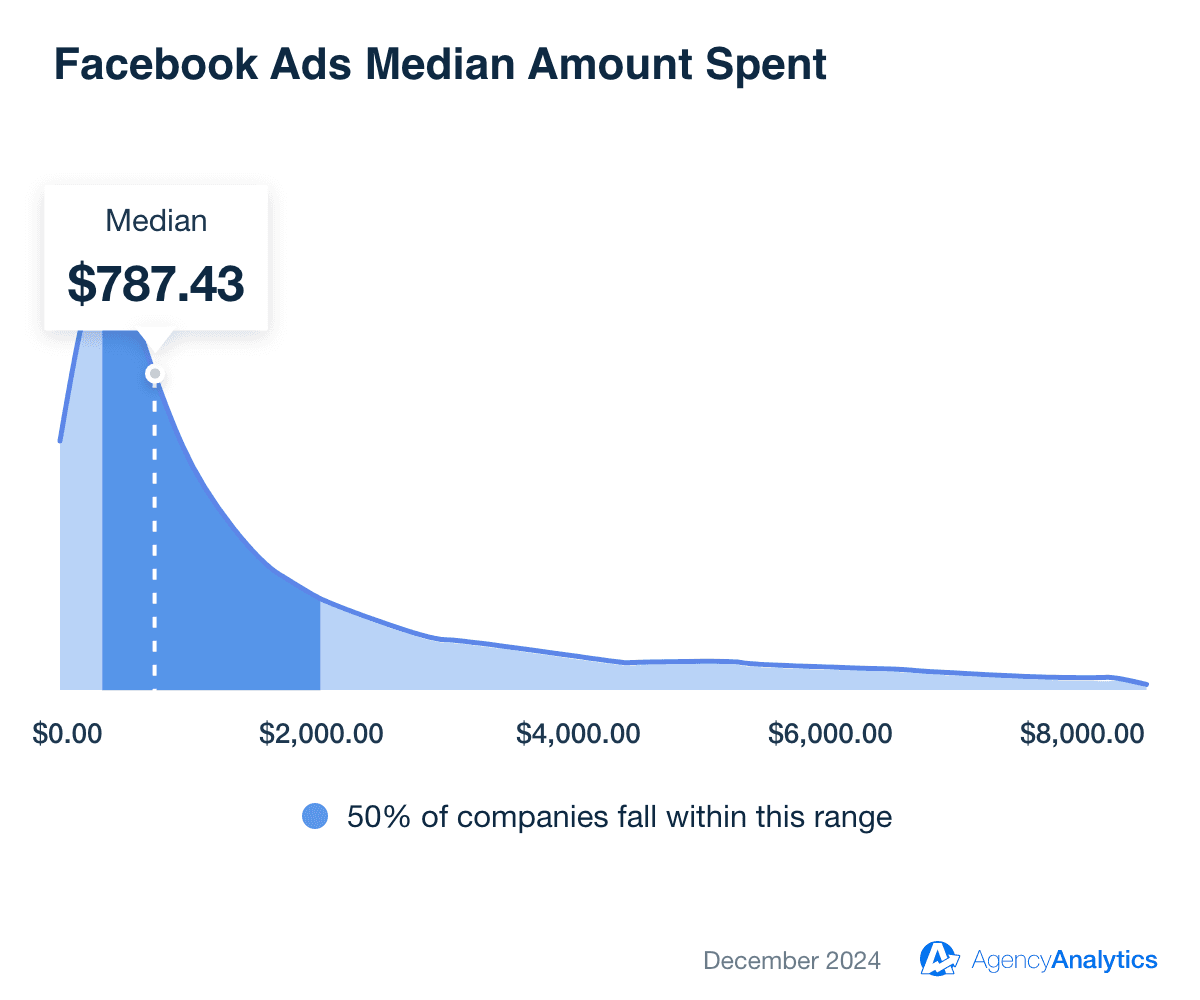
The typical monthly spend for Facebook Ads campaigns across all industries is $787.43.
While knowing this number is useful, agencies should consider variations across industries. Take the graph below. Some clients invest more than $8000 per month, which could be typical for larger campaigns and businesses. That said, only a small number of clients actually spend this amount, as seen from the dramatically skewed distribution spread.
On the other hand, 50% of client budgets sit at $787.43, with some variation between $500 and $2000. This means that most Facebook Ads campaigns are focused on more targeted budgets (typical of small to mid-sized businesses).
For example, the Agriculture & Farming industry has a median monthly spend of $2,618.63 (included in the table below). This elevated spend could be influenced by seasonal campaigns or the need to target geographically dispersed, niche audiences.
Industries such as Apparel & Fashion also show significant investment, with a median spend of $1,992.91.
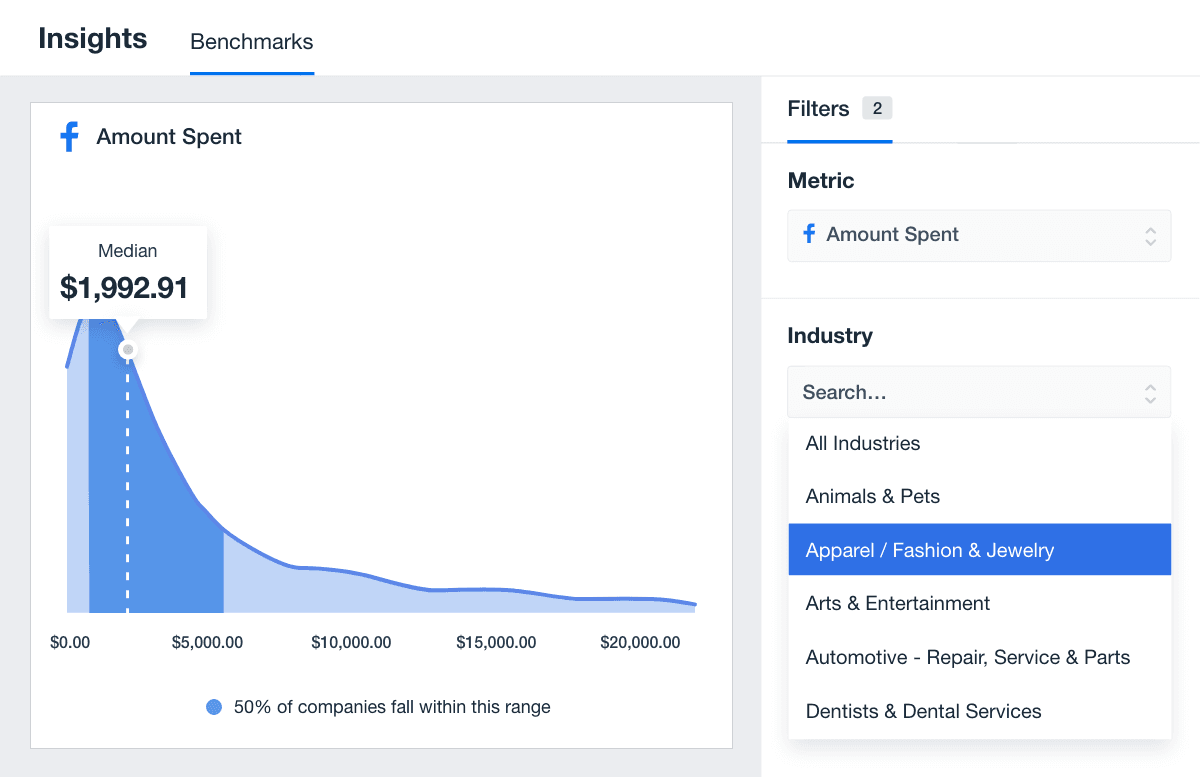
It makes sense, too. This sector relies heavily on visual content to maintain brand visibility and drive conversions.
Average Facebook Ads Monthly Spend by Industry
Industry | Median Facebook Ads Spend by Industry |
|---|---|
Advertising & Marketing | $565.63 |
Agriculture & Farming | $2,900.16 |
Animals & Pets | $742.43 |
Apparel & Fashion | $1,992.91 |
Arts & Entertainment | $886.60 |
Attorneys & Legal Services | $640.59 |
Automotive Parts & Services | $497.31 |
Beauty & Personal Care | $1,252.38 |
Business Services | $782.04 |
Career & Employment | $983.67 |
Dental Services | $507.96 |
Education | $860.62 |
Environment & Sustainability | $787.42 |
Event & Entertainment | $889.69 |
Finance & Insurance | $841.55 |
Food & Beverage | $1,181.59 |
Furniture | $1,447.82 |
Health & Fitness | $913.85 |
Home Improvement | $800.54 |
HVAC Repair | $582.75 |
Industrial & Commercial | $549.61 |
Landscaping | $341.66 |
Manufacturing & Industrial | $370.38 |
Non Profit | $957.90 |
Plumbing | $479.60 |
Real Estate | $502.68 |
Restaurants | $591.74 |
Roofing | $879.54 |
Sports & Recreation | $1,041.73 |
Travel | $600.30 |
Average Facebook Ads Cost Per Click (CPC)
The median Facebook Ads cost per click (CPC) across industries is $0.49, providing a baseline for understanding ad spend efficiency.
However, the data reveals significant variation, with CPCs ranging from as low as $0.22 to as high as $1.73. That’s primarily driven by differences in competition, audience value, and market demand.
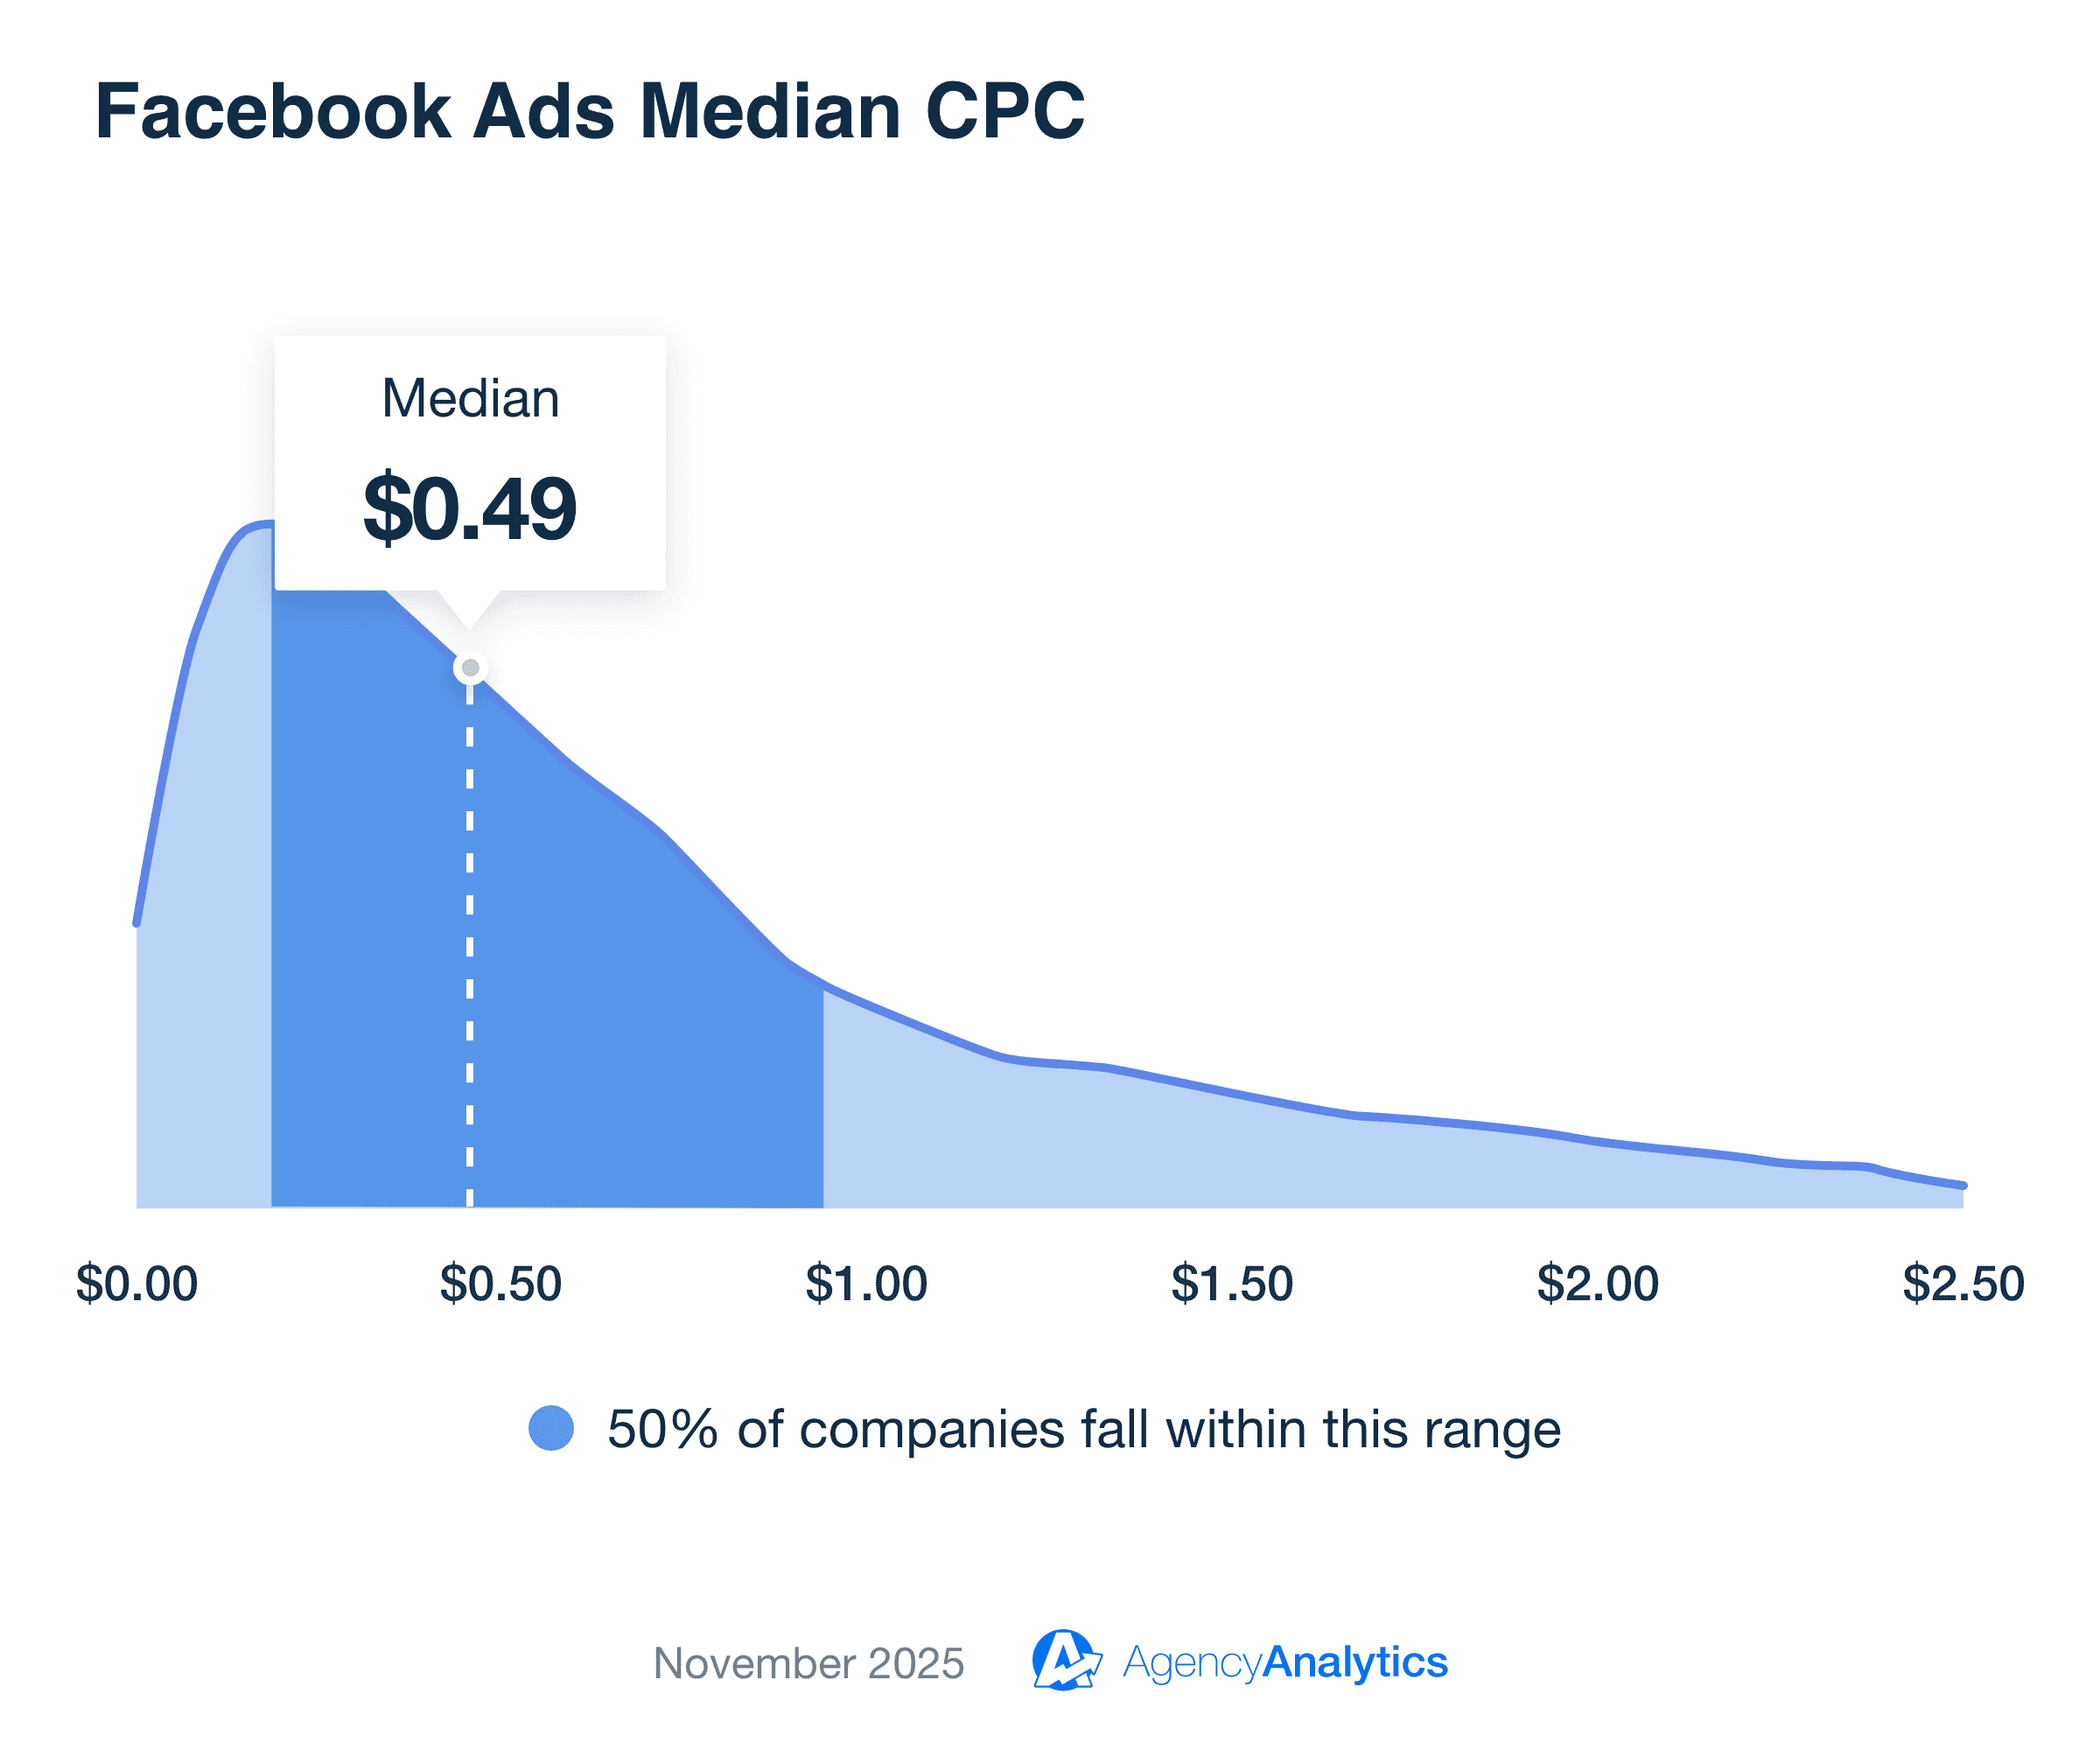
Industries like Agriculture & Farming and Travel report the lowest median CPCs, both coming in at $0.22. These sectors benefit from high engagement and lower competition, allowing businesses to drive ad clicks efficiently. Interestingly, Farming & Agriculture has the highest monthly spend (as we covered before), indicating that this sector likely sees significant returns from Facebook advertising.
On the higher end, Roofing has the highest median CPC at $1.74.
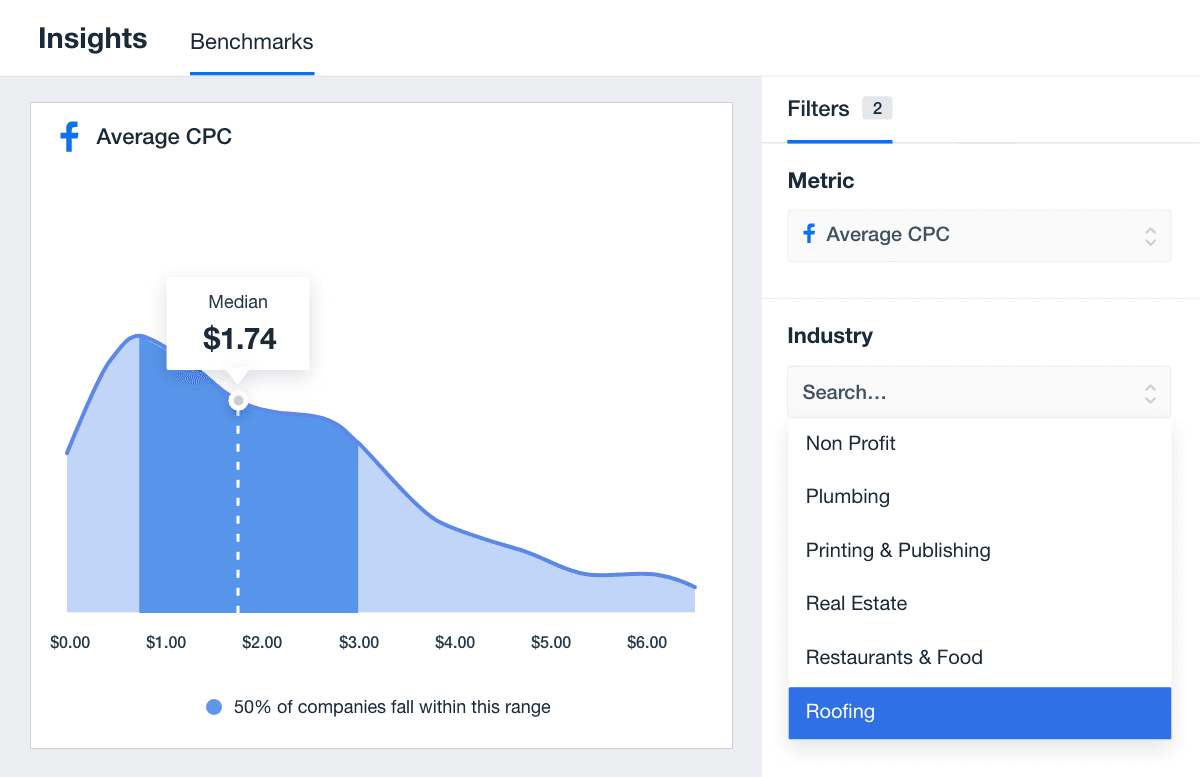
This industry faces increased competition and higher customer acquisition costs due to the significant value of potential customers.
Average Facebook Ads Cost Per Click (CPC)
Industry | Median Facebook Ads CPC by Industry |
|---|---|
Advertising & Marketing | $0.53 |
Agriculture & Farming | $0.22 |
Animals & Pets | $0.35 |
Apparel & Fashion | $0.40 |
Arts & Entertainment | $0.27 |
Attorneys & Legal Services | $0.94 |
Automotive Parts & Services | $0.59 |
Beauty & Personal Care | $0.77 |
Business Services | $0.78 |
Dental Services | $0.74 |
Education | $0.48 |
Finance & Insurance | $0.74 |
Food & Beverage | $0.39 |
Furniture | $0.44 |
Health & Fitness | $0.71 |
Home Improvement | $0.67 |
HVAC Repair | $0.71 |
Non Profit | $0.34 |
Plumbing | $0.71 |
Real Estate | $0.42 |
Restaurants | $0.30 |
Roofing | $1.73 |
Sports & Recreation | $0.44 |
Storage & Moving | $1.22 |
Travel | $0.22 |
Weddings & Events | $0.35 |
Average CTR (Click-through Rate) For Facebook Ads
The median CTR Facebook Ads benchmark across industries is 1.80%.
CTRs will vary depending on several factors, such as content type, industries, audience interest, and competition. Regardless of the sector, use well-researched keywords, compelling imagery, and relevant messaging to make an impact.
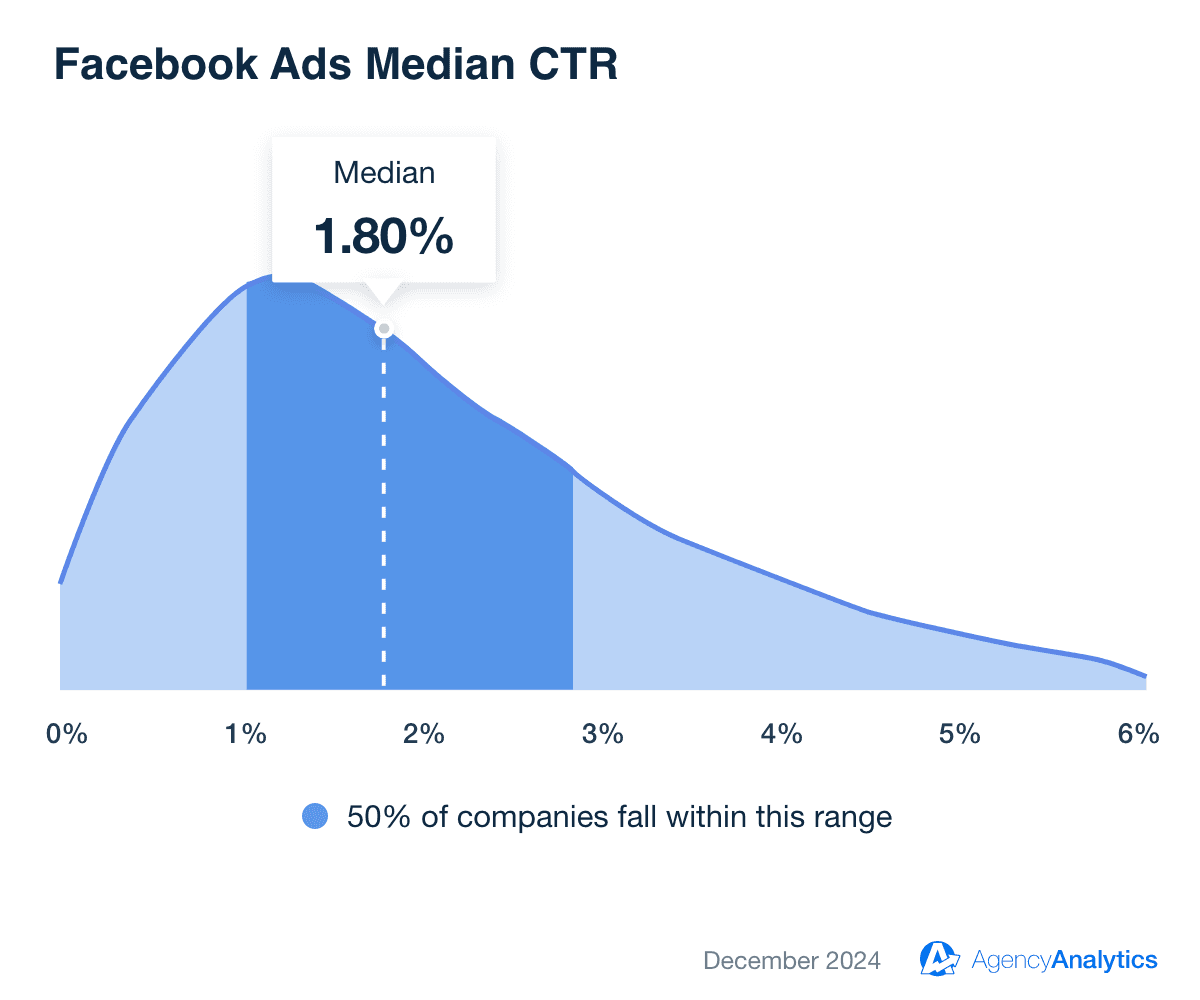
Industries like Weddings & Events lead the way with a median CTR of 3.01%, followed closely by Apparel & Fashion and Arts & Entertainment (both at 2.64%). These high-performing sectors benefit from visually appealing ads that encourage link clicks. There’s also a notable emotional connection and strong consumer interest.
In contrast, the Roofing industry reports the lowest CTR (1.08%). This reflects the practical, high-investment nature of roofing services, where Facebook lead gen campaigns often target users with more immediate needs.
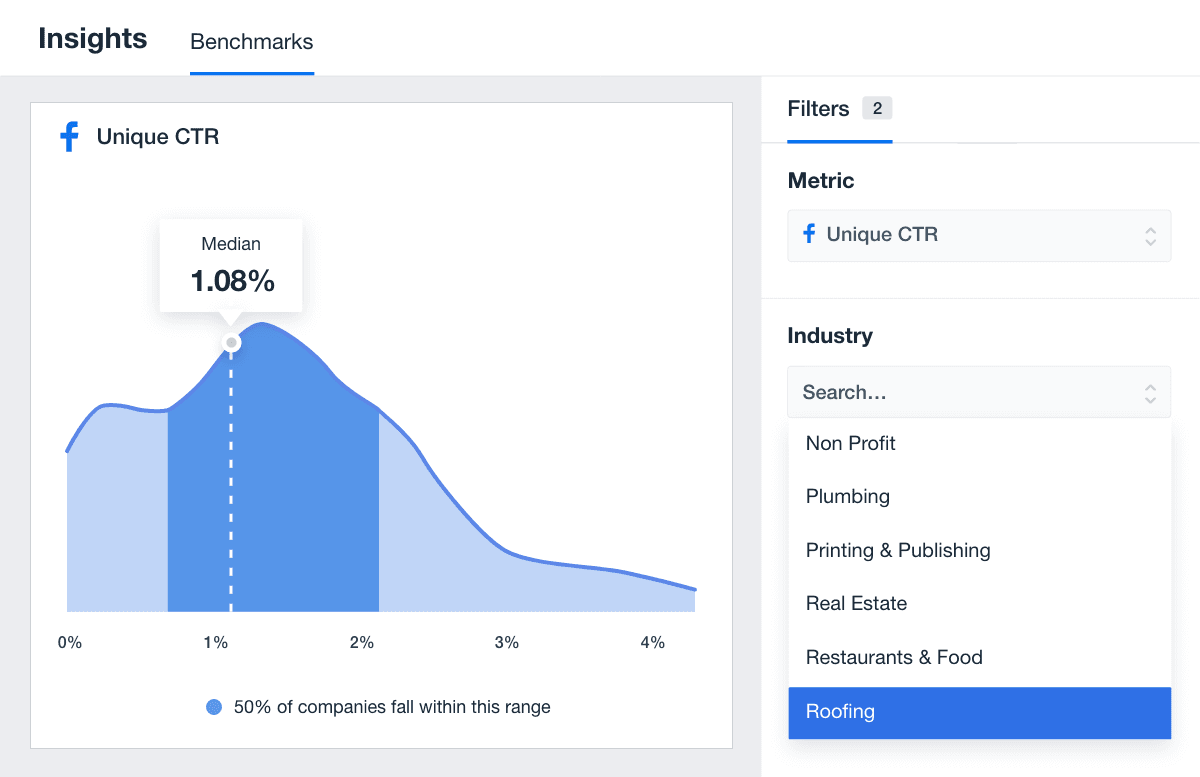
Average Facebook Ads Click-through Rate (CTR) by Industry
Industry | Median Facebook Ads CTR by Industry |
|---|---|
Advertising & Marketing | 1.58% |
Agriculture & Farming | 2.29% |
Animals & Pets | 2.27% |
Apparel & Fashion | 2.64% |
Arts & Entertainment | 2.64% |
Attorneys & Legal Services | 1.40% |
Automotive Parts & Services | 1.45% |
Beauty & Personal Care | 1.58% |
Business Services | 1.70% |
Dental Services | 1.19% |
Education | 1.43% |
Finance & Insurance | 1.19% |
Food & Beverage | 1.64% |
Furniture | 1.97% |
Health & Fitness | 1.70% |
Home Improvement | 1.72% |
HVAC Repair | 1.78% |
Non Profit | 1.82% |
Plumbing | 1.25% |
Real Estate | 2.58% |
Restaurants | 2.08% |
Roofing | 1.08% |
Sports & Recreation | 1.89% |
Travel | 2.54% |
Weddings & Events | 3.01% |
Average Facebook Ads Impressions
The median Facebook Ads impressions across industries is 88,130, with an overall range spanning from 39,975 to 529,000.
Wondering why that may be? Industries with broad appeal may naturally see higher impressions due to larger target audiences. For example, a client with a brand awareness goal may prioritize large-scale Facebook traffic campaigns to attract website visitors.
On the other hand, targeted campaigns often focus on smaller, localized audiences. In these cases, demographic precision takes priority above reach. There may also be a small number of impressions if a more competitive advertising landscape exists.
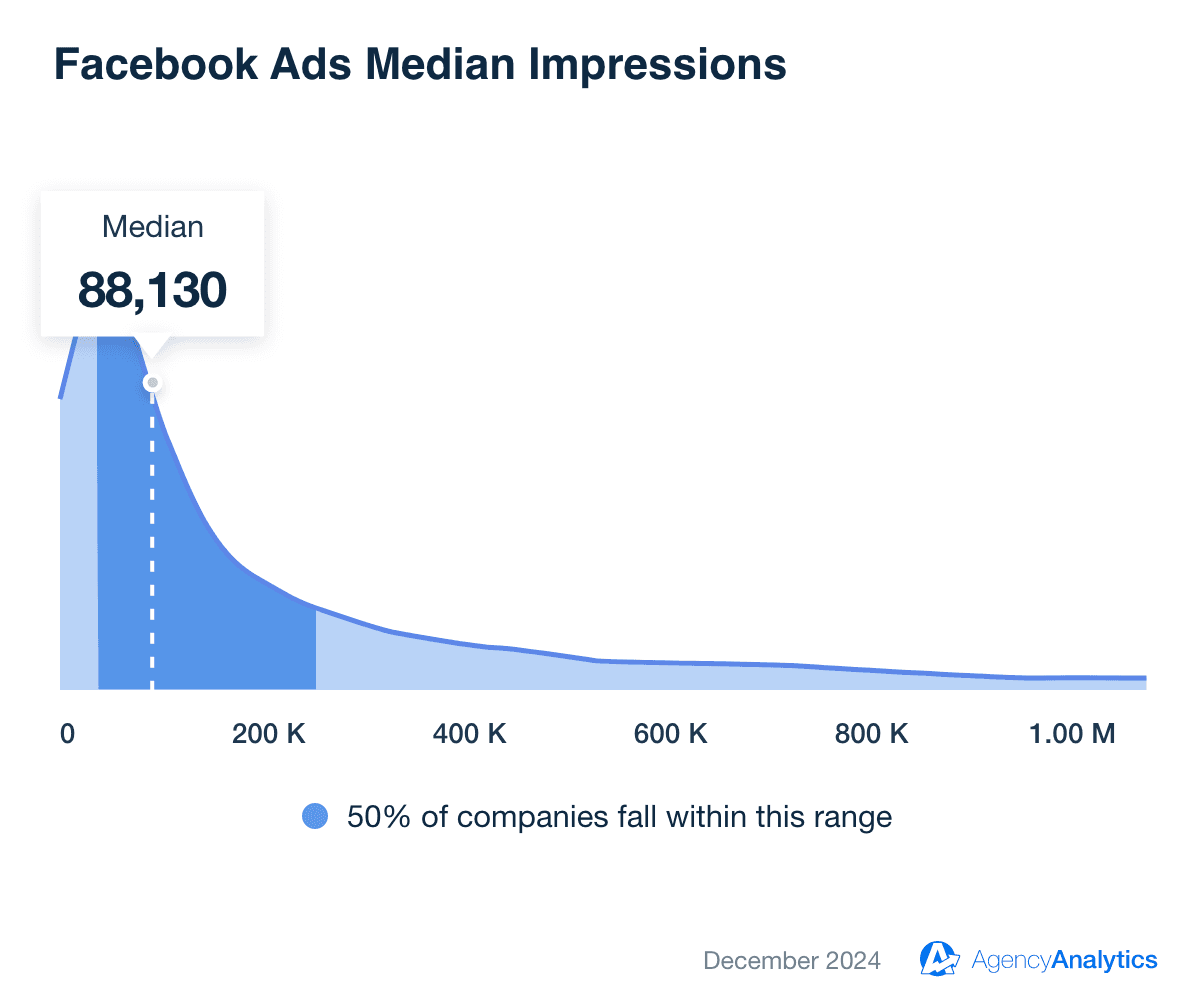
Agriculture & Farming leads all industries with a median of 529,000 impressions, likely driven by broad targeting and lower competition for ad placements. It aligns with our previous benchmark findings (i.e., this sector has the highest monthly spend and average CPC).
On the lower end, the Real Estate industry sees fewer impressions, with a median of 46,906. This is likely because real estate campaigns often target highly localized audiences and focus on users with immediate buying or renting intent.
Additionally, many serious property seekers turn to niche websites or MLS platforms for their searches, while Facebook is often used for passive browsing.
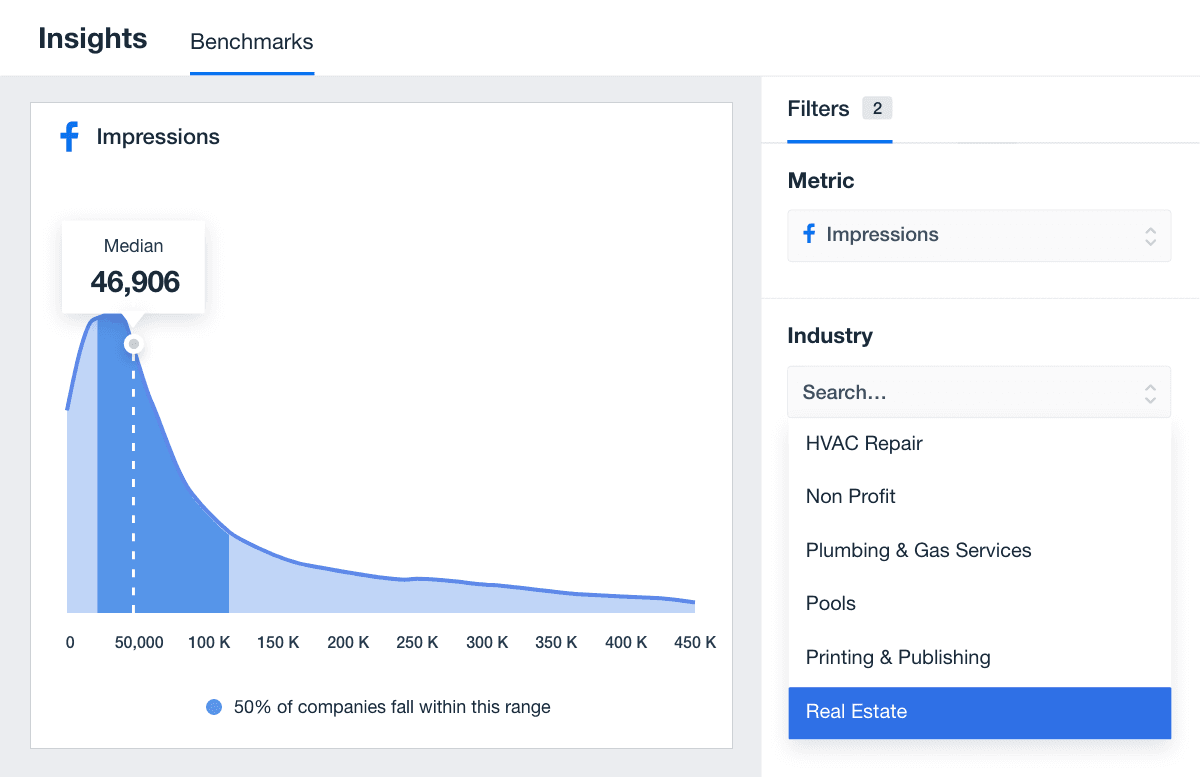
Average Facebook Ads Impressions by Industry
Industry | Median Facebook Ads Impressions by Industry |
|---|---|
Advertising & Marketing | 65,702 |
Agriculture & Farming | 529,000 |
Animals & Pets | 96,198 |
Apparel & Fashion | 224,000 |
Arts & Entertainment | 142,000 |
Attorneys & Legal Services | 54,874 |
Automotive Parts & Services | 55,812 |
Beauty & Personal Care | 102,000 |
Business Services | 70,147 |
Dental Services | 70,388 |
Education | 121,000 |
Finance & Insurance | 99,368 |
Food & Beverage | 199,000 |
Furniture | 265,000 |
Health & Fitness | 75,104 |
Home Improvement | 62,555 |
HVAC Repair | 94,712 |
Non Profit | 185,000 |
Plumbing | 56,466 |
Real Estate | 46,906 |
Restaurants | 108,000 |
Roofing | 59,642 |
Sports & Recreation | 148,000 |
Travel | 112,000 |
Average Facebook Ads Website Purchase Conversion Value
The median Facebook Ads website purchase conversion value across industries is $5,823.40. With values ranging from $1,450.44 to $12,794.81, this data highlights the varying profitability and customer lifetime value across sectors.
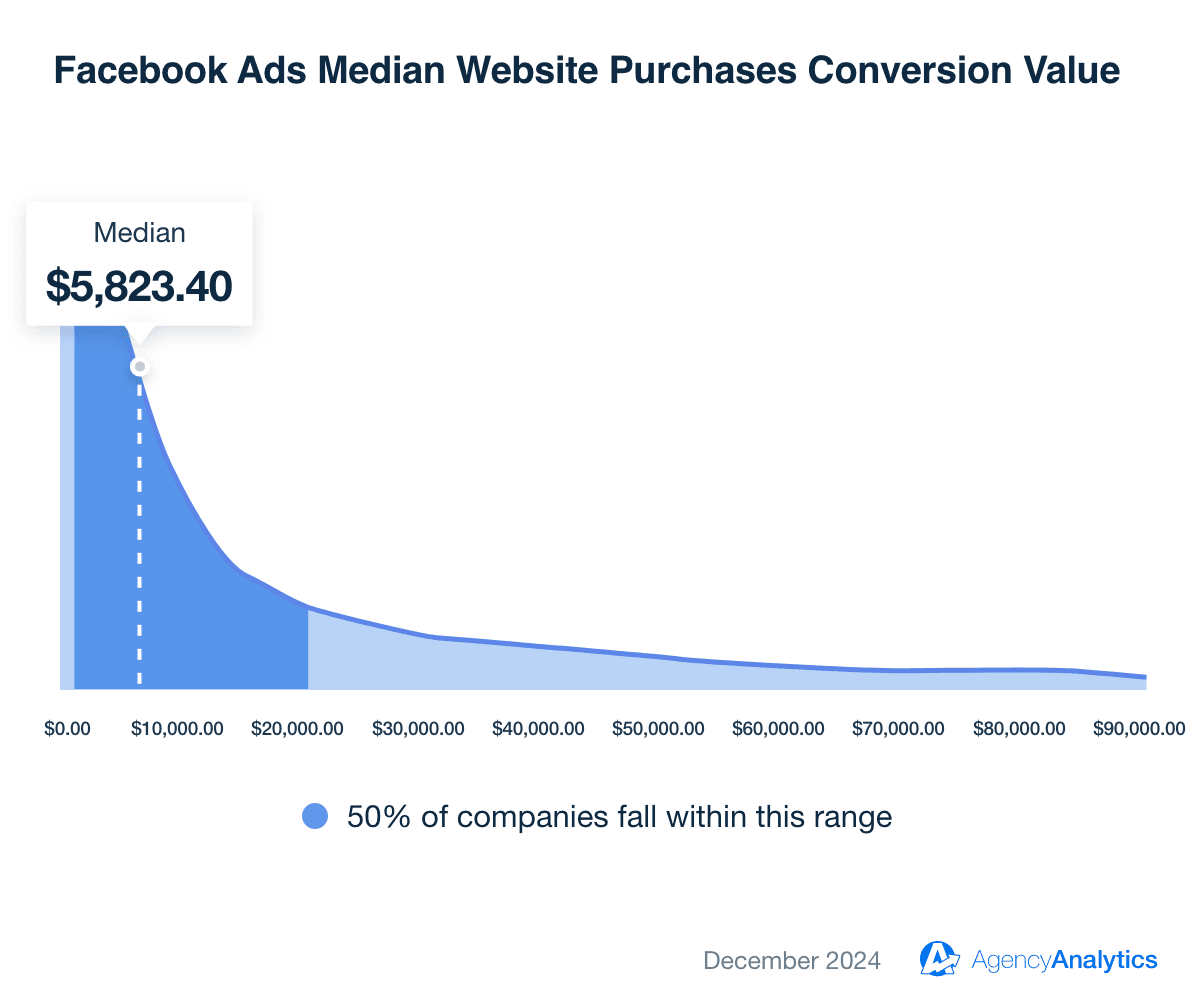
Education has the highest median website purchase conversion value: A whopping $12,794.81. It likely reflects the high value of course enrollments, certifications, or tuition-related transactions.
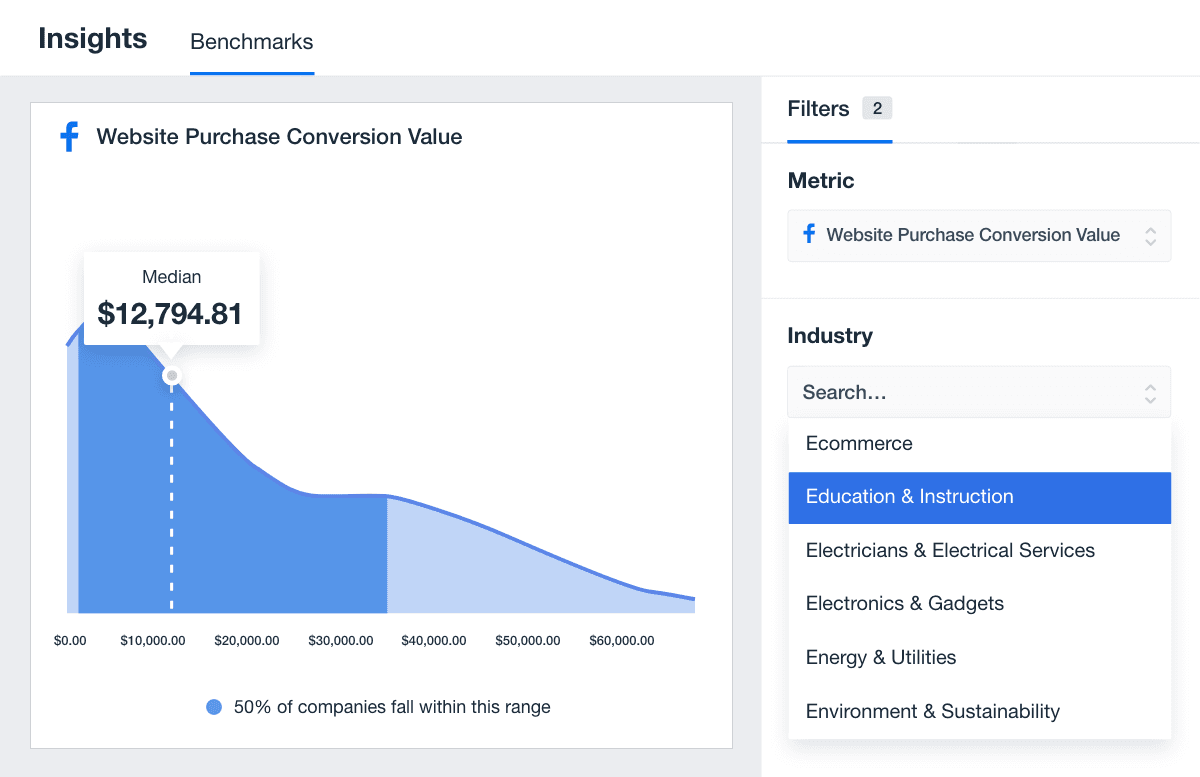
On the flip side, sectors like Health & Fitness report a lower median conversion value of $1,949.70. While the average transaction value is smaller, this aligns with the typically lower price points of health products and services. Plus, these campaigns often prioritize volume over individual transaction size, focusing on customer retention and repeat purchases.
Average Facebook Ads Website Purchase Conversion Value by Industry
Industry | Median Website Conversion Value |
|---|---|
Advertising & Marketing | $4,099.00 |
Animals & Pets | $6,809.94 |
Apparel & Fashion | $11,359.78 |
Arts & Entertainment | $4,146.49 |
Beauty & Personal Care | $4,399.29 |
Education | $12,794.81 |
Food & Beverage | $4,338.79 |
Furniture | $10,203,65 |
Health & Fitness | $1,949.70 |
Home Improvement | $6,243.21 |
Restaurants | $2,844.95 |
Shopping, Collectibles & Gifts | $9,618.29 |
Sports & Recreation | $5,182.00 |
Travel | $5,342.72 |
Facebook Ads benchmarks provide deeper insights into campaign performance.
However, interpreting benchmarks requires context—what might appear as a “low” or “high” metric at first glance isn’t always the whole picture. No two Facebook ad accounts are the same, either. Understanding the story behind the data helps align campaign strategies with client goals and maximize results.
When a High Average Cost Per Click (CPC) Isn’t Always Bad
A high CPC doesn’t always look good on paper. However, it may result in more valuable, relevant clicks–especially in industries with longer sales cycles or significantly higher customer lifetime values (e.g., Legal Services).
In other words, a higher CPC doesn’t mean Facebook lead ads aren’t working–in fact, it may reflect a more targeted audience with greater purchase intent. That’s why it’s important to consider all tangible outcomes and related metrics.
When a High Clickthrough Rate (CTR) Might Signal Potential Problems
A high CTR is typically seen as positive, but sometimes signals misaligned targeting or ad creatives. If users click on an ad but don’t convert, it could mean the content, offer, or landing page doesn’t match their expectations. In such cases, ensure there’s audience targeting and relevant ad copy.
It may also mean removing bottlenecks in the conversion process, like reducing a lengthy landing page or adding strategically placed CTAs.
Using Benchmarks To Identify Opportunities for Optimization
Benchmarks pinpoint areas where Facebook ad strategies fall short or exceed industry norms. For example, if a Beauty & Personal Care campaign reports a CTR below the industry median of 1.58%, this might suggest an opportunity to improve creatives and avoid ad fatigue.
Similarly, a lower-than-average website conversion value in sectors like Apparel & Fashion may indicate untapped opportunities (e.g., introducing promotions to increase cart values). It may also mean investing in other efforts to boost overall brand traction, like SEO tweaks, traffic campaigns, or search ads on other platforms.
Using Benchmarks to Position Your Marketing Agency
Leveraging Facebook advertising benchmarks allows agencies to position themselves as data-driven experts. For instance, say a campaign for a Travel client achieves a 2.8% CTR compared to the industry median of 2.54%; it shows your agency’s ability to create engaging paid ads.
By highlighting above-average results in client reports, you’ll demonstrate measurable success that increases retention over time.
To summarize, interpreting Facebook Ads industry benchmarks goes beyond surface-level analysis–the key lies in understanding the broader context.
Once you’ve considered all the moving parts, leverage benchmarks to spot optimization opportunities, fix inefficiencies, and position your agency as a reliable partner. That way, you’re not just reporting numbers—you’re delivering actionable insights that drive real results.

Written by
Faryal Khan is a multidisciplinary creative with 10+ years of experience in marketing and communications. Drawing on her background in statistics and psychology, she fuses storytelling with data to craft narratives that both inform and inspire.
Read more posts by Faryal KhanSee how 7,000+ marketing agencies help clients win
Free 14-day trial. No credit card required.


